. 2017 Apr;20(4):581-589.
doi: 10.1038/nn.4520. Epub 2017 Mar 6.

Dopamine reward prediction errors reflect hidden-state inference across time

Affiliations

Dopamine reward prediction errors reflect hidden-state inference across time

Clara Kwon Starkweather et al. Nat Neurosci. 2017 Apr.

Abstract

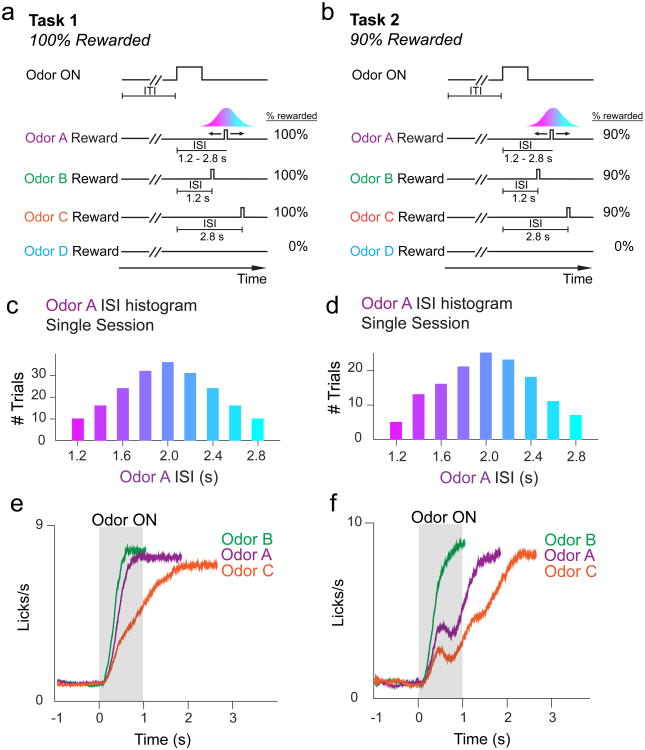
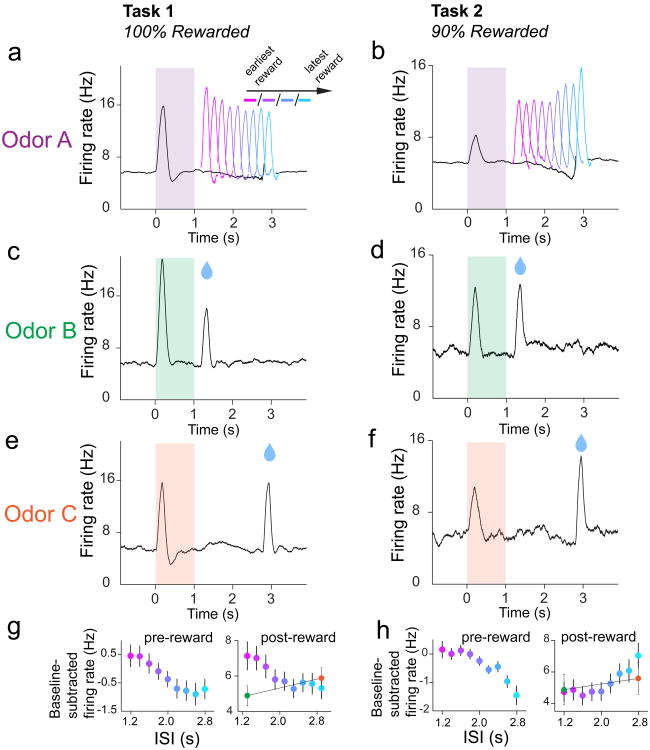
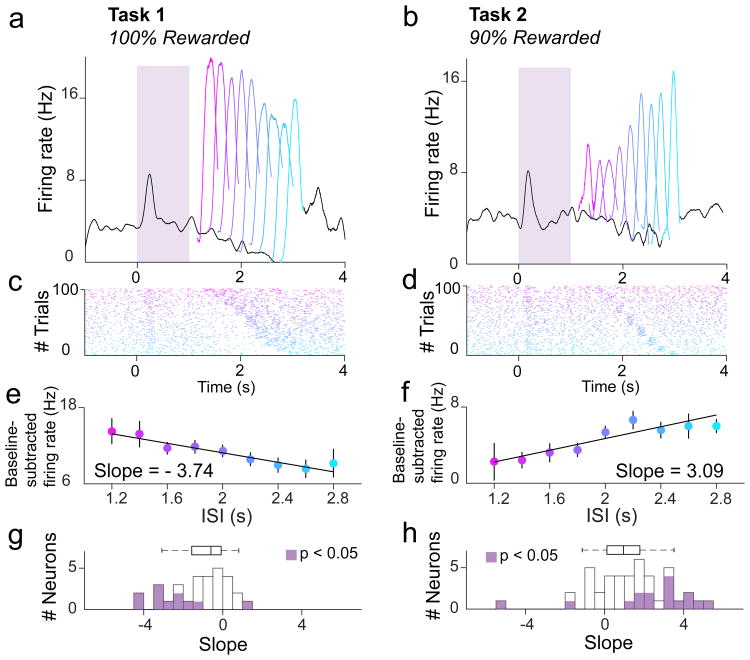
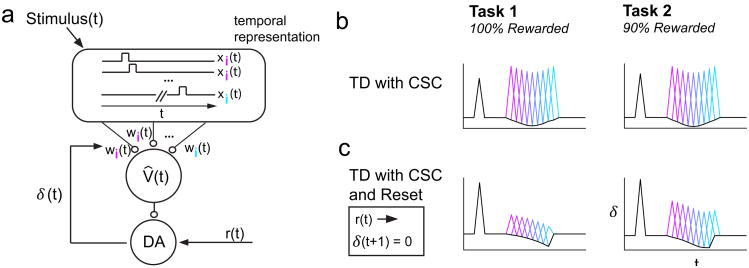
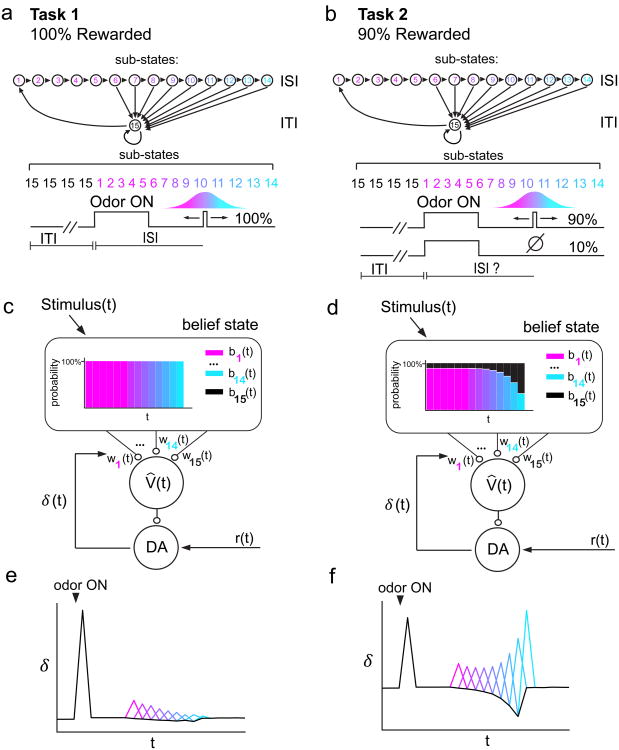
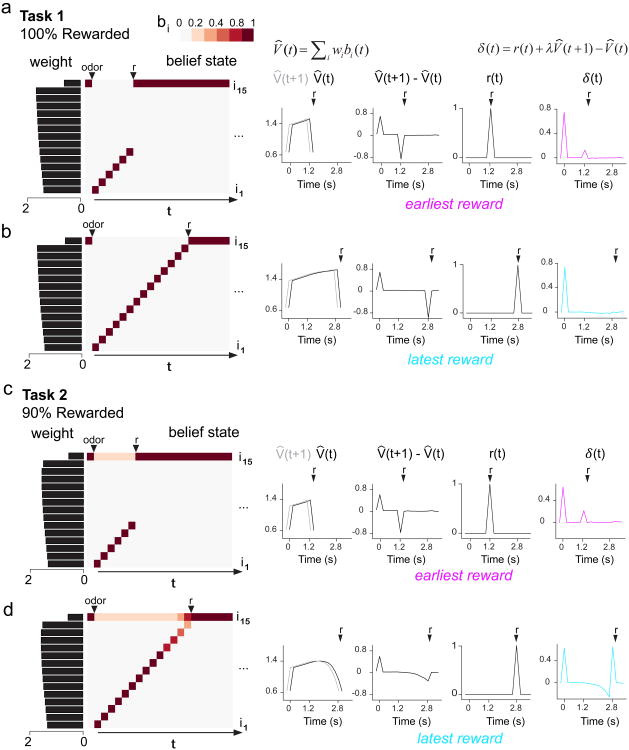
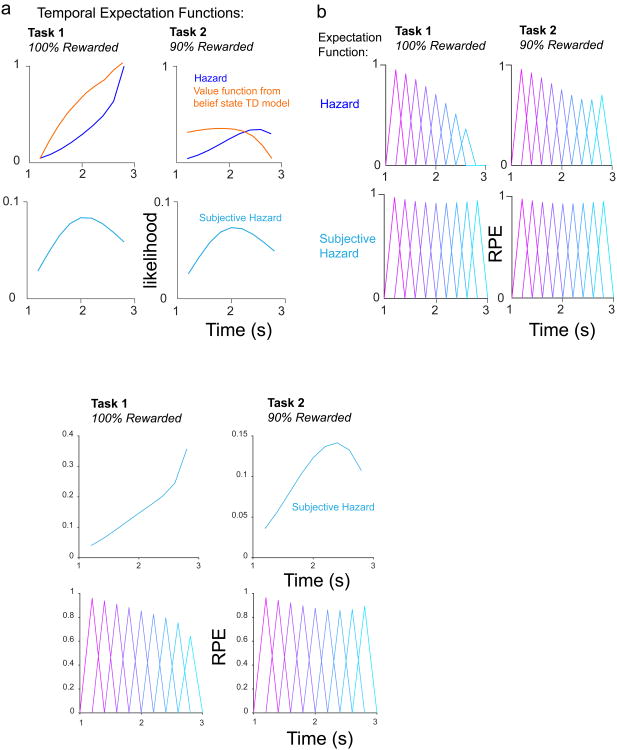
Midbrain dopamine neurons signal reward prediction error (RPE), or actual minus expected reward. The temporal difference (TD) learning model has been a cornerstone in understanding how dopamine RPEs could drive associative learning. Classically, TD learning imparts value to features that serially track elapsed time relative to observable stimuli. In the real world, however, sensory stimuli provide ambiguous information about the hidden state of the environment, leading to the proposal that TD learning might instead compute a value signal based on an inferred distribution of hidden states (a 'belief state'). Here we asked whether dopaminergic signaling supports a TD learning framework that operates over hidden states. We found that dopamine signaling showed a notable difference between two tasks that differed only with respect to whether reward was delivered in a deterministic manner. Our results favor an associative learning rule that combines cached values with hidden-state inference.


Figures

Figure 1
Figure 1. Task design
a, In Task 1, rewarded odors forecasted a 100% chance of reward delivery. Odors B and C trials had constant ISIs, while odor A trials had a variable ISI drawn from a discretized Gaussian distribution defined over 9 timepoints. b, In Task 2, rewarded odors forecasted a 90% chance of reward delivery. ISIs for each odor were identical to Task 1. c, Histogram of ISIs for odor A trials during an example Task 1 recording session, showing 9 possible reward delivery times. d, Histogram of ISIs for odor A trials during an example Task 2 recording session. e-f, Averaged non-normalized PSTH for licking behavior across all Task 1 (e) and Task 2 (f) recording sessions. Animals lick sooner for Odor B (ISI = 1.2s) than for Odor C (ISI = 2.8s) trials. Licking patterns for Odor A (variable ISI centered around 2.0s) fall in between licking patterns for Odor B and Odor C.
Figure 2
Figure 2. Averaged dopamine activity in Tasks 1 and 2 shows different patterns of modulation over variable ISI interval
a, Average non-normalized PSTH for all 30 dopamine neurons recorded during Odor A trials in Task 1. Average pre- and post-reward dopamine RPE's were negatively modulated by time (post-reward firing: F8,232 = 5.56, P = 1.9 × 10⁻⁶, 2-way ANOVA; factors: ISI, neuron; pre-reward firing: F8,232=4.76, P = 2.0 × 10⁻⁵, 2-way ANOVA; factors: ISI, neuron). b, Average PSTH for all 43 dopamine neurons recorded during Odor A trials in Task 2 (includes neurons from Task 2b). Pre-reward dopamine RPE's (400-0ms prior to reward onset) tended to be negatively modulated by time, while post-reward RPE's (50-300ms following reward onset) tended to be positively modulated by time (post-reward firing: F8,336 = 8.23, P = 3.48 × 10⁻¹⁰, 2-way ANOVA; factors: ISI, neuron; pre-reward firing: F8,336 = 7.86, P = 1.0 × 10⁻⁹, 2-way ANOVA; factors: ISI, neuron). c-f, Average PSTHs for odor B and C trials in Tasks 1 and 2. g-h, Summary plots for average pre- and post-reward firing (mean ± s.e.m.).
Figure 3
Figure 3. Individual dopamine neurons show opposing patterns of post-reward firing in Tasks 1 and 2
a,b,PSTH for two example dopamine neurons during odor A trials of a single recording session in Task 1 (a) or Task 2 (b), respectively. c,d, Raster plots for the first 100 odor A trials of a single recording session in Task 1 (c) or Task 2 (d). e,f, Examples of single-unit analysis. A best-fit line was drawn through a plot relating the ISI to the post-reward firing rate (50-300ms following reward onset) for each odor A trial in Task 1 (e) or Task 2 (f). g,h, Slopes of best-fit lines in Task 1 (g) or Task 2 (h), as shown in (e) and (f), for all dopamine neurons recorded. Purple shading indicates P < 0.05, or a 95% confidence interval for the slope coefficient that does overlap with 0.
Figure 4
Figure 4. TD with CSC model, with or without Reset, is inconsistent with our data
a, Schematic adapted from. The CSC temporal representation comprises features x(t) = {x1(t), x2(t), …} that are weighted to produce an estimated value signal (t). δ(t) reports a mismatch between value predictions, and is used to update the weights of corresponding features. b, TD with CSC produces a pattern of RPEs that resembles a flipped probability distribution, for both Tasks 1 and 2. c, TD with CSC and Reset produces a pattern of RPEs that decreases over time, for both Tasks 1 and 2.
Figure 5
Figure 5. Belief state model is consistent with our data
a,b, In our model, the ISI and ITI states comprise sub-states 1-15 c,d, The CSC temporal representation is swapped for a belief state. Expected value is the linear sum of both weight and belief state (t) = Σiwibi(t). In Task 1 (c), the belief state sequentially assigns 100% probability to each ISI sub-state as time elapses after odor onset. In Task 2 (d), the belief state gradually shifts in favor of the ITI as time elapses and reward fails to arrive. e,f, Belief state model captures the opposing post-reward firing patterns between Task 1 (e) and Task 2 (f) (see Supplementary Fig. 8 for quantification). This model also captures negative temporal modulation of pre-reward firing in both Tasks.
Figure 6
Figure 6. Belief state model shapes value signals that differ between Tasks 1 and 2, leading to opposite patterns of post-reward modulation over time
a,b, As time elapses following odor onset in Task 1, the belief state proceeds through ISI sub-states (i1-i14) by sequentially assigning a probability of 100% to each sub-state. Later ISI sub-states accrue greater weights. Estimated value is approximated as the dot product of belief state and weight, producing a ramping value signal that increasingly suppresses δ(t) for longer ISIs. c,d, As time elapses following odor onset in Task 2, the belief state comprises a probability distribution that gradually decreases for ISI sub-states (i1-i14) and gradually increases for the ITI sub-state (i15). This produces a value signal that declines for longer ISIs, resulting in the least suppression of δ(t) for the latest ISI.
Figure 7
Figure 7. Hazard and subjective hazard functions cannot explain the trend of our data
a, Hazard and subjective hazard functions deviate substantially from the trend of value expectation over time in our belief state TD model, particularly in Task 2. Note the value functions are scaled versions of those shown in Fig. 6b,d to aid visual comparison of trends over time. b, Illustration of how RPEs would appear in our data, if the reward expectation signal corresponded to hazard or subjective hazard functions.

References

References for Main Text

    1. Schultz W, Dayan P, Montague PR. A neural substrate of prediction and reward. Science. 1997;275:1593–1599. - PubMed
    1. Bayer HM, Glimcher PW. Midbrain dopamine neurons encode a quantitative reward prediction error signal. Neuron. 2005;47:129–141. - PMC - PubMed
    1. Cohen JY, Haesler S, Vong L, Lowell B, Uchida N. Neuron-type-specific signals for reward and punishment in the ventral tegmental area. Nature. 2012;482:85–88. - PMC - PubMed
    1. Eshel N, et al. Arithmetic and local circuitry underlying dopamine prediction errors. Nature. 2015;525:243–246. - PMC - PubMed
    1. Sutton RS, Barto AG. Time-Derivative Models of Pavlovian Reinforcement. In: Gabriel M, Moore J, editors. Learning and Computational Neuroscience: Foundations of Adaptive Networks. Cambridge, MA: MIT Press; pp. 497–537.

Methods-Only References

    1. Backman C, et al. Characterization of a Mouse Strain Expressing Cre Recombinase From the 30 Untranslated Region of the Dopamine Transporter Locus. Genesis. 2007;45:418–426. - PubMed
    1. Atasoy D, Aponte Y, Su HH, Sternson SM. A FLEX Switch Targets Channelrhodopsin-2 to Multiple cell types for imaging and long-range circuit mapping. J Neurosci. 2008;28:7025–7030. - PMC - PubMed
    1. Uchida N, Mainen ZF. Speed and accuracy of olfactory discrimination in the rat. Nat Neurosci. 2003;6:1224–1229. - PubMed
    1. Schmitzer-Torbert N, Jackson J, Henze D, Harris K, Redish AD. Quantitative measures of cluster quality for use in extracellular recordings. Neuroscience. 2005;131:1–11. - PubMed
    1. Lima SQ, Hromádka T, Znamenskiy P, Zador AM. PINP: A New Method of Tagging Neuronal Populations for Identification during In Vivo Electrophysiological Recording. PLoS One. 2009;4:e6099. - PMC - PubMed