. 2017 Apr;23(4):493-500.
doi: 10.1038/nm.4296. Epub 2017 Feb 27.

Therapeutic targeting of polycomb and BET bromodomain proteins in diffuse intrinsic pontine gliomas

Affiliations

Therapeutic targeting of polycomb and BET bromodomain proteins in diffuse intrinsic pontine gliomas

Andrea Piunti et al. Nat Med. 2017 Apr.

Abstract

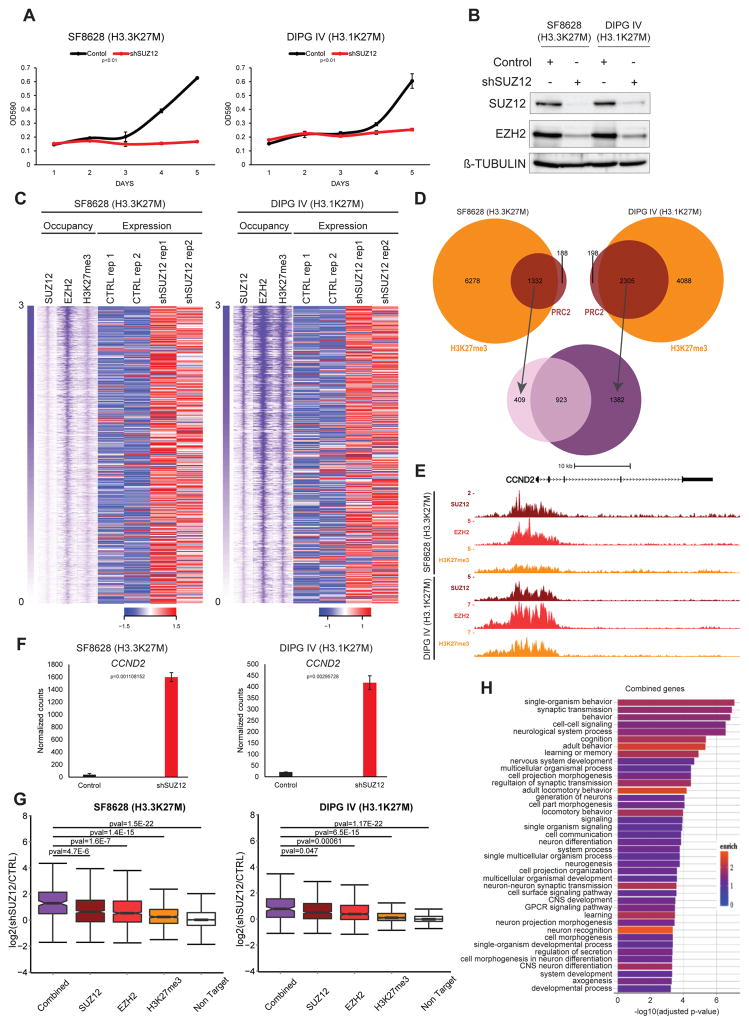
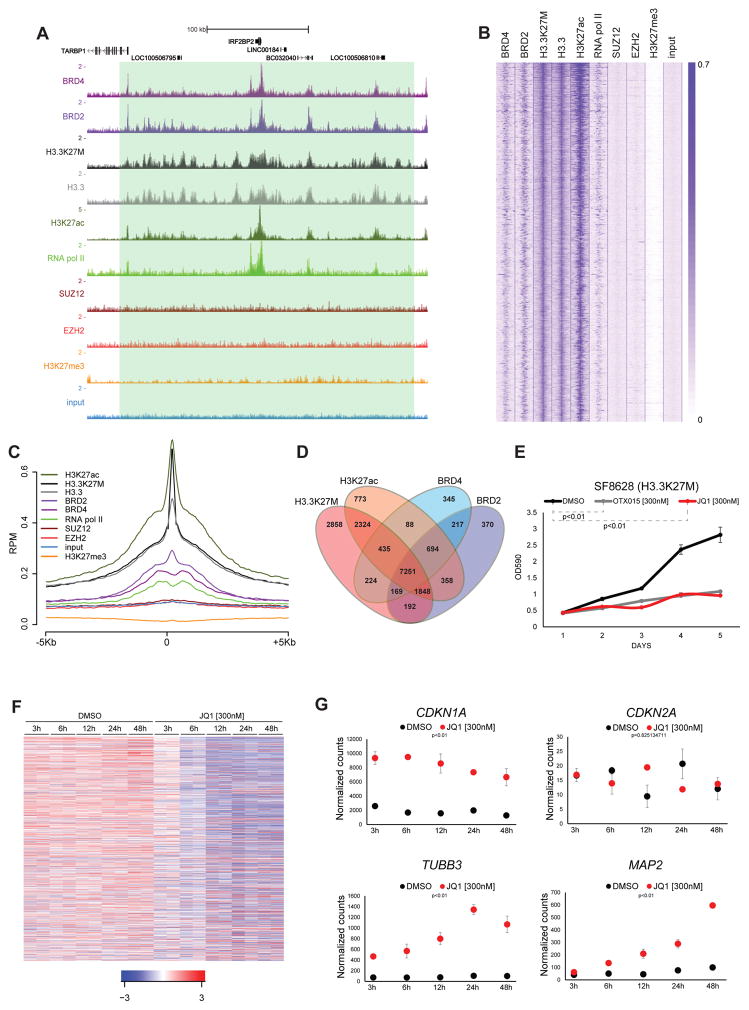
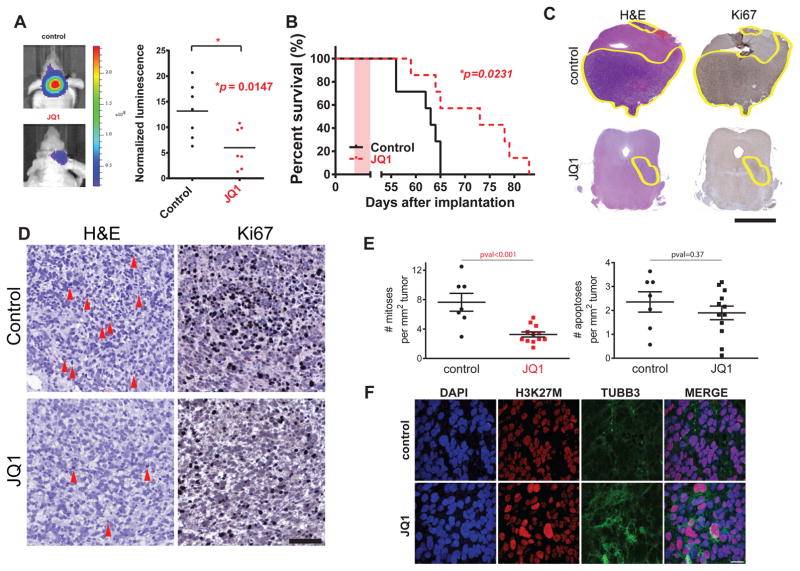
Diffuse intrinsic pontine glioma (DIPG) is a highly aggressive pediatric brainstem tumor characterized by rapid and uniform patient demise. A heterozygous point mutation of histone H3 occurs in more than 80% of these tumors and results in a lysine-to-methionine substitution (H3K27M). Expression of this histone mutant is accompanied by a reduction in the levels of polycomb repressive complex 2 (PRC2)-mediated H3K27 trimethylation (H3K27me3), and this is hypothesized to be a driving event of DIPG oncogenesis. Despite a major loss of H3K27me3, PRC2 activity is still detected in DIPG cells positive for H3K27M. To investigate the functional roles of H3K27M and PRC2 in DIPG pathogenesis, we profiled the epigenome of H3K27M-mutant DIPG cells and found that H3K27M associates with increased H3K27 acetylation (H3K27ac). In accordance with previous biochemical data, the majority of the heterotypic H3K27M-K27ac nucleosomes colocalize with bromodomain proteins at the loci of actively transcribed genes, whereas PRC2 is excluded from these regions; this suggests that H3K27M does not sequester PRC2 on chromatin. Residual PRC2 activity is required to maintain DIPG proliferative potential, by repressing neuronal differentiation and function. Finally, to examine the therapeutic potential of blocking the recruitment of bromodomain proteins by heterotypic H3K27M-K27ac nucleosomes in DIPG cells, we performed treatments in vivo with BET bromodomain inhibitors and demonstrate that they efficiently inhibit tumor progression, thus identifying this class of compounds as potential therapeutics in DIPG.


Conflict of interest statement

COMPETING FINANCIAL INTERESTS

The authors declare no competing financial interests.

Figures

Figure 1
Figure 1. H3K27M correlates with H3K27ac and is excluded from PRC2 targets
(A) Representative UCSC genome browser views of genomic regions enriched after chromatin immunoprecipitation (ChIP) for histones, histone post-translational modifications and proteins listed on the left of each track in SF8628. Input served as background control. (B) Heat map analysis of the most highly H3.3K27M enriched genomic loci (first 5000 in descending order top to bottom) in SF8628. The center of each vertical lane represents the summit of the peak while the left and right borders represent −5 kb and +5 kb, respectively. All the other antigens occupancy at those regions are plotted accordingly. Input served as background control. Scale bar represents relative intensities. (C) Metaplot showing average signal accumulation (RPM, reads per million) of the top 5000 regions bound by H3.3K27M in SF8628. All the other antigens average occupancy at those regions are plotted accordingly. Each plot is centered on the summit of the average occupancy and extended 5 kb upstream and downstream (−5kb and +5kb, respectively). Input served as background control. (D) Western blot analysis of immunoprecipitated (IP) histone H3K27ac from mononucleosomes containing C-terminal FLAG-tagged wild type H3.3 or mutant H3.3K27M purified from 293T cells (image representative of at least 2 independent experiments. Uncropped images in Supplementary Figure 18). (E) Same as (A). (F) As described in (B) showing 5000 most enriched regions bound by H3K27me3.
Figure 2
Figure 2. PRC2 is required for the oncogenic potential of H3K27M DIPG cells
(A) (left) 5-days growth curve of SF8628 and (right) DIPG IV stably expressing a SUZ12 specific shRNA compared to control. The plots represent crystal violet absorbance quantification (λ=590 nm) measured at each day (one representative of 2 independent experiments. Each point is an average of cell culture replicates, n=3). Error bars indicate SD. P-values from a two-tailed unpaired t-test. (B) Western blot analysis of SUZ12 and EZH2 protein levels in SF8628 stably expressing a SUZ12 specific shRNA compared to control. β-TUBULIN served as loading control. Image representative of at least 2 independent experiments. Uncropped images in Supplementary Figure 18. (C) Top 1000 transcription start sites (TSS) occupied by PRC2 and H3K27me3 and relative heat map representing the transcript levels (normalized RNA-seq intensities) of TSS associated genes in SF8628 and DIPG IV upon SUZ12 knockdown compared to control (CTRL). Occupancy is ranked and centered accordingly to SUZ12 1000 most bound TSS (extended 5kb downstream and upstream). RNA-seq data shown are from 2 independent experiments. Row z-score scale legend is shown. Scale bar represents relative intensities. (D) Venn diagram representing TSS bound by PRC2 (SUZ12 and EZH2) and H3K27me3 in SF8628 and DIPG IV. (E) UCSC genome browser snapshot of the CCND2 locus showing PRC2 and H3K27me3 enrichment in both SF8628 and DIPG IV. (F) Transcriptional levels of CCND2 in both SF8628 and DIPG IV upon SUZ12 knockdown compared to control. Normalized counts from RNA-seq (mean values from independent experiments, n=2). Error bars indicate SD. (G) Boxplot analyses representing the transcriptional levels of all the direct EZH2, SUZ12 and H3K27me3 targets in both SF8628 and DIPG IV upon SUZ12 knockdown compared to control. The Combined boxplot refers to the 923 common PRC2 and H3K27me3 target genes between the two DIPG cells. The Non Target boxplot represents all the genes non-PRC2 and non-H3K27me3 targets. P-values from a two-tailed unpaired t-test is shown. (H) Gene ontology (GO) analyses of common genes in both SF8628 and DIPG IV. Adjust p-value and relative enrichment (color coded) for each class is shown.
Figure 3
Figure 3. Bromodomain proteins inhibition impairs proliferation and triggers differentiation of H3K27M positive DIPG cells
(A) Same as in Fig. 1A. (B–C) Same as in Fig. 1B–C. (D) Venn diagrams with numbers of individual and overlapping target genes in the indicated ChIP-seq samples in SF8628. (E) 5-days growth curve of SF8628 treated with JQ1 [300nM] and OTX015 [300nM] compared to DMSO. The plot represents a crystal violet absorbance quantification (λ=590 nm) measured at each day (one representative of at least 3 independent experiments is presented, each point is an average of cell culture replicates, n=3). Error bars indicate SD. (F) Heat map of relative transcriptional levels (RNA-seq) changes during JQ1 [300nM] compared to DMSO time course in SF8628 (independent experiments, n=2). Genes represented (n=415, 369 downregulated, 46 upregulated. Adjust pval<0.01). Row z-score scale legend is shown. (G) Transcriptional levels of CDKN1A, CDKN2A, TUBB3 and MAP2 in SF8628 during JQ1 [300nM] and DMSO time course treatment. Normalized counts from RNA-seq (each point is the mean of values from independent experiments, n=2). P-values from a two-tailed unpaired t-test. Error bars indicate SD.
Figure 4
Figure 4. Bromodomain proteins inhibition significantly extends survival of DIPG xenograft model
(A) Tumor volume was measured by bioluminescence imaging after 10 days treatment with JQ1 [50 mg/Kg] or vehicle (control). (left) tumor bioluminescence from representative JQ1 and control treated mice, (right) normalized bioluminescence values control and JQ1 treated mice. Bars indicate the mean of each group. A two-tailed unpaired t-test was used to compare control and JQ1 treated groups (n=7, each group). (B) DIPG xenografts mice were generated by SF8628 injection in the brainstem. Survival curves for JQ1 and control treated mice. Pink shaded areas indicate the duration of treatment. P-value was obtained using a long-rank test. (C) Digital scan of representative sections of xenograft DIPG showing haematoxylin and eosin (H&E) and Ki67 immunohistochemical (IHC) stainings in control and JQ1 treated mice. Scale bar = 2.5mm. (D) High magnification of representative photomicrograph of H&E and Ki67 IHC in tumor sections from control and JQ1 treated mice. Red arrows indicate mitotic events. Scale bar = 100μm. (E) Quantification of mitotic and apoptotic events in JQ1 and control treated mice, (n=7 for control group, n=12 JQ1 treated group). Each dot represents an average of 10 independent power fields for each tumor. P-value from a two-tailed unpaired t-test is shown. (F) Representative confocal images showing double immunostaining for H3K27M and TUBB3 in DIPG xenograft sections from control and JQ1 treated mice. Nuclei are identified by DAPI staining. Scale bar = 20μm.

Comment in

Similar articles

Cited by

References

    1. Schroeder KM, Hoeman CM, Becher OJ. Children are not just little adults: recent advances in understanding of diffuse intrinsic pontine glioma biology. Pediatr Res. 2014;75:205–209. doi: 10.1038/pr.2013.194. - DOI - PubMed
    1. Schwartzentruber J, et al. Driver mutations in histone H3.3 and chromatin remodelling genes in paediatric glioblastoma. Nature. 2012;482:226–231. doi: 10.1038/nature10833. - DOI - PubMed
    1. Wu G, et al. Somatic histone H3 alterations in pediatric diffuse intrinsic pontine gliomas and non-brainstem glioblastomas. Nature genetics. 2012;44:251–253. doi: 10.1038/ng.1102. - DOI - PMC - PubMed
    1. Lewis PW, et al. Inhibition of PRC2 activity by a gain-of-function H3 mutation found in pediatric glioblastoma. Science. 2013;340:857–861. doi: 10.1126/science.1232245. - DOI - PMC - PubMed
    1. Herz HM, et al. Histone H3 lysine-to-methionine mutants as a paradigm to study chromatin signaling. Science. 2014;345:1065–1070. doi: 10.1126/science.1255104. - DOI - PMC - PubMed

MeSH terms