. 2017 Apr;23(4):461-471.
doi: 10.1038/nm.4291. Epub 2017 Feb 27.

A subset of platinum-containing chemotherapeutic agents kills cells by inducing ribosome biogenesis stress

Affiliations

A subset of platinum-containing chemotherapeutic agents kills cells by inducing ribosome biogenesis stress

Peter M Bruno et al. Nat Med. 2017 Apr.

Abstract

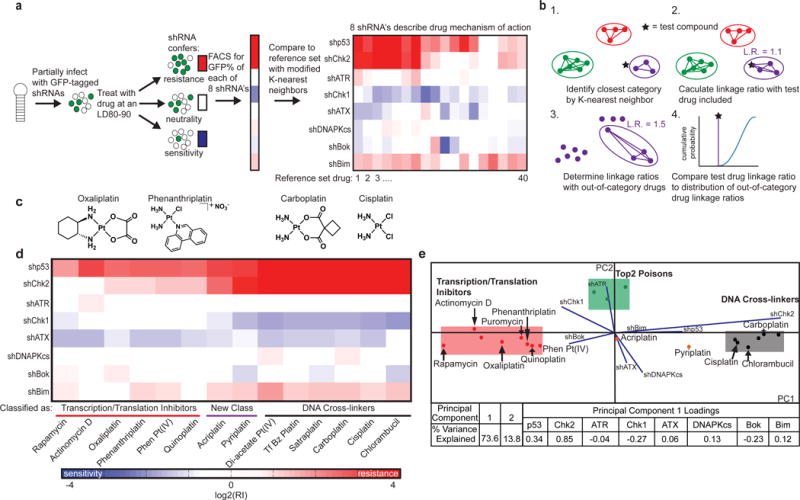
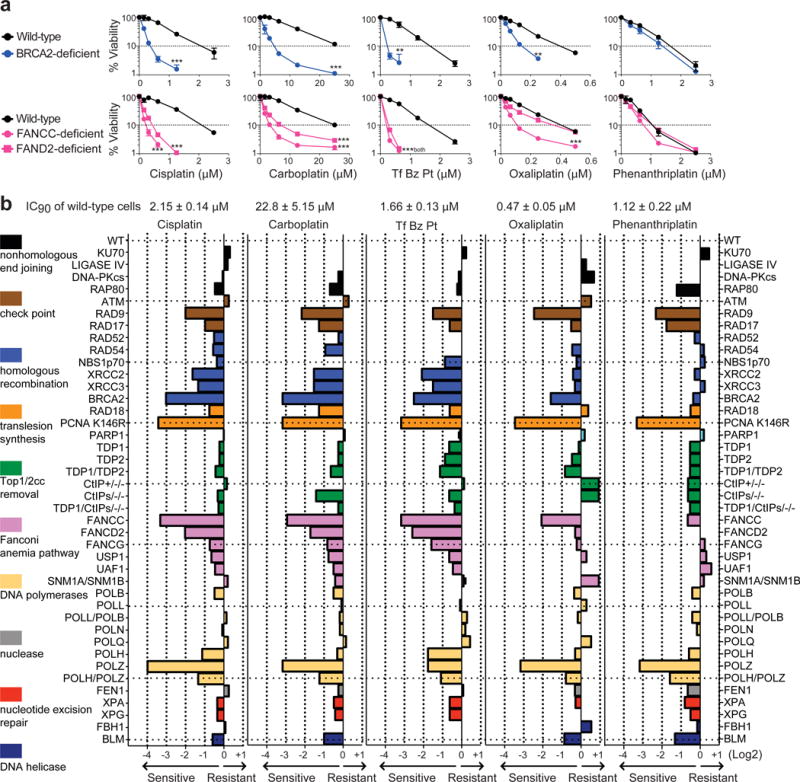
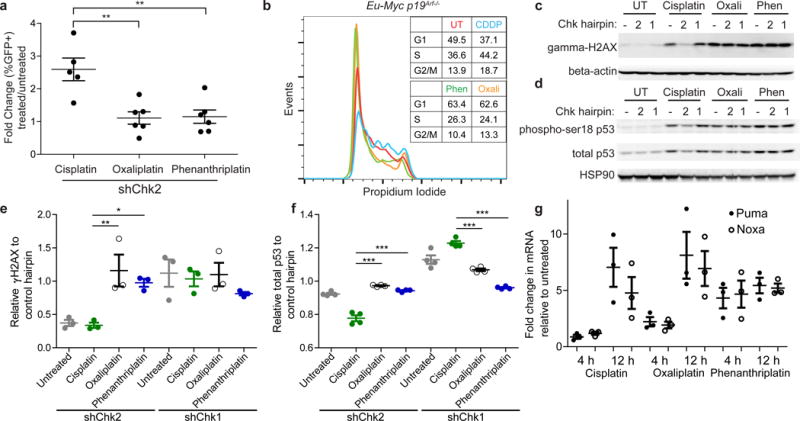
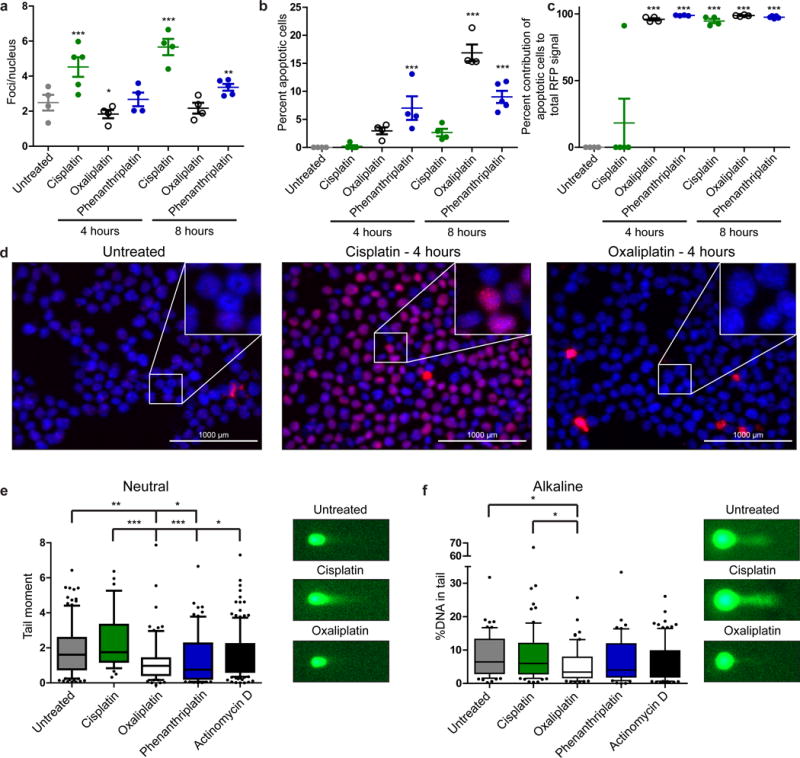
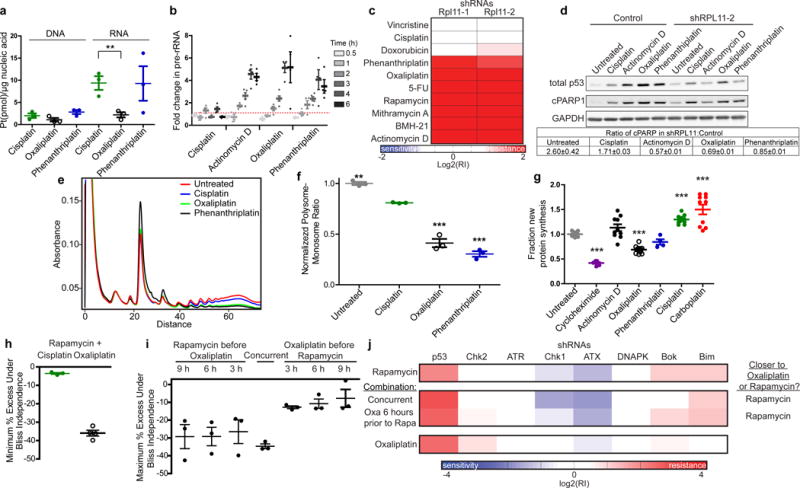
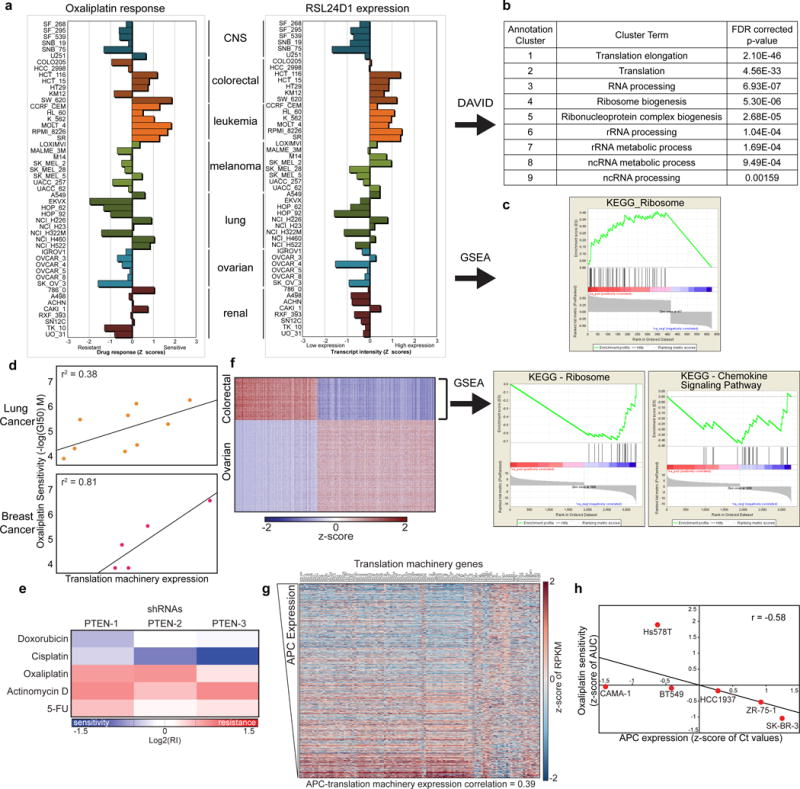
Cisplatin and its platinum analogs, carboplatin and oxaliplatin, are some of the most widely used cancer chemotherapeutics. Although cisplatin and carboplatin are used primarily in germ cell, breast and lung malignancies, oxaliplatin is instead used almost exclusively to treat colorectal and other gastrointestinal cancers. Here we utilize a unique, multi-platform genetic approach to study the mechanism of action of these clinically established platinum anti-cancer agents, as well as more recently developed cisplatin analogs. We show that oxaliplatin, unlike cisplatin and carboplatin, does not kill cells through the DNA-damage response. Rather, oxaliplatin kills cells by inducing ribosome biogenesis stress. This difference in drug mechanism explains the distinct clinical implementation of oxaliplatin relative to cisplatin, and it might enable mechanistically informed selection of distinct platinum drugs for distinct malignancies. These data highlight the functional diversity of core components of front-line cancer therapy and the potential benefits of applying a mechanism-based rationale to the use of our current arsenal of anti-cancer drugs.


Conflict of interest statement

Competing Financial Interests Statement

The authors declare no competing financial interests.

Figures

Figure 1
Figure 1
RNAi signatures identify a spectrum of platinum drug activities. (a) A schematic representation of our signature-based approach. Eμ-Myc p19Arf−/− lymphoma cells are partially infected with GFP-tagged shRNAs targeting the indicated eight genes. The individual pools of eight shRNA containing cells are treated with drug to achieve 80–90% killing at 48 h. Relative GFP% is measured at 72 h by flow cytometry and the subsequent shRNA signature is compared to our reference set using our modified K-nearest neighbors algorithm. (b) A schematic representation of our modified K-nearest neighbors algorithm. First, the test compound’s nearest reference set category is identified by Euclidian K-nearest neighbor’s analysis. Second, the linkage ratio (L.R.) is determined by dividing the pairwise distances of the category containing the new drug by the category without the new drug. Third, the linkage ratios are then calculated for all out-of-category drugs as if they were members of the category in question. This generates a background distribution of negative control linkage ratios. Fourth, the linkage ratio of the new drug is compared to the linkage ratio distribution of the negative controls to obtain a p-value. If p > 0.05 then drug is classified as belonging to a “new class” and having a mechanism of action not represented in the reference set. (c) On the right, cisplatin and carboplatin, two of the three clinically approved platinum agents classify as DNA cross-linkers. On the left, oxaliplatin, the third clinically approved platinum agent, and phenanthriplatin, a mono-functional platinum agent, both classify as transcription/translation inhibitors. (d) A heat map showing platinum compound signatures, with reference compounds rapamycin, actinomycin D and chlorambucil included. Rapamycin and actinomycin D represent transcription/translation inhibitors whereas chlorambucil represents DNA cross-linkers. The other agents are shown classified according to their respective labels. (e) Principal components analysis of the platinum compounds Top2 poisons, DNA cross-linkers and transcription/translation inhibitors. Tables show the percent variance explained by each principal component, as well as the principal component 1 loadings depicting the percent contribution of each of the eight shRNAs for the PCA shown above. Shaded boxes represent the approximate space the category occupies in the PCA and are only meant to aid visualization, not category classification.
Figure 2
Figure 2
Sensitivity profiles of the indicated platinum drugs on a panel of the repair-deficient DT40 mutants. (a) Viability curves of the indicated cell lines after continuous treatment for 72 h with the indicated drugs. Error bars represent the S.D. (n=3). p < 0.05 (*), p < 0.01 (**) or p < 0.001 (***) by unpaired two-tailed Student’s t-test on the highest doses only. (b) Relative sensitivity of all of the DT40 mutant cell lines. A negative score and a positive score indicates that the cells are sensitive and resistant to the drug, respectively. The score is log2 of the difference between IC90 (inhibitory concentration 90%) values. IC90 of wild-type cells are shown at the top of each panel (n=8–10). n = 3 for all others. The bars are colored according to the main DNA repair function of deficient gene(s). Black; nonhomologous end joining (NHEJ), brown; check point, blue; homologous recombination (HR), orange: translesion synthesis (TLS), aqua; PARP1, green; removal of topoisomerase I or topoisomerase II cleavage complex, pink; Fanconi anemia (FA) pathway, light orange; DNA polymerase, grey; nuclease, red; nucleotide excision repair (NER), dark blue; DNA helicase.
Figure 3
Figure 3
Phenanthriplatin and oxaliplatin exhibit distinct differences from cisplatin in cell cycle profiles, γ-H2AX and p53 signaling in Eμ-Myc p19arf−/− cells. (a) Results of an in vivo GFP competition assay. Fold change in GFP% was assessed relative to untreated mice after tumor cell harvesting. p < 0.01 (**) by a two-tailed Mann-Whitney test. Mean ± SEM is depicted. n = 5 for all conditions. (b) Cell cycle profiles of resulting from 12 h treatment by cisplatin, phenanthriplatin or oxaliplatin. UT: Untreated, CDDP: cisplatin, Phen: phenanthriplatin, Oxali: oxaliplatin (c) Western blot for γ-H2AX after cisplatin, oxaliplatin or phenanthriplatin treatment with or without shChk2 or shChk1 at 12 h. (d) Western blot for phospho-ser18 and total p53 after cisplatin, oxaliplatin or phenanthriplatin treatment with or without shChk2 or shChk1 at 12 h. (e) Densitometry quantification of Fig. 3c. Data are mean ± SEM via three independent quantification results. p < 0.05 (*), p < 0.01 (**) for each group relative to cisplatin shChk2 or shChk1 by one-way ANOVA with Dunnett’s Multiple Comparison Test. (f) Densitometry quantification of Fig. 3d. Data are mean ± SEM via four independent quantification results. p < 0.001 (***) for each group relative to cisplatin shChk2 or shChk1 by one-way ANOVA with Dunnett’s Multiple Comparison Test. (g) Results of qPCR analysis conducted for Puma and Noxa after 4 and 12 h of cisplatin, phenanthriplatin or oxaliplatin treatment. Data are represented as mean ± SEM. n = 3 from independent experiments from independent cultures of cells.
Figure 4
Figure 4
Immunofluorescence of γ-H2AX and comet assays reveal lack of DNA damage resulting from oxaliplatin and phenanthriplatin treatment in Eμ-Myc p19arf−/− cells. (a) Foci per nucleus for each condition at both 4 h and 8 h after treatment. Data are represented as mean ± SEM for each field. p < 0.05 (*), p < 0.01 (**) or p < 0.001 (***) for each group relative to untreated by one-way ANOVA with Dunnett’s Multiple Comparison Test. (b) Apoptotic cells identified via pan-nuclear γ-H2AX as a percent of total nuclei. Data are represented as mean ± SEM for each field. p < 0.0005 (***) for each group relative to untreated by one-way ANOVA with Dunnett’s Multiple Comparison Test. (c) The sum of the integrated intensity of pan-nuclear γ-H2AX divided by the total RFP signal for each field. Data are represented as mean ± SEM for each field. p < 0.0005 (***) for each group relative to untreated by one-way ANOVA with Dunnett’s Multiple Comparison Test. For a-c, 4 fields were analyzed for each condition except 4 h cisplatin and 8 h phenanthriplatin which had 5 each. (d) Representative images of γ-H2AX immunofluorescence staining. Insets are 2.5× magnified. (e) Quantification of tail moment after performing a neutral comet assay 6 h after indicated drug treatment. Box center line represents the mean and box limits are quartiles 1 and 3, and whiskers show 10th and 90th percentile. On the right, representative images from each untreated, cisplatin and oxaliplatin treated cells. p < 0.05 (*), p < 0.01 (**) or p < 0.001 (***) for each group relative to untreated or cisplatin by one-way ANOVA with Dunnett’s Multiple Comparison Test. Number of comets analyzed for untreated, cisplatin, oxaliplatin, phenanthriplatin and actinomycin D were 117, 37, 77, 76 and 143, respectively. (f) Quantification of percent DNA in tail after performing a neutral comet assay 6 h after indicated drug treatment. Box center line represents the mean and box limits are quartiles 1 and 3, and whiskers show 10th and 90th percentile. On right, representative images from each untreated, cisplatin and oxaliplatin treated cells. p < 0.05 (*) for each group relative to untreated or cisplatin by one-way ANOVA with Dunnett’s Multiple Comparison Test. Number of comets analyzed for untreated, cisplatin, oxaliplatin, phenanthriplatin and actinomycin D were 67, 77, 64, 50 and 91, respectively.
Figure 5
Figure 5
Oxaliplatin and phenanthriplatin induce ribosome biogenesis stress. (a) Platinum per μg of nucleic acid as determined by atomic absorption spectroscopy as a result of 3 h of treatment of Eu-Myc p19Arf−/− lymphoma cells with cisplatin, oxaliplatin or phenanthriplatin at a concentration required to achieve LD80–90 at 48 h. Data are represented as mean ± SEM from three independent doses and cultures. p < 0.005 (**) by a two-tailed Student’s t-test. (b) Percent of pre-ribosomal RNA at various time points after treatment of Eu-Myc p19Arf−/− lymphoma cells as determined by qPCR and normalized to GAPDH. Dashed red line indicates no change. Data are represented as mean ± SEM from four independent doses and cultures except 3 h which had five. (c) A heatmap depicting enrichment or depletion of two validated hairpins against RPL11 as a result of drug treatment in of Eu-Myc p19Arf−/− lymphoma cells. (d) Above: western blot for total p53, cleaved PARP (cPARP) and GAPDH 12 h after treatment with or without a hairpin against RPL11 in of Eu-Myc p19Arf−/− lymphoma cells. Below: densitometry quantification of cPARP. Shown is the ratio of cPARP in the shRPL11-2 condition relative to control for each treatment. Data are represented as mean ± SEM from three independent densitometry quantification results. (e) Representative polysome gradient after 6 h of treatment with the indicated agents Eμ-Myc p19arf−/− cells. (f) The ratio of polysomes to monosomes normalized to the untreated condition derived from the quantification of the area under the curve of monosome and polysome fractions. Data are represented as mean ± SEM from three technical dosing replicates. p < 0.01 (**) or p < 0.001 (***) for each group relative to cisplatin by one-way ANOVA with Dunnett’s Multiple Comparison Test. (g) Fraction of newly synthesized protein relative to the untreated condition for Eu-Myc p19Arf−/− lymphoma cells at 9 h as measured by O-propargyl puromycin incorporation. Data are represented as mean ± SEM. p < 0001 (***) for each group relative to untreated by one-way ANOVA with Dunnett’s Multiple Comparison Test. All conditions were conducted with two independent doses on independent cultures. Number of fields analyzed was 11 for untreated, 10 for actinomycin D, oxaliplatin, cisplatin and carboplatin, 7 for cycloheximide and 4 for phenanthriplatin. (h) Minimum percent excess PI negative of Eu-Myc p19Arf−/− lymphoma cells under Bliss Independence, a control model of additivity, for the combination of rapamycin with either cisplatin or oxaliplatin. Data are represented as mean ± SEM from three independent doses on independent cultures. (i) Minimum percent excess PI negative cells under Bliss Independence, for the combination of rapamycin and oxaliplatin for which co-dosing was staggered as shown. Data are represented as mean ± SEM from three independent doses on independent cultures. (j) RNAi signatures for rapamycin or oxaliplatin, or the combination of the two dosed simultaneously or oxaliplatin 6 h prior to rapamycin. Both combination signatures were more similar to rapamycin than oxaliplatin.
Figure 6
Figure 6
Evidence for sensitization to oxaliplatin in “translation addicted” cell lines and primary tumors. (a) Graphs of z-scores depicting relative resistance or sensitivity to oxaliplatin for various cell lines (left) or relative abundance of RSL24D1 transcript levels (right). (b) Gene ontology terms identified by DAVID as being significantly enriched among the 417 genes whose expression significantly correlated to oxaliplatin sensitivity. (c) The sole KEGG pathway identified by GSEA as being significantly enriched among the 417 genes whose expression significantly correlated to oxaliplatin sensitivity. (d) The correlation of the translation machinery metagene, an average of ~120 translation related gene transcripts, to oxaliplatin sensitivity from the NCI-60 for lung and breast cancer cell lines. (e) A heatmap depicting enrichment or depletion of three validated hairpins targeting PTEN as a result of drug treatment of Eu-Myc p19Arf−/− lymphoma cells. (f) Left, a heatmap representing the relative expression of levels of all genes that are differentially expressed in ovarian cancer relative to colorectal cancer by an absolute fold change of at least log2(2.5). Right, the two non-digestion/metabolism related KEGG pathways identified by GSEA as being significantly enriched among the genes whose expression was greater in colorectal cancer relative to ovarian cancer. (g) A heatmap of expression of translation machinery genes from the breast cancer TCGA dataset ranked by APC expression. (h) Breast cancer cell line sensitivity to oxaliplatin correlates to APC expression. Each dot is labeled according to the name of the cell line and represents the mean of three independent replicates of both the dosing and qPCR from the same culture.

Similar articles

Cited by

References

    1. Kelland L. The resurgence of platinum-based cancer chemotherapy. Nat Rev Cancer. 2007;7:573–584. - PubMed
    1. DeVita VT, Chu E, Chu Edward, DeVita VT., Jr . Cancer research. Vol. 68. Jones & Bartlett Learning Oncology; 2008. Physician’s Cancer Chemotherapy Drug Manual.
    1. Rixe O, et al. Oxaliplatin, tetraplatin, cisplatin, and carboplatin: spectrum of activity in drug-resistant cell lines and in the cell lines of the National Cancer Institute’s Anticancer Drug Screen panel. Biochem Pharmacol. 1996;52:1855–65. - PubMed
    1. Machover D, et al. Two consecutive phase II studies of oxaliplatin (L-OHP) for treatment of patients with advanced colorectal carcinoma who were resistant to previous treatment with fluoropyrimidines. Ann Oncol Off J Eur Soc Med Oncol. 1996;7:95–8. - PubMed
    1. Jiang H, Pritchard JR, Williams RT, Lauffenburger DA, Hemann MT. A mammalian functional-genetic approach to characterizing cancer therapeutics. Nat Chem Biol. 2011;7:92–100. - PMC - PubMed

MeSH terms