. 2017 Apr;24(4):353-361.
doi: 10.1038/nsmb.3387. Epub 2017 Mar 6.

Genome-wide mapping of long-range contacts unveils clustering of DNA double-strand breaks at damaged active genes

Affiliations

Genome-wide mapping of long-range contacts unveils clustering of DNA double-strand breaks at damaged active genes

François Aymard et al. Nat Struct Mol Biol. 2017 Apr.

Abstract

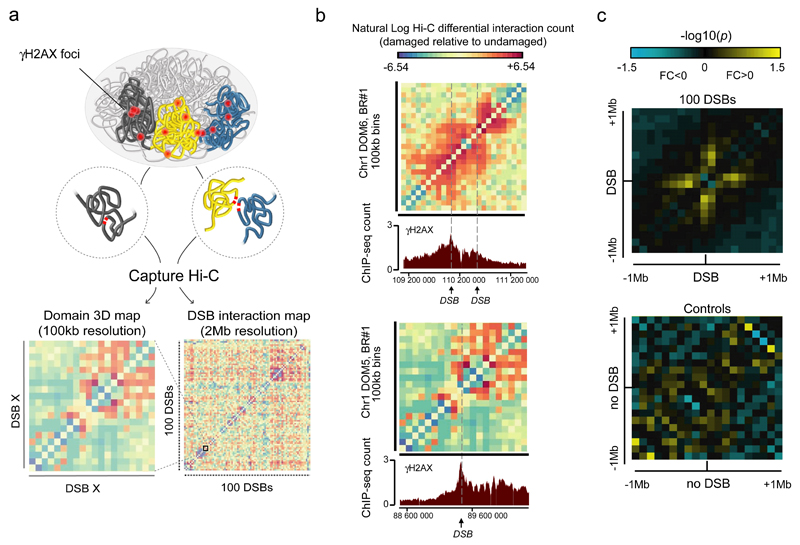
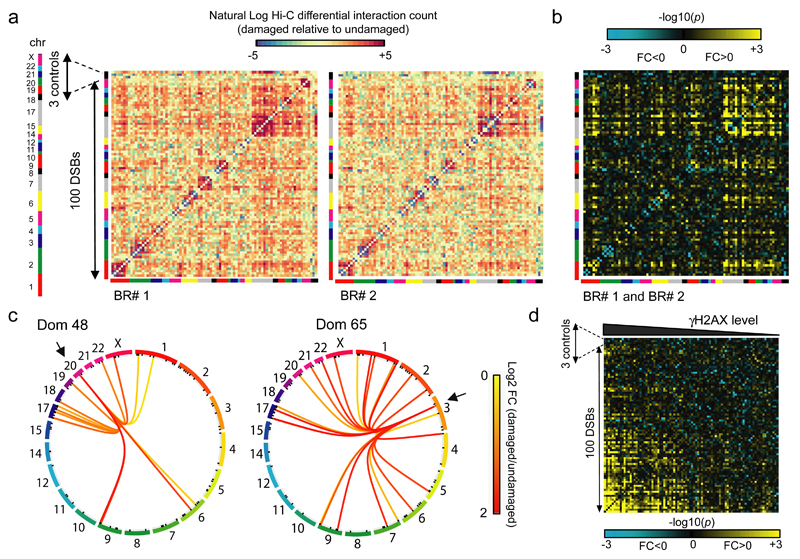
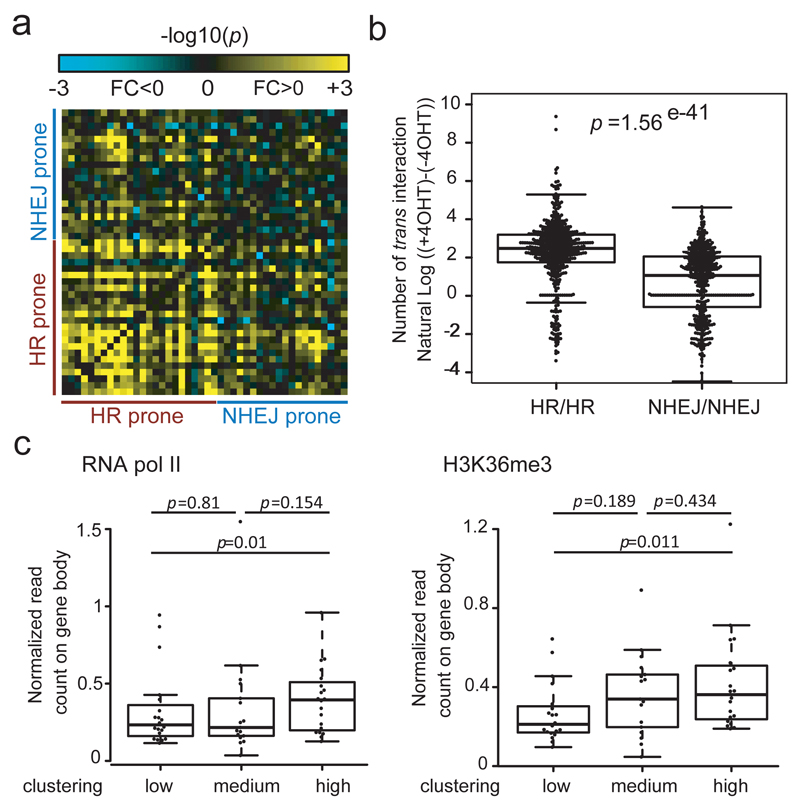
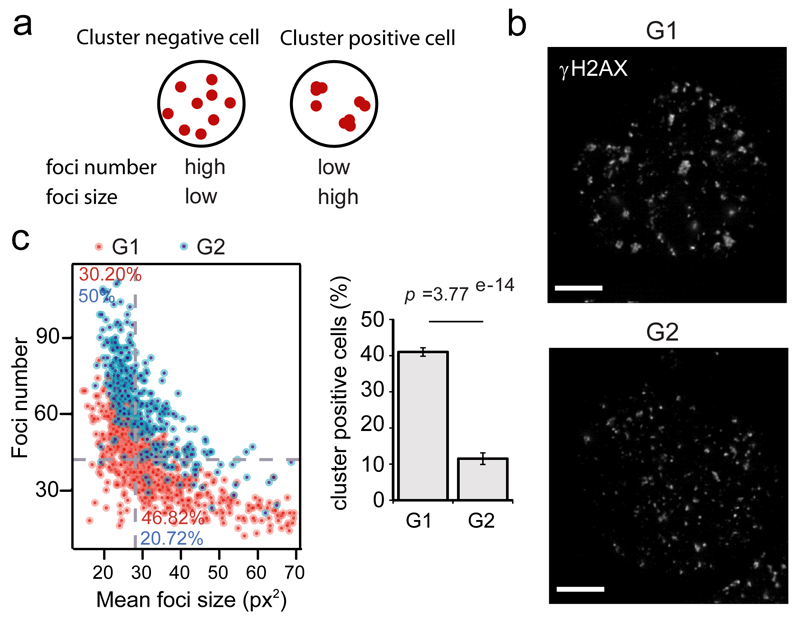
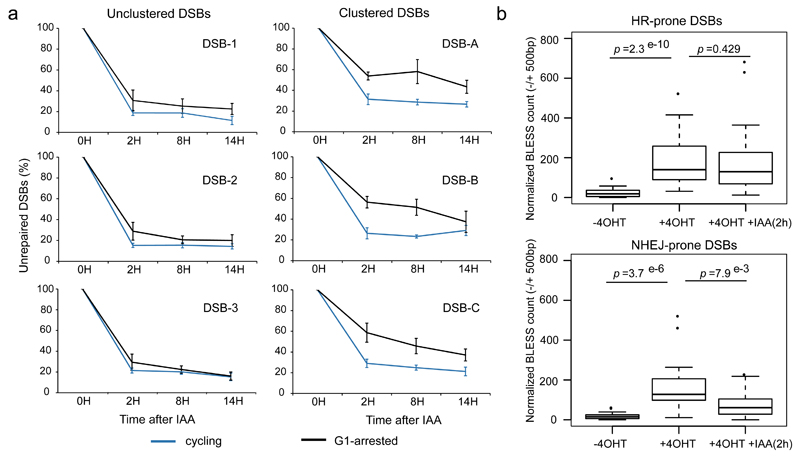
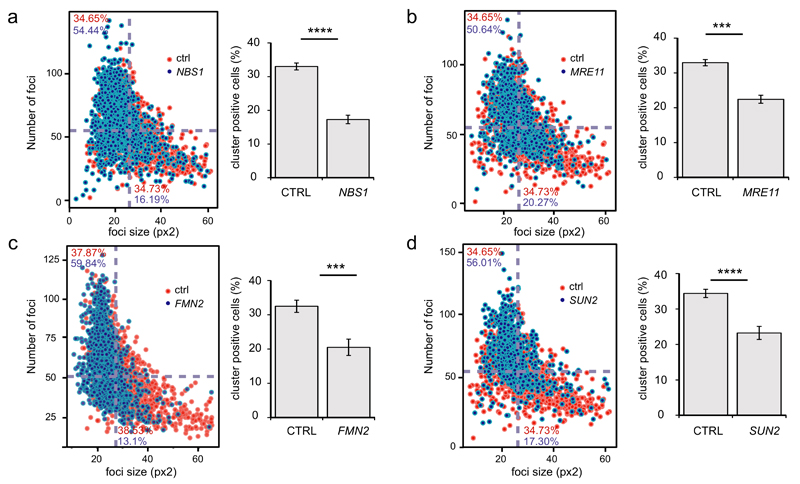
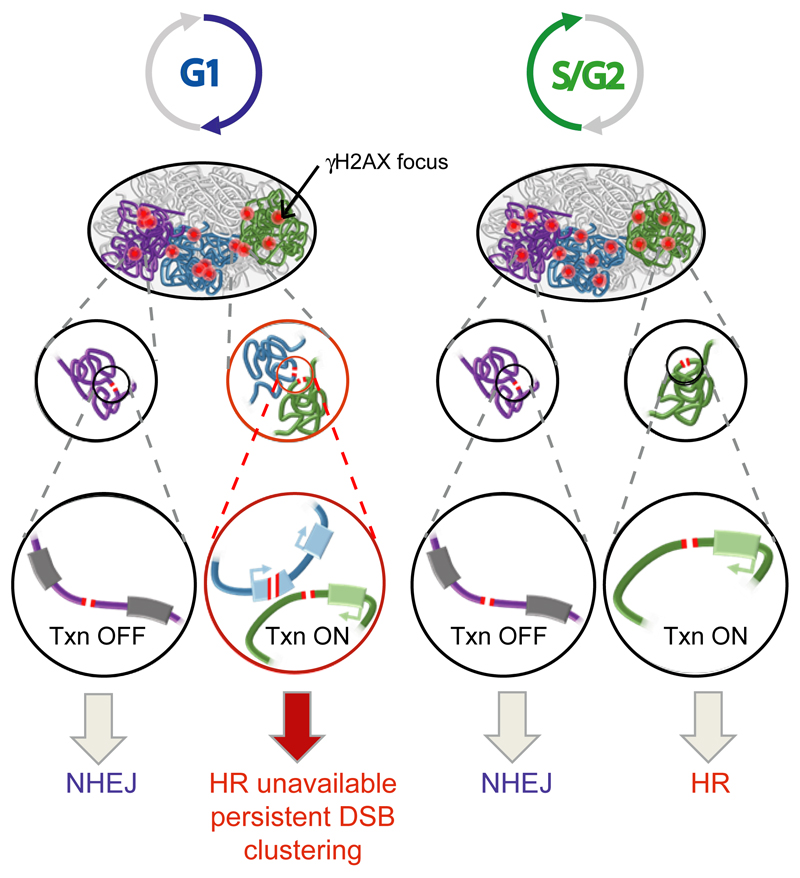
The ability of DNA double-strand breaks (DSBs) to cluster in mammalian cells has been a subject of intense debate in recent years. Here we used a high-throughput chromosome conformation capture assay (capture Hi-C) to investigate clustering of DSBs induced at defined loci in the human genome. The results unambiguously demonstrated that DSBs cluster, but only when they are induced within transcriptionally active genes. Clustering of damaged genes occurs primarily during the G1 cell-cycle phase and coincides with delayed repair. Moreover, DSB clustering depends on the MRN complex as well as the Formin 2 (FMN2) nuclear actin organizer and the linker of nuclear and cytoplasmic skeleton (LINC) complex, thus suggesting that active mechanisms promote clustering. This work reveals that, when damaged, active genes, compared with the rest of the genome, exhibit a distinctive behavior, remaining largely unrepaired and clustered in G1, and being repaired via homologous recombination in postreplicative cells.


Conflict of interest statement

Competing Financial Interests Statement

The authors declare no competing financial interests.

Figures

Figure 1
Figure 1. Capture Hi-C reveals DSB-induced local changes in chromosome folding.
a. General experimental pipeline: DSBs are introduced at known positions throughout the human genome following 4-hydroxytamoxifen (4-OHT) addition. Capture Hi-C experiments are next conducted both before and after DSB induction in order to identify whether and which DSBs interact within the nucleus following damage (Supplementary Note). 100kb resolution contact maps help to determine changes in cis interaction within γH2AX domains, while 2 megabase (2Mb) resolution interaction maps, allow to identify domains able to interact (i.e. cluster) following damage. b. The differential (damaged versus undamaged), 100kb resolution, interaction map is shown for two domains captured on the chromosome 1. Data are expressed as natural log of differential interaction count (normalized, see Online Methods). Arrows indicate DSBs positions. γH2AX profile obtained by ChIP-seq at the same chromosomal locations following damage are shown (bottom panel). c. Averaged interaction heatmap between damaged versus undamaged cells at 100kb resolution within 2Mb captured domains, around the 100 DSBs (top panel) or around the 3 control domains devoid of DSB (bottom panel). Both biological replicates are taken into account. -log10(p) are indicated, negative fold changes (damaged<undamaged) in blue, positive fold change (damaged>undamaged) in yellow.
Figure 2
Figure 2. Clustering can occur between DSBs induced on different chromosomes and correlates with γH2AX.
a. Differential heatmaps (damaged versus undamaged) between each of the 2Mb domain captured on the human genome, for both biological replicates. Data are expressed as natural log of differential count. DSBs are ordered according to their positions on the genome and chromosomes are indicated by colors bars. The 3 control regions (devoid in DSB) are positioned at the end (black line). Each square represents a 2Mb domain captured, surrounding a DSB. b. The number of interactions between each domain were measured and p values between damaged and undamaged samples were computed based on both replicates (Online Methods). –log10(p) are indicated, with negative fold changes (FC<0, damaged<undamaged) in blue, and positive fold change (FC>0, damaged>undamaged) in yellow. DSB are ordered according to their positions on the genome and chromosomes are indicated by colors bars. The 3 control regions (devoid in DSB) are positioned at the end as indicated. c. Circos plots showing the statistically significant (p<0.05) interactions induced after 4OHT treatment for two selected DSB-containing captured domains. Connecting lines are colored according to the log2 fold change between damaged and undamaged cells. p-values were computed from damaged and undamaged samples using biological replicates (Online Methods). d. Interaction heatmap between damaged versus undamaged cells at a 2Mb domain resolution, based on both biological replicates (Online Methods). -log10(p) are indicated, with negative fold changes (damaged<undamaged) in blue, positive fold change (damaged>undamaged) in yellow. DSBs are sorted based on their level of γH2AX analyzed by ChIP-seq. Controls have been placed on the right side of the matrix as indicated.
Figure 3
Figure 3. DSBs induced in transcriptionally active genes and repaired by homologous recombination in post-replicative cells undergo clustering.
a. Interaction heatmap between damaged versus undamaged cells at a 2Mb domain resolution for DSBs defined as HR-prone or NHEJ-prone (21, Online Methods). -log10(p) are indicated, with negative fold changes (damaged<undamaged) in blue, positive fold change (damaged>undamaged) in yellow. b. Box-plot showing the distribution of DSB-induced interactions between each HR-prone DSB with any other HR- prone DSB (HR/HR) or each NHEJ-prone DSB with any other NHEJ-prone DSB (NHEJ/NHEJ). The difference between the two classes is highly significant (Wilcoxon Mann-Whitney test). Center line: median; Box limits: 1st and 3rd quartiles; Whiskers: Maximum and minimum without outliers; Points: outliers (Online Methods). c. DSBs were classified based on their ability to cluster (high, medium, low). RNA polymerase II occupancy (left panel) and H3K36me3 enrichment (right panel) analyzed in DIvA cells by ChIP-Seq (21, Online Methods) were averaged over the closest genes. Highly clustered DSBs also exhibited the highest RNA PolII and H3K36me3 levels (Wilcoxon Mann-Whitney test). Center line: median; Box limits: 1st and 3rd quartiles; Whiskers: Maximum and minimum without outliers; Points: outliers.
Figure 4
Figure 4. DSB clustering is favored during the G1 cell cycle phase.
a. AsiSI induces a known number of DSBs in a homogeneous fashion in the cell population. Measure of γH2AX foci number and foci size in each nuclei can thus be used to infer clustering. Low clustering ability leads to more foci of smaller size (left, “cluster negative” cells) while high clustering ability leads to fewer and bigger foci (right, “cluster positive” cells). b. G1 and G2 DIvA nuclei, synchronized by a double thymidine block followed by a release (respectively 15h and 8h), stained for γH2AX, following damage induction. Scale bar: 5µM. c. DIvA cells were treated with 4OHT (4h) and subjected to high throughput microscopy following γH2AX staining. Left panel: Scatterplot obtained for a representative experiment, showing the number of γH2AX foci (y axis) and the average foci size (x axis) for each cells in G1 or in G2 (based on Hoechst staining, Fig. S5a). The plot is divided in four area based on the medians of foci number and foci size (dotted grey lines). Percent of cells from G1 population (in red) or G2 population (in blue) that are “cluster positive” (bottom right) or “cluster negative” (top left) are indicated. Right panel: Quantification showing the percent of “cluster positive” cells in G1 and in G2, analyzed from independent experiments. Mean, s.e.m and p value (paired t test) are shown (n=14, independent experiments).
Figure 5
Figure 5. Clustered, HR-prone, DSBs exhibit delayed repair in G1.
a. Following DSB induction by 4OHT, repair kinetics was measured after auxin (IAA) addition (that triggers AsiSI degradation and subsequent DSB repair), at 3 unclustered (left panels) or 3 clustered (right panels) DSBs either in cycling cells (blue), or G1 arrested cells (following a lovastatin treatment, black). Briefly, repair kinetics was assessed by collecting cells at different time points after auxin addition and performing a ligation and purification mediated quantitative PCR (described in,, see Fig. S5c). DSB level before auxin addition (time point 0h) is set to 100%. b. BLESS was performed in untreated, 4OHT treated (4h) and 4OHT+IAA (2h) treated DIvA cells (Fig. S6), synchronized in G1. BLESS reads count (normalized) is shown on a -/+ 500bp window surrounding DSBs HR-prone (top panel) or NHEJ-prone (bottom panel) for each condition as indicated. p values are indicated (Wilcoxon Mann-Whitney test). Center line: median; Box limits: 1st and 3rd quartiles; Whiskers: Maximum and minimum without outliers; Points: outliers.
Figure 6
Figure 6. DSB clustering depends on the MRN complex as well as on the LINC complex and the FMN2 actin organizer.
a. DIvA cells were transfected with control siRNA (in red) or a siRNA against NBS1 (in blue), treated with 4OHT (4h) and subjected to high throughput microscopy following γH2AX staining. Left panel: Average foci size (x axis) and number of foci (y axis) were determined in each cells and plotted against each other as in Fig. 4c. Right panel shows the quantification (mean and s.e.m) of cluster positive cells obtained from independent experiments (n=5). (**** p<0.001, paired t test). b. Same as in a, except that a siRNA against MRE11 was used (n=3) (*** p<0.005, paired t test). c. Same as in a, except that a siRNA against FMN2 was used (n=7) (*** p<0.005, paired t test). d. Same as in a, except that a siRNA against SUN2 was used (n=6) (**** p<0.001, paired t test).
Figure 7
Figure 7. Model for DSB clustering
While DSBs in intergenic regions and inactive genes are mostly repaired by NHEJ throughout the cell cycle, the repair of DSB induced in active genes is dependent on the cell cycle phase. In post-replicative cells, DSBs in transcribed regions are prone to HR repair, whereas in G1, those breaks persist longer and coalesce with each other, forming clusters of unrepaired active genes.

Similar articles

Cited by

References

    1. Dion V, Kalck V, Horigome C, Towbin BD, Gasser SM. Increased mobility of double-strand breaks requires Mec1, Rad9 and the homologous recombination machinery. Nature cell biology. 2012;14:502–509. doi: 10.1038/ncb2465. - DOI - PubMed
    1. Mine-Hattab J, Rothstein R. Increased chromosome mobility facilitates homology search during recombination. Nature cell biology. 2012;14:510–517. doi: 10.1038/ncb2472. - DOI - PubMed
    1. Neumann FR, et al. Targeted INO80 enhances subnuclear chromatin movement and ectopic homologous recombination. Genes & development. 2012;26:369–383. doi: 10.1101/gad.176156.111. - DOI - PMC - PubMed
    1. Lisby M, Mortensen UH, Rothstein R. Colocalization of multiple DNA double-strand breaks at a single Rad52 repair centre. Nature cell biology. 2003;5:572–577. doi: 10.1038/ncb997. - DOI - PubMed
    1. Aten JA, et al. Dynamics of DNA double-strand breaks revealed by clustering of damaged chromosome domains. Science. 2004;303:92–95. doi: 10.1126/science.1088845. - DOI - PubMed

MeSH terms

LinkOut - more resources