

Hospital Variation in Rates of New Institutionalizations Within 6 Months of Discharge
- PMID: 28263369
- PMCID: PMC5478433
- DOI: 10.1111/jgs.14760
Hospital Variation in Rates of New Institutionalizations Within 6 Months of Discharge
Abstract
Objectives: Hospitalization in community-dwelling elderly is often accompanied by functional loss, increasing the risk for continued functional decline and future institutionalization. The primary objective of our study was to examine the hospital-level variation in rates of new institutionalizations among Medicare beneficiaries.
Design: Retrospective cohort study.
Setting: Hospitals and nursing homes.
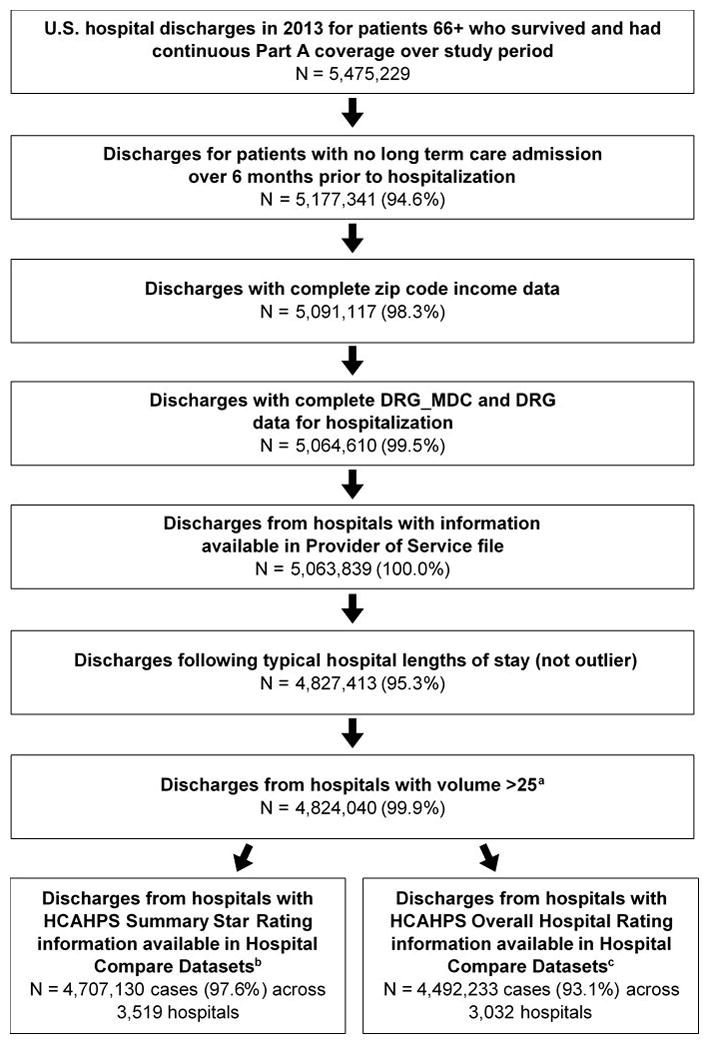
Participants: Medicare fee-for-service beneficiaries discharged from 4,469 hospitals in 2013 (N = 4,824,040).
Measurements: New institutionalization, defined as new long term care nursing home residence (not skilled nursing facility) of at least 90 days duration within 6 months of hospital discharge.
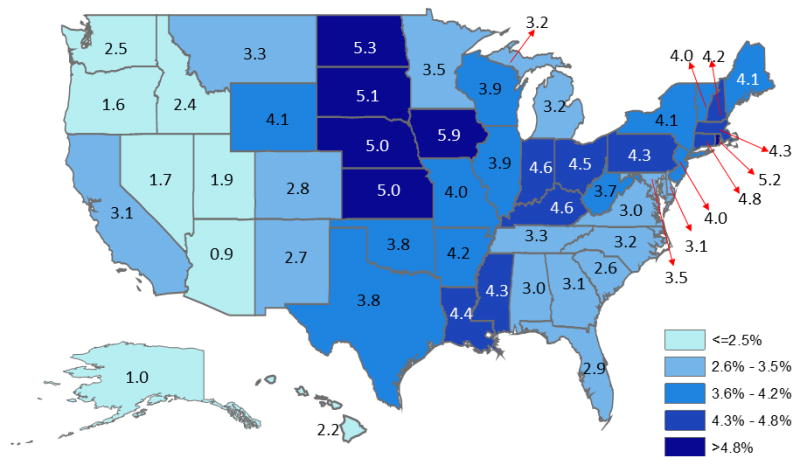
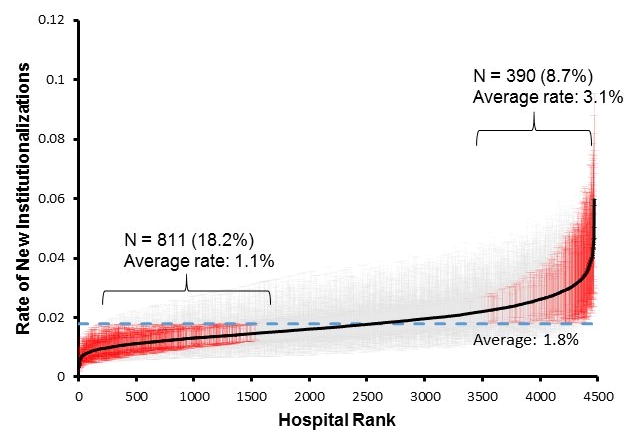
Results: The overall observed rate of new institutionalizations was 3.6% (N = 173,998). Older age, white race, Medicaid eligibility, longer hospitalization, and having a skilled nursing facility stay over the 6 months before hospitalization were associated with higher adjusted odds. Observed rates ranged from 0.9% to 5.9% across states. The variation in rates attributable to the hospital after adjusting for case-mix and state was 5.1%. Odds were higher for patients treated in smaller (OR = 1.36, 95% CI: 1.27-1.45, ≤50 vs >500 beds), government owned (OR = 1.15, 95% CI: 1.09-1.21 compared to for-profit), limited medical school affiliation (OR = 1.13, 95% CI: 1.07-1.19 compared to major) hospitals and lower for patients treated in urban hospitals (OR = 0.79, 95% CI: 0.76-0.82 compared to rural). Higher Summary Star ratings (OR = 0.75, 95% CI: 0.67-0.93, five vs one stars) and Overall Hospital Rating (OR = 0.62, 95% CI: 0.57-0.67, ratings of 9-10 vs 0) were associated with lower odds of institutionalization.
Conclusion: Hospitalization may be a critical period for preventing future institutionalization among elderly patients. The variation in rates across hospitals and its association with hospital quality ratings suggest some of these institutionalizations are avoidable and may represent targets for care improvement.
Keywords: elderly; functional status; hospital ratings; nursing home; quality of care.
© 2017, Copyright the Authors Journal compilation © 2017, The American Geriatrics Society.
Figures
References
-
- Covinsky KE, Palmer RM, Fortinsky RH, et al. Loss of independence in activities of daily living in older adults hospitalized with medical illnesses: increased vulnerability with age. J Am Geriatr Soc. 2003;51:451–8. - PubMed
-
- Gill TM, Allore HG, Holford TR, et al. Hospitalization, restricted activity, and the development of disability among older persons. JAMA. 2004;292:2115–24. - PubMed
-
- Sourdet S, Lafont C, Rolland Y, et al. Preventable Iatrogenic Disability in Elderly Patients During Hospitalization. J Am Med Dir Assoc. 2015;16:674–81. - PubMed
-
- Brown CJ, Redden DT, Flood KL, et al. The underrecognized epidemic of low mobility during hospitalization of older adults. J Am Geriatr Soc. 2009;57:1660–5. - PubMed
MeSH terms
Grants and funding
LinkOut - more resources
Full Text Sources
Other Literature Sources
Medical
