

Molecular architecture of an N-formyltransferase from Salmonella enterica O60
- PMID: 28263875
- PMCID: PMC5581740
- DOI: 10.1016/j.jsb.2017.03.002
Molecular architecture of an N-formyltransferase from Salmonella enterica O60
Abstract
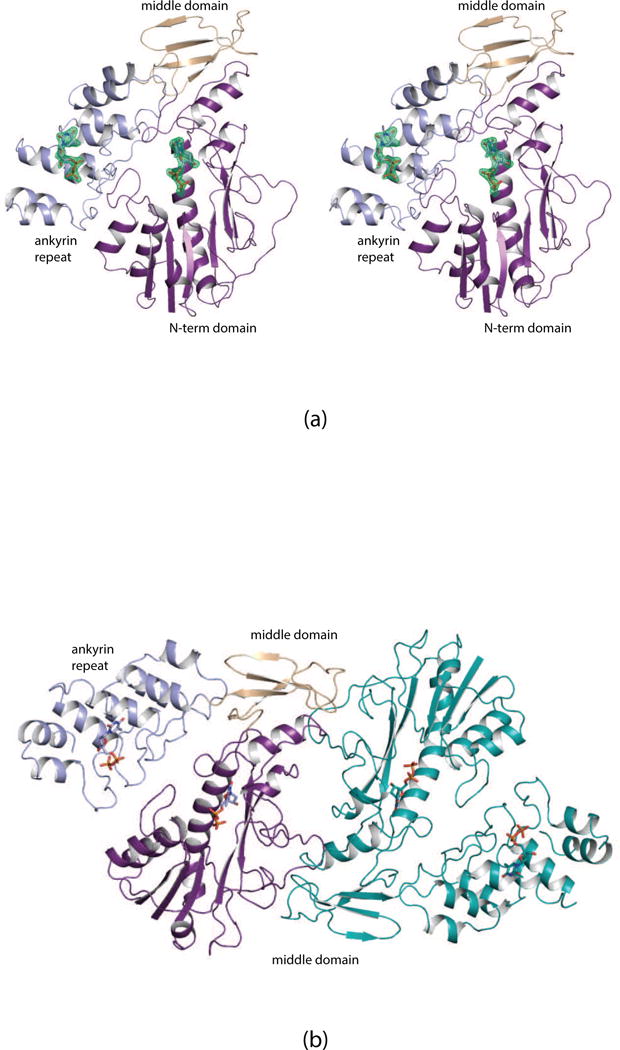
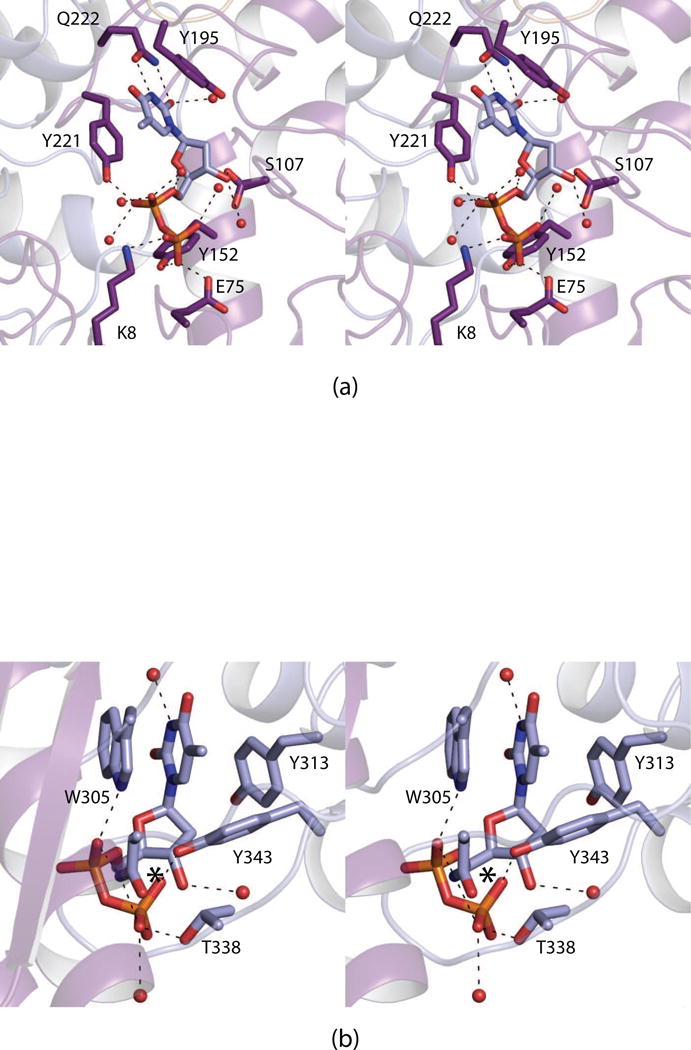
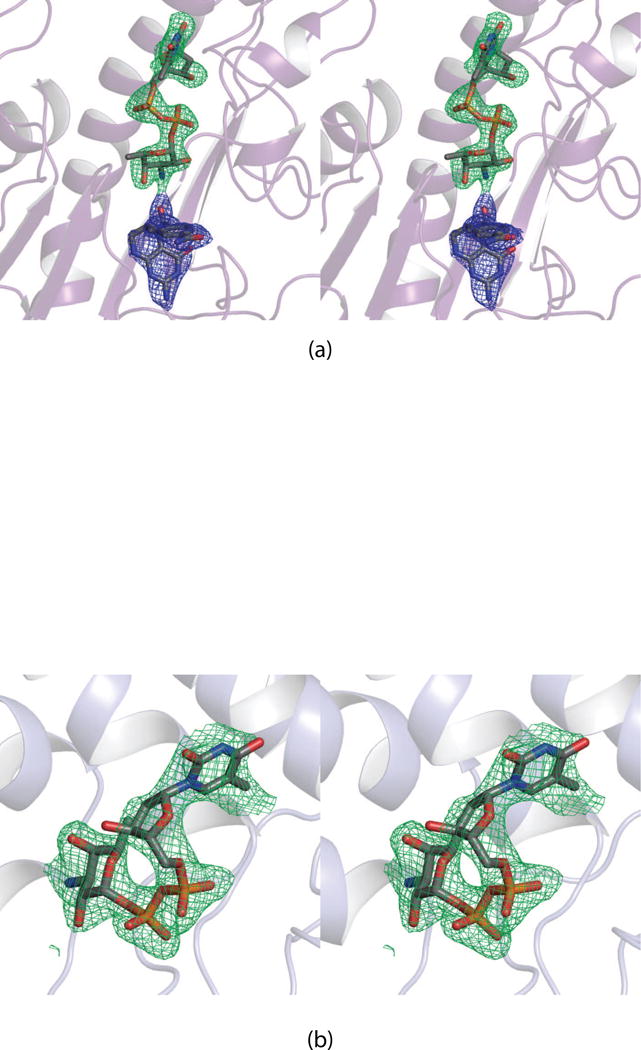
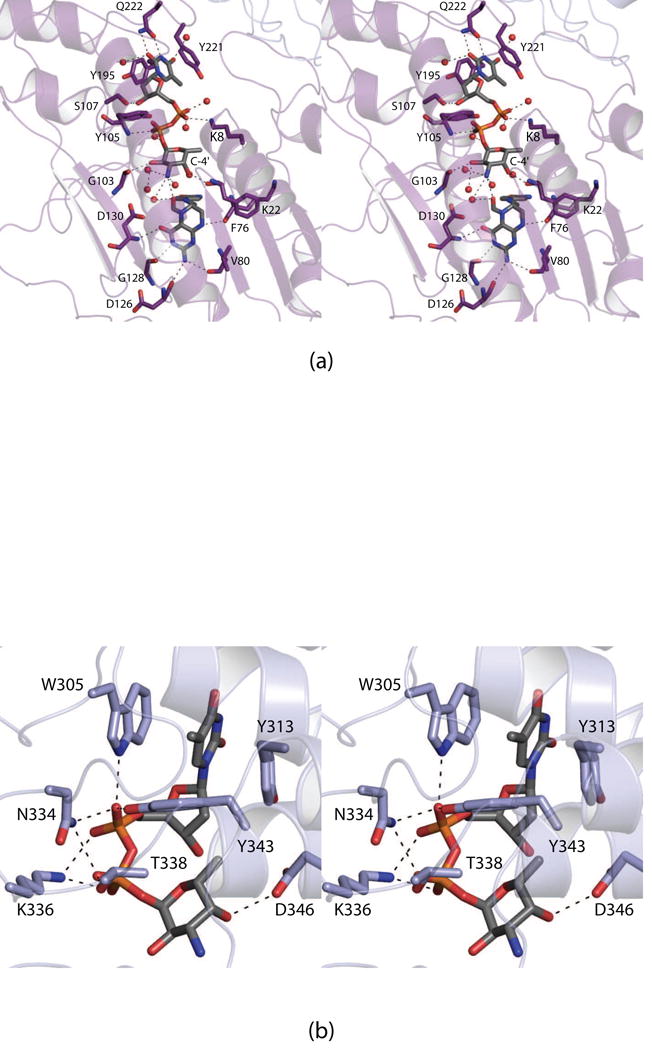
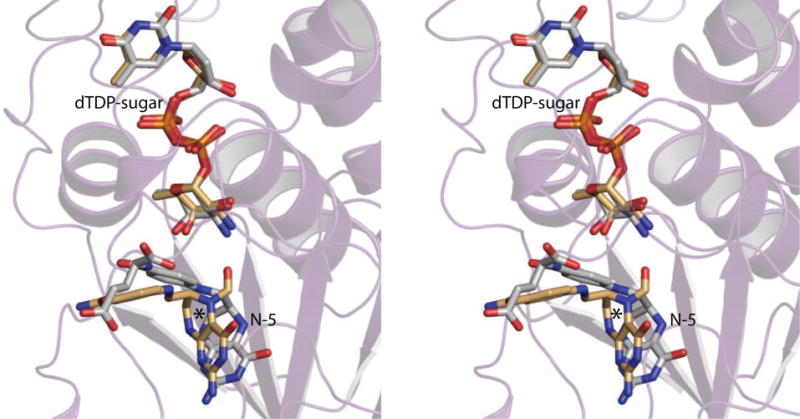
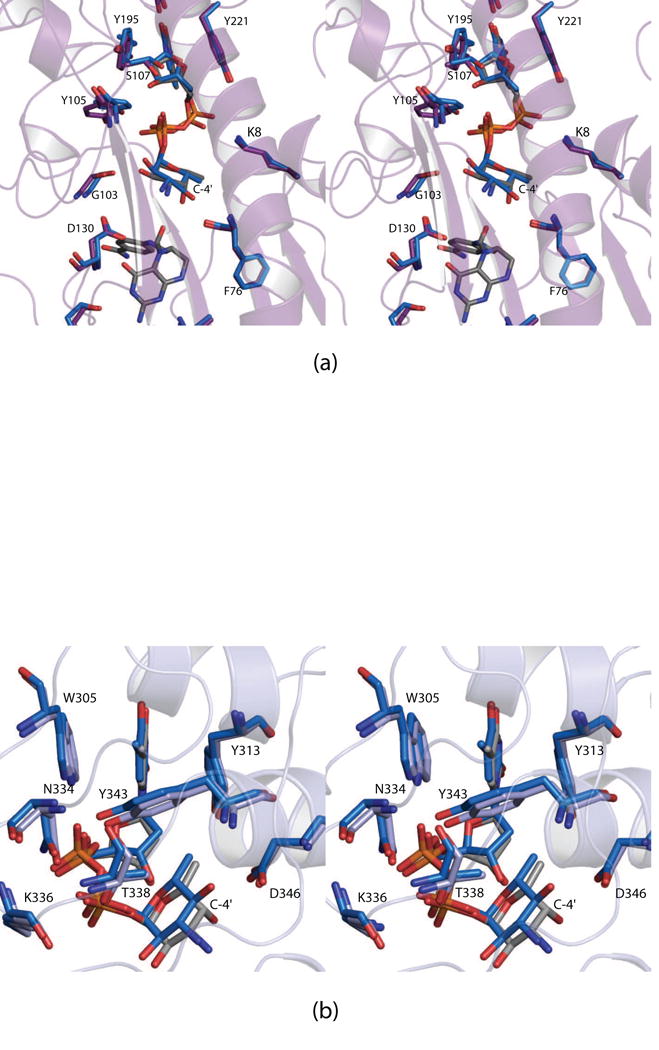
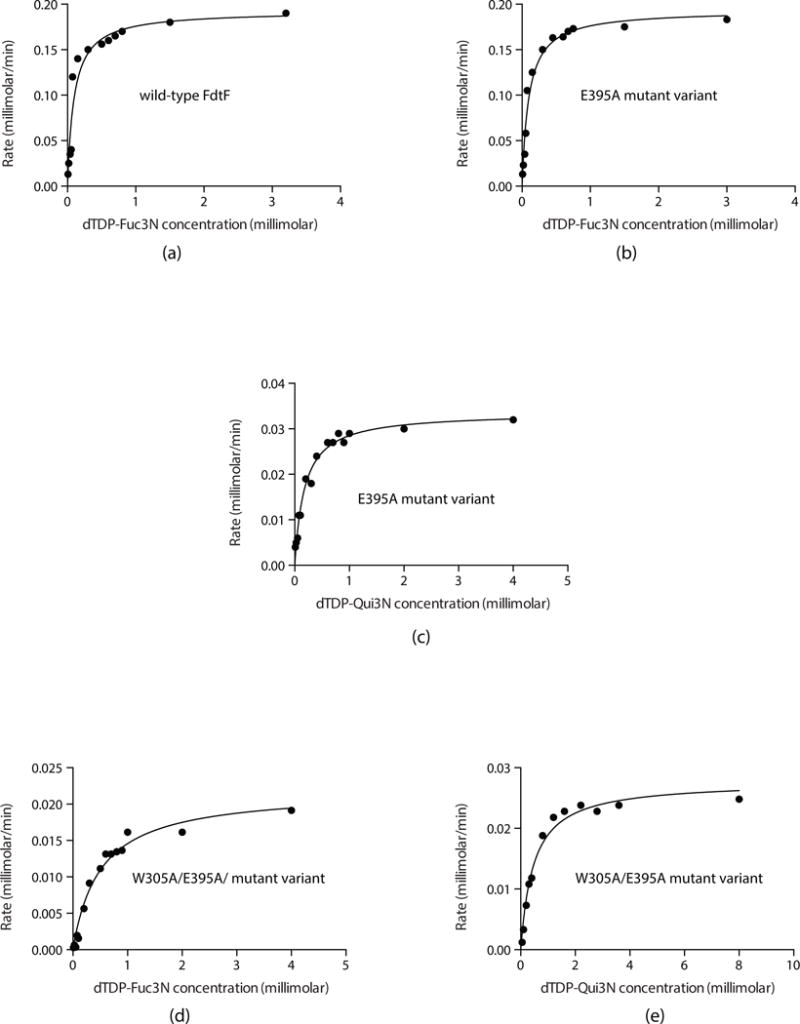
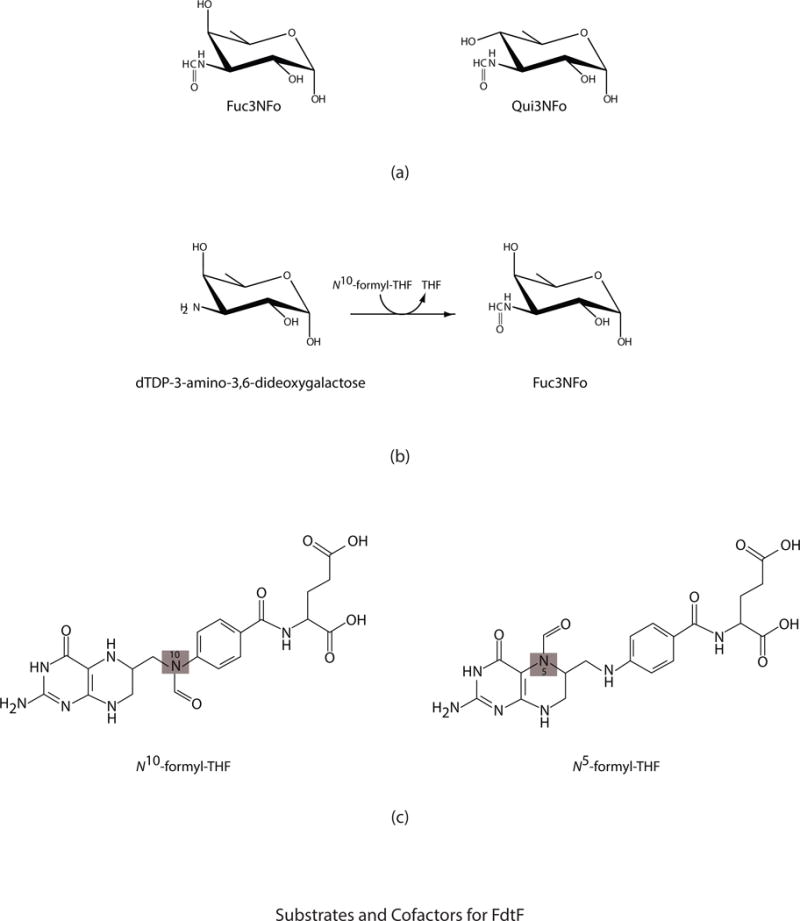
N-formylated sugars are found on the lipopolysaccharides of various pathogenic Gram negative bacteria including Campylobacter jejuni 81116, Francisella tularensis, Providencia alcalifaciens O30, and Providencia alcalifaciens O40. The last step in the biosynthetic pathways for these unusual sugars is catalyzed by N-formyltransferases that utilize N10-formyltetrahydrofolate as the carbon source. The substrates are dTDP-linked amino sugars with the functional groups installed at either the C-3' or C-4' positions of the pyranosyl rings. Here we describe a structural and enzymological investigation of the putative N-formyltransferase, FdtF, from Salmonella enterica O60. In keeping with its proposed role in the organism, the kinetic data reveal that the enzyme is more active with dTDP-3-amino-3,6-dideoxy-d-galactose than with dTDP-3-amino-3,6-dideoxy-d-glucose. The structural data demonstrate that the enzyme contains, in addition to the canonical N-formyltransferase fold, an ankyrin repeat moiety that houses a second dTDP-sugar binding pocket. This is only the second time an ankyrin repeat has been shown to be involved in small molecule binding. The research described herein represents the first structural analysis of a sugar N-formyltransferase that specifically functions on dTDP-3-amino-3,6-dideoxy-d-galactose in vivo and thus adds to our understanding of these intriguing enzymes.
Keywords: Ankyrin repeat; Lipopolysaccharide; N(10)-Formyltetrahydrofolate; N-Formyltransferase; O-antigen; dTDP-3-formamido-3,6-dideoxy-d-galactose.
Copyright © 2017 Elsevier Inc. All rights reserved.
Conflict of interest statement
The authors have no competing financial interests.
Figures
Similar articles
-
Molecular structure of an N-formyltransferase from Providencia alcalifaciens O30.Protein Sci. 2015 Jun;24(6):976-86. doi: 10.1002/pro.2675. Epub 2015 Apr 2. Protein Sci. 2015. PMID: 25752909 Free PMC article.
-
New role for the ankyrin repeat revealed by a study of the N-formyltransferase from Providencia alcalifaciens.Biochemistry. 2015 Jan 27;54(3):631-8. doi: 10.1021/bi501539a. Epub 2015 Jan 15. Biochemistry. 2015. PMID: 25574689 Free PMC article.
-
Three-dimensional structure of a sugar N-formyltransferase from Francisella tularensis.Protein Sci. 2014 Mar;23(3):273-83. doi: 10.1002/pro.2409. Epub 2014 Jan 22. Protein Sci. 2014. PMID: 24347283 Free PMC article.
-
Enzymes required for the biosynthesis of N-formylated sugars.Curr Opin Struct Biol. 2016 Dec;41:1-9. doi: 10.1016/j.sbi.2016.04.003. Epub 2016 May 20. Curr Opin Struct Biol. 2016. PMID: 27209114 Free PMC article. Review.
-
Hyperthermophilic and salt-dependent formyltransferase from Methanopyrus kandleri.Biochem Soc Trans. 2004 Apr;32(Pt 2):269-72. doi: 10.1042/bst0320269. Biochem Soc Trans. 2004. PMID: 15046586 Review.
Cited by
-
Biochemical Characterization of WbkC, an N-Formyltransferase from Brucella melitensis.Biochemistry. 2017 Jul 18;56(28):3657-3668. doi: 10.1021/acs.biochem.7b00494. Epub 2017 Jul 5. Biochemistry. 2017. PMID: 28636341 Free PMC article.
-
Misannotations of the genes encoding sugar N-formyltransferases.Protein Sci. 2020 Apr;29(4):930-940. doi: 10.1002/pro.3807. Epub 2020 Jan 20. Protein Sci. 2020. PMID: 31867814 Free PMC article.
-
Investigation of a sugar N-formyltransferase from the plant pathogen Pantoea ananatis.Protein Sci. 2019 Apr;28(4):707-716. doi: 10.1002/pro.3577. Epub 2019 Feb 8. Protein Sci. 2019. PMID: 30666752 Free PMC article.
-
The Mycobacterium tuberculosis complex has a pathway for the biosynthesis of 4-formamido-4,6-dideoxy-d-glucose.Protein Sci. 2018 Aug;27(8):1491-1497. doi: 10.1002/pro.3443. Epub 2018 Jul 18. Protein Sci. 2018. PMID: 29761597 Free PMC article.
-
Investigation of the enzymes required for the biosynthesis of an unusual formylated sugar in the emerging human pathogen Helicobacter canadensis.Protein Sci. 2021 Oct;30(10):2144-2160. doi: 10.1002/pro.4169. Epub 2021 Aug 31. Protein Sci. 2021. PMID: 34379357 Free PMC article.
References
-
- DeLano WL. The PyMOL Molecular Graphics System. DeLano Scientific; San Carlos, CA, USA: 2002.
-
- Emsley P, Cowtan K. Coot: model-building tools for molecular graphics. Acta Crystallogr D Biol Crystallogr. 2004;60:2126–2132. - PubMed
Publication types
MeSH terms
Substances
Grants and funding
LinkOut - more resources
Full Text Sources
Other Literature Sources
Molecular Biology Databases
Miscellaneous
