

doi: 10.1038/ncb3486.
Epub 2017 Mar 6.
The tetrameric kinesin Kif25 suppresses pre-mitotic centrosome separation to establish proper spindle orientation
Affiliations
- PMID: 28263957
- PMCID: PMC5376238
- DOI: 10.1038/ncb3486
Item in Clipboard
The tetrameric kinesin Kif25 suppresses pre-mitotic centrosome separation to establish proper spindle orientation
Nat Cell Biol.
2017 Apr.
Erratum in
-
Corrigendum: The tetrameric kinesin Kif25 suppresses pre-mitotic centrosome separation to establish proper spindle orientation.Nat Cell Biol. 2017 May 31;19(6):740. doi: 10.1038/ncb3546. Nat Cell Biol. 2017. PMID: 28561052 No abstract available.
Abstract
Microtubules tether centrosomes together during interphase. How this is accomplished and what benefit it provides to the cell is not known. We have identified a bipolar, minus-end-directed kinesin, Kif25, that suppresses centrosome separation. Kif25 is required to prevent premature centrosome separation during interphase. We show that premature centrosome separation leads to microtubule-dependent nuclear translocation, culminating in eccentric nuclear positioning that disrupts the cortical spindle positioning machinery. The activity of Kif25 during interphase is required to maintain a centred nucleus to ensure the spindle is stably oriented at the onset of mitosis.
Conflict of interest statement
The authors declare no competing financial interests.
Figures
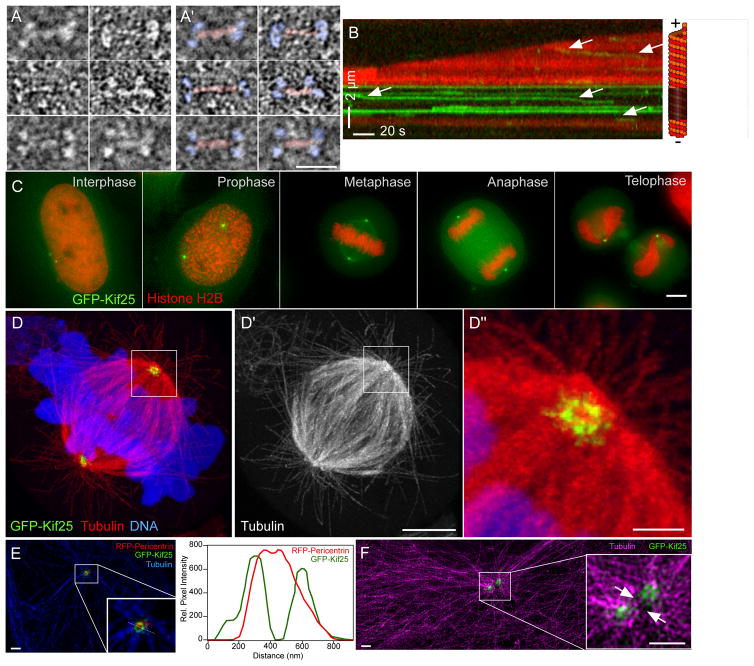
Kif25 structure and localization. (A and A′) EM structure of EGFP-Kif25 motor. Panels in A′ are identical to A with the addition of pseudo coloring to show motor domains (blue) and neck regions (red) of the motor (scale bar = 25 nm). (B) Kymograph showing movement of EGFP-Kif25 on dynamic MTs. Arrows indicate motor movement in the direction of the unlabeled seed at the minus end of the MT. Run length and velocity are calculated from n= 97 moving spots pooled from 6 separate movies. (C) EGFP-Kif25 localizes to the centrosome at all stages of HeLa cell cycle (scale bar = 5 μm). (D) Confocal image of expanded HCT-116 cells stably expressing EGFP-Kif25 and stained for α-tubulin. Kif25 localizes to a ring-like structure at the centrosome, zoomed-in view shows Kif25 also on radial spokes around the centrosome (D″) (scale bar 15 μm for D and D′, 1.5 μm for D″). (E) Localization of EGFP-Kif25 relative to RFP-pericentrin in unexpanded LLCPK1 cells imaged using structured illumination microscope (scale bars = 1 μm). Inset, zoomed-in view of area around centrosome in interphase cell. Right, line-scan of fluorescence of EGFP-Kif25 and RFP-pericentrin measured in the inset showing greater diameter of Kif25 relative to pericentrin at the centrosome. (F) SIM image of 2 centrosomes in interphase LLCPK1 cell (scale bars = 1 μm). MTs are labeled in magenta. Inset, zoomed-in view of centrosome region with arrows indicating the presence of MTs between duplicated centrosomes and Kif25 foci at the centrosomes. Four separate transfections of LLCPK cells were fixed, labeled and mounted on separate days. All were imaged individually on the same day and between 3 and 20 images collected from each slide depending on cell density. Representative images are presented from 2 different slides (1E and F). Expansion microscopy was performed on two separate sets of fixed, stained GFP-Kif25 expressing cells on separate days. Twenty-five cells were imaged and a representative cell presented (1D).
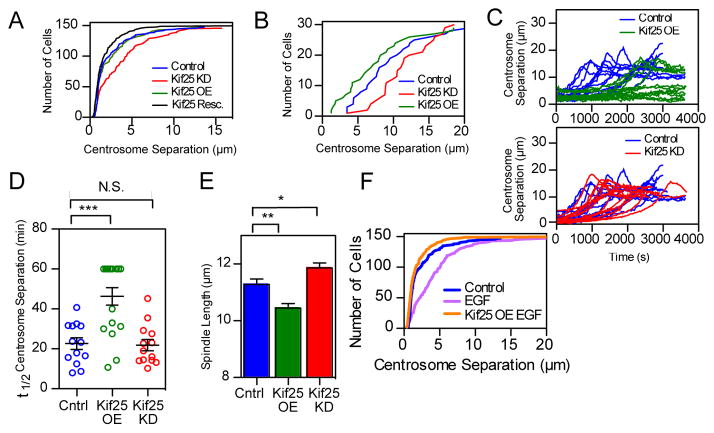
Kif25 suppresses centrosome separation. (A) Asynchronous HeLa cells stained for α- and γ-tubulin to determine centrosome separation. Cumulative frequency plot shows data pooled from 3 separate experiments (n values; control=148 cells, Kif25 KD=146 cells, Kif25 OE=148 cells, Kif25 Rescue=150 cells). Kif25 KD red line, control blue line, Kif25 OE green line, and Kif25 rescued black line, are shown. (B) Same experimental conditions as (A) except imaging prophase cells, 30 cells/condition pooled from 3 independent experiments. (C) Live HeLa cells released from monastrol treatment were used to measure centrosome separation in control (n=13 cells), Kif25 KD (n=13 cells), or Kif25 OE cells (n=15 cells), each trace represents an individual cell. (D) The t1/2 for centrosome separation measured as the time for the spindle to reach ½ the maximum measured length. Each point is a single cell, error bars represent mean±SEM, ***P=0.002 from an unpaired t test. (E) Bipolar spindle length in fixed cells following Kif25 KD or overexpression of EGFP-Kif25. Data are from n=104 control, n=108 Kif25 KD and n=74 Kif25 OE cells/condition pooled from 3 independent repeated experiments. **P=0.001, *P=0.02. (F) Cumulative frequency plot of centrosome separation in EGF-treated HeLa cells for n=148 control, n=148 EGF and n=150 EGF Kif25 cells for each condition pooled from 3 separate experiments. Average centrosome separation for EGF: 4.32±0.3 μm. P < 0.0001 compared to control. EGFP-Kif25 rescue in EGF treated cells average centrosome separation: 1.86±0.2 μm. All measurements are mean ± SEM.
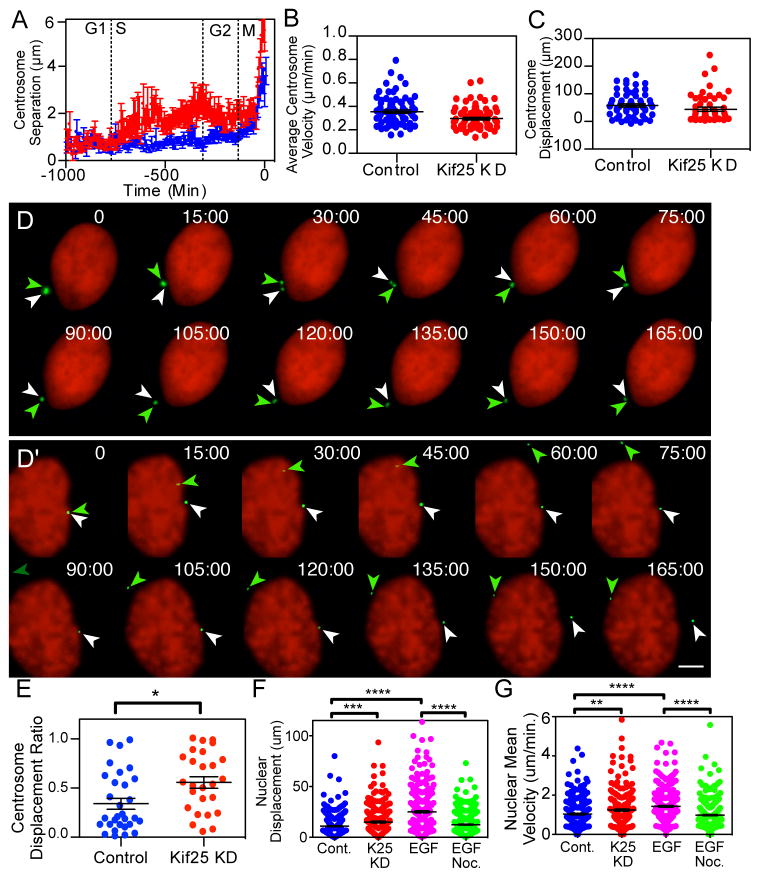
Centrosome and nuclear movements following premature centrosome separation. (A) HeLa cells were imaged every 7 min for 72 hrs to determine cell cycle timing of centrosome separation. Traces are the averaged centrosome separation distances for n=39 control cells and n=34 Kif25 KD cells where separation timing was normalized to the initial centrosome separation at the onset of mitosis. (B) Centrosome dynamics in cells were imaged every 30 s for 3 hrs. Centrosomes were analyzed for their (B) average velocity, (C) total displacement of each centrosome measured as the sum of displacements from each frame of the movie and (E) centrosome displacement ratio calculated by dividing the shorter centrosome displacement by the longer centrosome displacement for each cell observed. N=30 individual cells and 60 centrosomes for quantification in B, C and E. *P=0.01 (D and D′) Representative time-lapse images of centrosome movements in control (D) and Kif25 KD (D′) cells. Representative images represent the 30 live cells imaged for each condition quantified in Figures 3B, C, and E. Colored arrows indicate the position of each centrosome at each timepoint. H2B is labeled to visualize the nucleus while Pericentrin marks the centrosome. Scale bar equals 5 μm. (F) Nuclear Displacement and (G) velocity was tracked over time, **P=0.001 ***P=0.0005, ****P<0.0001. n=243 cells per condition. Error bars represent mean±s.e.m., statistics done using unpaired t test.
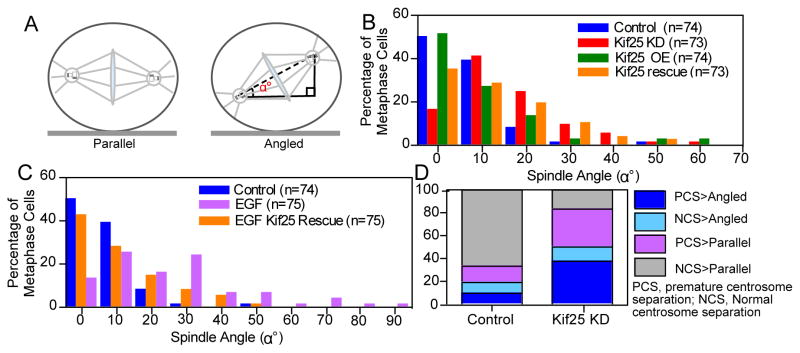
Spindle orientation is altered following premature centrosome separation. (A) Schematic showing the difference between parallel and angled spindles and the measurement of spindle orientation angle, α°, relative to the coverslip. (B) Histogram of measured spindle orientation profiles of cells fixed and labeled with α- and γ-tubulin following Kif25 KD, Kif25 OE, and EGFP-Kif25 rescue following siRNA KD. (C) Histogram of measured spindle orientation profiles of cells fixed and labeled with α- and γ-tubulin following EGF treatment and EGF-treated cells overexpressing EGFP-Kif25. (D) Parsed data showing the relationship between centrosome separation state and spindle angle during mitosis. Data is initially separated based on whether cells show normal centrosome separation or premature centrosome separation then each cell is classified based on whether the mitotic spindle is parallel to the coverslip or angled. Data is from live asynchronously cycling cells transiently expressing mRFP-Pericentrin and GFP-H2B (n=26 cells, Kif25 KD; n=25 cells Control).
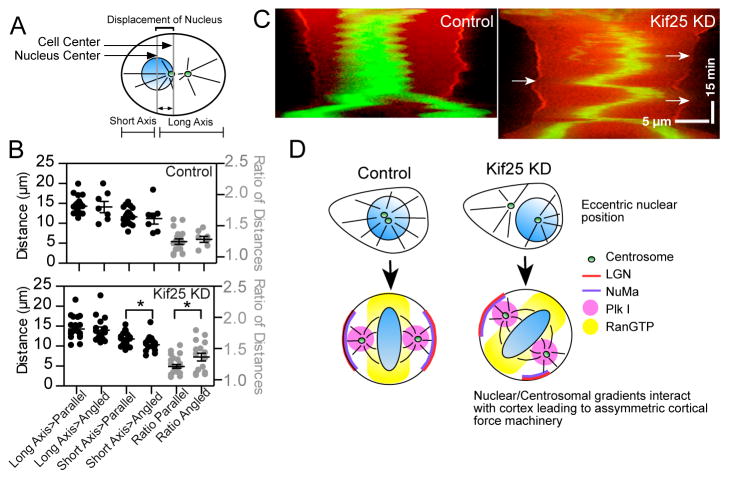
Eccentric nuclear position at mitosis onset randomizes spindle orientation. (A) Schematic showing measurements made to quantify the position of the nucleus in pre-mitotic cells. (B) Nuclear position was determined using the center-of-mass of the nucleus and measuring the distance from the cell cortex along the future cell division axis for each individual cell. A ratio of long axis-to-short axis was taken as a second measurement of nuclear centering (control cells; n=18 cells parallel group, n=7 angled group. Kif25 KD; n=22 parallel group, n=15 angled group). *P=0.025 using unpaired t test. Data are Mean ± s.e.m. (C) Representative cell kymographs showing spindle oscillations following Kif25 KD. Cells expressing tdTom-LGN and EGFP-H2B were selected while in prophase followed by imaging every 30 s. Arrows show the loss of LGN at the cortex is concurrent with close chromosome approach. Scale bars, 5 μm in X-axis and 15 min in Y-axis. (D) Model of how loss of Kif25 leads to spindle misorientation. During the normal cell cycle Kif25 suppresses centrosome separation prior to the onset of mitosis using its MT cross-linking activity (upper left). Centrally localized centrosomes and nucleus at the onset of mitosis allow Plk1 gradients from the centrosome (Pink circle) and RanGTP from the metaphase plate (Yellow) to symmetrically localize cortical force generation machinery. Without Kif25, centrosome tethering is lost and premature centrosome separation (upper right) leads to changes in centrosome movements and nuclear repositioning causing the inappropriate establishment of the spindle orientation machinery (bottom right).
Comment in
-
Cell Division: Centrosomes Have Separation Anxiety.Curr Biol. 2017 Jun 19;27(12):R601-R603. doi: 10.1016/j.cub.2017.04.050. Curr Biol. 2017. PMID: 28633031
Similar articles
-
The balance between KIFC3 and EG5 tetrameric kinesins controls the onset of mitotic spindle assembly.Nat Cell Biol. 2019 Sep;21(9):1138-1151. doi: 10.1038/s41556-019-0382-6. Epub 2019 Sep 2. Nat Cell Biol. 2019. PMID: 31481795
-
Cell Division: Centrosomes Have Separation Anxiety.Curr Biol. 2017 Jun 19;27(12):R601-R603. doi: 10.1016/j.cub.2017.04.050. Curr Biol. 2017. PMID: 28633031
-
Mammalian RanBP1 regulates centrosome cohesion during mitosis.J Cell Sci. 2003 Aug 15;116(Pt 16):3399-411. doi: 10.1242/jcs.00624. Epub 2003 Jul 2. J Cell Sci. 2003. PMID: 12840069
-
Dynamic changes in nuclear architecture during mitosis: on the role of protein phosphorylation in spindle assembly and chromosome segregation.Exp Cell Res. 1996 Dec 15;229(2):174-80. doi: 10.1006/excr.1996.0356. Exp Cell Res. 1996. PMID: 8986594 Review.
-
Positioning centrosomes and spindle poles: looking at the periphery to find the centre.Biol Cell. 2006 Sep;98(9):557-65. doi: 10.1042/BC20060017. Biol Cell. 2006. PMID: 16907664 Review.
Cited by
-
The structure and function of centriolar rootlets.J Cell Sci. 2021 Aug 15;134(16):jcs258544. doi: 10.1242/jcs.258544. Epub 2021 Aug 18. J Cell Sci. 2021. PMID: 34405868 Free PMC article.
-
Involvement of kinesins in skeletal dysplasia: a review.Am J Physiol Cell Physiol. 2024 Aug 1;327(2):C278-C290. doi: 10.1152/ajpcell.00613.2023. Epub 2024 Apr 22. Am J Physiol Cell Physiol. 2024. PMID: 38646780 Free PMC article. Review.
-
Kinesin KIFC3 is essential for microtubule stability and cytokinesis in oocyte meiosis.Cell Commun Signal. 2024 Mar 29;22(1):199. doi: 10.1186/s12964-024-01589-8. Cell Commun Signal. 2024. PMID: 38553728 Free PMC article.
-
Involvement of Kif4a in Spindle Formation and Chromosome Segregation in Mouse Oocytes.Aging Dis. 2018 Aug 1;9(4):623-633. doi: 10.14336/AD.2017.0901. eCollection 2018 Aug. Aging Dis. 2018. PMID: 30090651 Free PMC article.
-
Discovery of high-confidence human protein-coding genes and exons by whole-genome PhyloCSF helps elucidate 118 GWAS loci.Genome Res. 2019 Dec;29(12):2073-2087. doi: 10.1101/gr.246462.118. Epub 2019 Sep 19. Genome Res. 2019. PMID: 31537640 Free PMC article.
References
-
- Jean C, Tollon Y, Raynaud-Messina B, Wright M. The mammalian interphase centrosome: two independent units maintained together by the dynamics of the microtubule cytoskeleton. Eur J Cell Biol. 1999;78:549–560. - PubMed
-
- Saunders WS, Hoyt MA. Kinesin-related proteins required for structural integrity of the mitotic spindle. Cell. 1992;70:451–458. - PubMed
MeSH terms
Substances
Grants and funding
LinkOut - more resources
Full Text Sources
Other Literature Sources
Molecular Biology Databases
