. 2017 Jul 6;36(27):3807-3819.
doi: 10.1038/onc.2017.23. Epub 2017 Mar 6.

EGFR-mediated macrophage activation promotes colitis-associated tumorigenesis

Affiliations

EGFR-mediated macrophage activation promotes colitis-associated tumorigenesis

D M Hardbower et al. Oncogene. .

Abstract

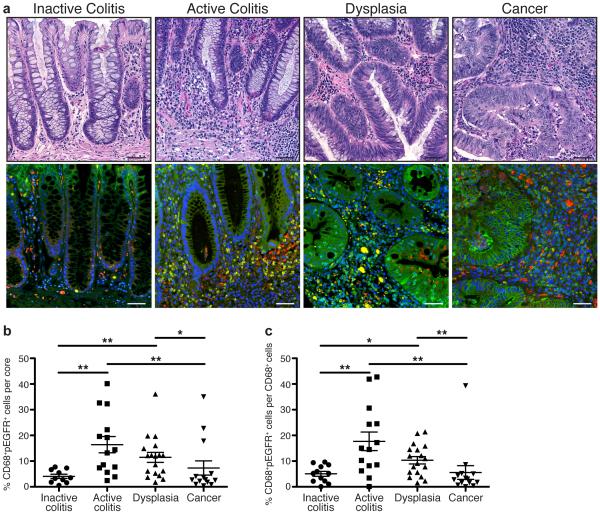
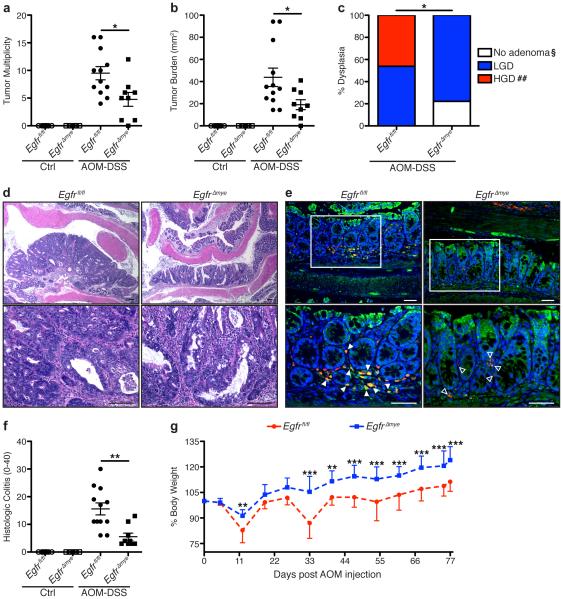
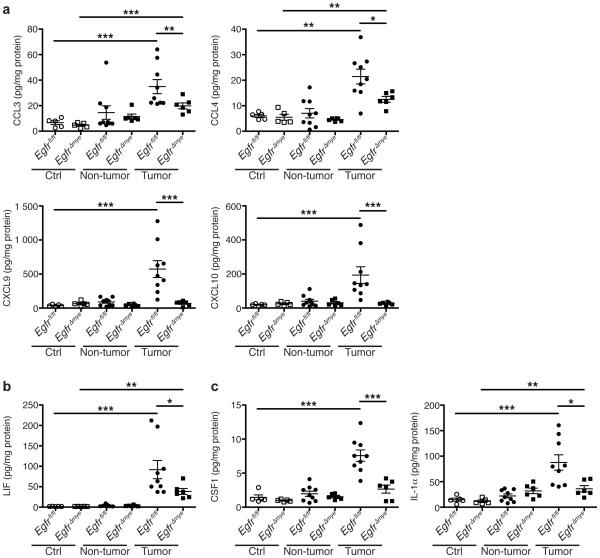
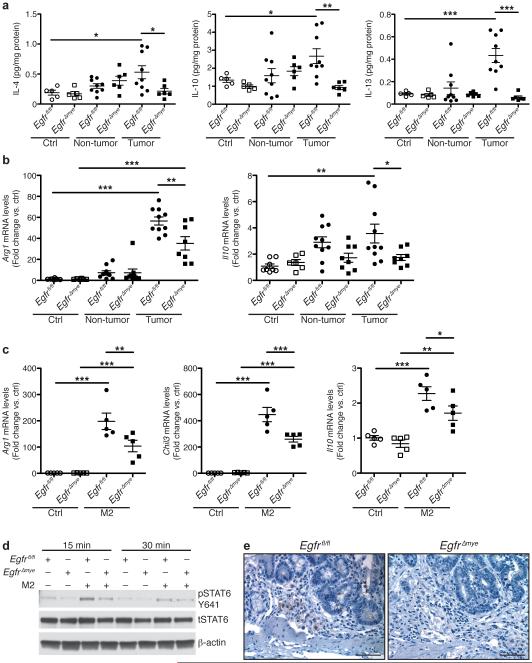
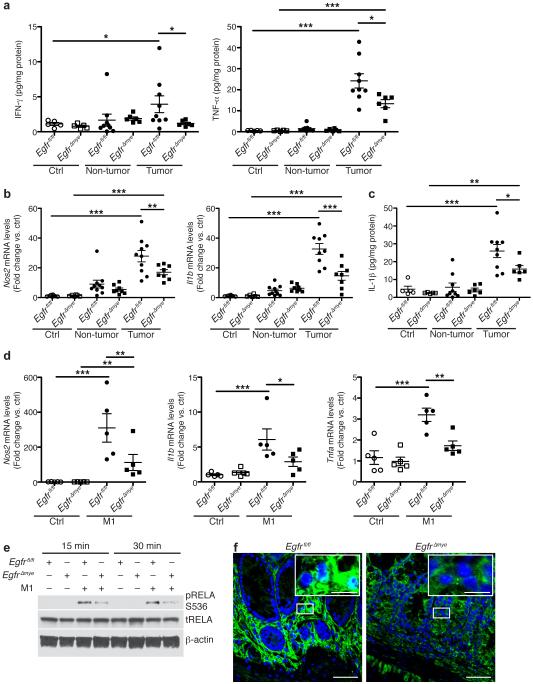
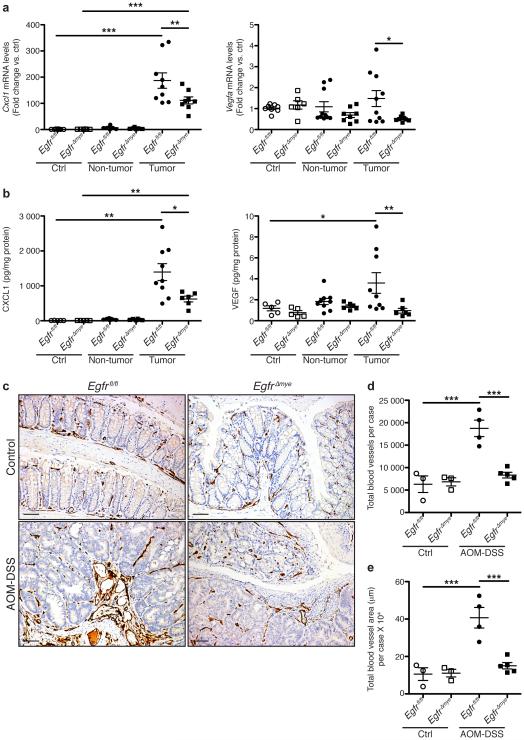
Epidermal growth factor receptor (EGFR) signaling is a known mediator of colorectal carcinogenesis. Studies have focused on the role of EGFR signaling in epithelial cells, although the exact nature of the role of EGFR in colorectal carcinogenesis remains a topic of debate. Here, we present evidence that EGFR signaling in myeloid cells, specifically macrophages, is critical for colon tumorigenesis in the azoxymethane-dextran sodium sulfate (AOM-DSS) model of colitis-associated carcinogenesis (CAC). In a human tissue microarray, colonic macrophages demonstrated robust EGFR activation in the pre-cancerous stages of colitis and dysplasia. Utilizing the AOM-DSS model, mice with a myeloid-specific deletion of Egfr had significantly decreased tumor multiplicity and burden, protection from high-grade dysplasia and significantly reduced colitis. Intriguingly, mice with gastrointestinal epithelial cell-specific Egfr deletion demonstrated no differences in tumorigenesis in the AOM-DSS model. The alterations in tumorigenesis in myeloid-specific Egfr knockout mice were accompanied by decreased macrophage, neutrophil and T-cell infiltration. Pro-tumorigenic M2 macrophage activation was diminished in myeloid-specific Egfr-deficient mice, as marked by decreased Arg1 and Il10 mRNA expression and decreased interleukin (IL)-4, IL10 and IL-13 protein levels. Surprisingly, diminished M1 macrophage activation was also detectable, as marked by significantly reduced Nos2 and Il1b mRNA levels and decreased interferon (IFN)-γ, tumor necrosis factor (TNF)-α and IL-1β protein levels. The alterations in M1 and M2 macrophage activation were confirmed in bone marrow-derived macrophages from mice with the myeloid-specific Egfr knockout. The combined effect of restrained M1 and M2 macrophage activation resulted in decreased production of pro-angiogenic factors, CXCL1 and vascular endothelial growth factor (VEGF), and reduced CD31+ blood vessels, which likely contributed to protection from tumorigenesis. These data reveal that EGFR signaling in macrophages, but not in colonic epithelial cells, has a significant role in CAC. EGFR signaling in macrophages may prove to be an effective biomarker of CAC or target for chemoprevention in patients with inflammatory bowel disease.


Figures

Figure 1
Figure 1. Macrophages have high levels of pEGFR Y1068 during inflammation driven, pre-cancerous stages of inflammatory bowel disease (IBD)-associated-colorectal cancer in human colonic tissues
(a) Representative hematoxylin and eosin (H&E)-stained images and representative immunofluorescence images of colonic tissues from the Vanderbilt University Medical Center IBD-associated colorectal cancer TMA. Red = CD68. Green = pEGFR Y1068. Yellow = Merge. Blue = DAPI. Scale bars = 50 μm. (b) Quantification of the percentage of CD68+pEGFR+ cells among the total number of cells in each individual core in the TMA, as determined by CellProfiler. (c) Quantification of the percentage of CD68+pEGFR+ cells among the total number of CD68+ cells in each individual core in the TMA. For (a-c), n = 10 inactive colitis (normal or quiescent histology) samples, 14 active colitis (mild, moderate or severe histology) samples, 18 dysplasia samples, and 14 colorectal cancer samples. For (b-c), *P < 0.05, **P < 0.01 by one-way ANOVA with Kruskal-Wallis test, followed by Mann-Whitney U test.
Figure 2
Figure 2. EgfrΔmye mice are significantly protected from tumorigenesis and dysplasia in the AOM-DSS model of colon tumorigenesis
(a) Tumor multiplicity was assessed by gross visual inspection, utilizing a dissecting microscope. (b) Tumor burden was determined by the addition of the calculated area of each identified tumor, as assessed with an electronic caliper for both length and width. (c) Percentage of cases with either no adenoma, low-grade dysplasia (LGD), and high-grade dysplasia (HGD) determined by a gastrointestinal pathologist (M.K.W.) in a blinded manner. By Chi Square test, *P < 0.05. §P < 0.05 versus Egfrfl/fl; ##P < 0.01 versus Egfrfl/fl. n = 9-12 AOM-DSS-treated animals per genotype. (d) Representative H&E-stained images from AOM-DSS-treated mice. Scale bars = 100 μm. (e) Representative immunofluorescence images of tEGFR from AOM-DSS-treated mice. Red = CD68. Green = tEGFR. Yellow = Merge. Blue = DAPI. Scale bars = 50 μm. Solid arrows indicate CD68+tEGFR+ macrophages. Open arrows indicate CD68+tEGFR macrophages. White box indicates zoomed area. n = ≥ 3 mice per genotype assessed. (f) Histologic colitis was determined by M.K.W. (g) Percentage of initial body weight was assessed at the indicated time points. *P < 0.05, **P < 0.01, ***P < 0.001 versus Egfrfl/fl AOM-DSS by two-way ANOVA with Bonferroni post-test (ANOVA significance = P < 0.001). In (a), (b), and (f), *P < 0.05, **P < 0.01 by one-way ANOVA with Kruskal-Wallis test, followed by Mann-Whitney U test. In (a), (b), (f), and (g), n = 7-9 control and 9-12 AOM-DSS-treated mice per genotype.
Figure 3
Figure 3. EgfrΔmye mice have significantly decreased cytokine and chemokine production within colon tumors
In a-c, protein levels were assessed by Luminex Multiplex Array from colonic tissues a 77 days post-AOM injection. (a) Levels of the C-C motif and C-X-C motif chemokines CCL3 (MIP-1α), CCL4 (MIP-1β), CXCL9 (MIG), and CXCL10 (IP-10). (b) Levels of the pleiotropic cytokine, LIF. (c) Levels of cytokines produced by activated macrophages, CSF1 (M-CSF) and IL-1α. In all panels, *P < 0.05, **P < 0.01, ***P < 0.001 by one-way ANOVA with Kruskal-Wallis test, followed by Mann-Whitney U test. In all panels, n = 5 control tissues and 6-9 tumors with paired non-tumor area per genotype.
Figure 4
Figure 4. EgfrΔmye mice have significantly decreased macrophage, neutrophil and T cell infiltration during AOM-DSS treatment
(a) Quantification of CD68+ macrophage abundance with representative immunoperoxidase images of CD68 staining in AOM-DSS-treated mice. (b) Quantification of myeloperoxidase+ (MPO) neutrophil abundance with representative immunoperoxidase images of MPO staining in AOM-DSS-treated mice. (c) Quantification of CD3+ T cell abundance with representative immunoperoxidase images of CD3 staining in AOM-DSS-treated mice. (d) Quantification of CD45R+ B cell abundance with representative immunoperoxidase images of CD45R staining in AOM-DSS-treated mice. Scoring of immune cell abundance was performed by M.B.P. as described Materials and Methods. In all panels, scale bars = 50 μm. In all panels, n = 3 control and 5 AOM-DSS-treated mice per genotype. In all panels, *P < 0.05, **P < 0.01, ***P < 0.001 by one-way ANOVA with Newman-Keuls post-test after the data were square-root transformed.
Figure 5
Figure 5. EgfrΔmye mice demonstrate decreased M2 macrophage activation during colon tumorigenesis
(a) Protein levels of the M2 stimuli, IL-4, IL-10, and IL-13, were assessed by Luminex Multiplex Array from colonic tissues 77 days post-AOM injection. n = 5 control tissues and 6-9 tumors with paired non-tumor area per genotype. (b) mRNA levels of M2 markers, Arg1 and Il10, were assessed by qRT-PCR from colonic tissues 77 days post-AOM injection. n = 6-8 control tissues and 8-10 tumors with paired non-tumor area per genotype. In (a) and (b), *P < 0.05, **P < 0.01, ***P < 0.001 by one-way ANOVA with Kruskal-Wallis test, followed by Mann-Whitney U test. (c) mRNA levels of M2 markers, Arg1, Chil3, and Il10, were assessed by qRT-PCR in BMmacs 24 h post-treatment with classical M2 stimuli, IL-4 (10 ng/mL) and IL-10 (10 ng/mL). n = 5 biological replicates per genotype. In (c), *P < 0.05, **P < 0.01, ***P < 0.001 by one-way ANOVA with Newman-Keuls post-test. (d) Representative western blot of pSTAT6 levels in BMmacs stimulated with the M2 stimulus, IL-4 (10 ng/mL), for the indicated times. n = 3 biological replicates. (e) Representative images of pSTAT6 immunoperoxidase staining in AOM-DSS-treated tissues. Scale bar = 50 μm. n = 3 mice per genotype.
Figure 6
Figure 6. EgfrΔmye mice demonstrate decreased M1 macrophage activation during colon tumorigenesis
(a) Protein levels of M1 stimuli, IFN-γ and TNF-α, were assessed by Luminex Multiplex Array from colonic tissues 77 days post-AOM injection. n = 5 control tissues and 6-9 tumors with paired non-tumor area per genotype. (b) mRNA levels of M1 markers, Nos2 and Il1b, were assessed by qRT-PCR from colonic tissues 77 days post-AOM injection. n = 6-8 control tissues and 8-10 tumors with paired non-tumor area per genotype. (c) Protein levels of the M1 marker, IL-1β, were assessed by Luminex Multiplex Array from colonic tissues 77 days post-AOM injection. n = 5 control tissues and 6-9 tumors with paired non-tumor area per genotype. In (a-c), *P < 0.05, **P < 0.01, ***P < 0.001 by one-way ANOVA with Kruskal-Wallis test, followed by Mann-Whitney U test. (d) mRNA levels of M1 markers, Nos2, Il1b, and Tnfa, were assessed by qRT-PCR in bone marrow derived macrophages (BMmacs) 24 h post-treatment with classical M1 stimuli, IFN-γ (200 U/mL) and TNF-α (10 ng/mL). n = 5 biological replicates per genotype. In (d), *P < 0.05, **P < 0.01, ***P < 0.001 by one-way ANOVA with Newman-Keuls post-test. (e) Representative western blot of pRELA (pp65) levels in BMmacs stimulated with the M1 stimuli, IFN-γ (200 U/mL) and lipopolysaccharide (10 ng/mL), for the indicated times. n = 3 biological replicates. (e) Representative confocal immunofluorescence images of cytoplasmic and nuclear RELA (p65) in AOM-DSS-treated tissues. Green = cytoplasmic RELA. White/Aqua = nuclear RELA. Blue = DAPI. Scale bar = 40 μm, Scale bar in inset = 10 μm. n = 3 mice per genotype.
Figure 7
Figure 7. EgfrΔmye mice demonstrate decreased pro-angiogenic chemokine/cytokine production and angiogenesis during colon tumorigenesis
(a) mRNA levels of the pro-angiogenic chemokine, Cxcl1, and the pro-angiogenic cytokine, Vegfa, were assessed by qRT-PCR from colonic tissues 77 days post-AOM injection. n = 6-8 control tissues and 8-10 tumors with paired non-tumor area per genotype. (b) Protein levels of pro-angiogenic chemokine, CXCL1, and pro-angiogenic cytokine, VEGF, were assessed by Luminex Multiplex Array from colonic tissues 77 days post-AOM injection. n = 5 control tissues and 6-9 tumors with paired non-tumor area per genotype. In (a) and (b), *P < 0.05, **P < 0.01, ***P < 0.001 by one-way ANOVA with Kruskal-Wallis test, followed by Mann-Whitney U test. (c) Representative images of CD31+ blood vessel immunohistochemistry in colonic tissues. Scale bars = 50 μm. (d) Quantification of the total number of CD31+ blood vessels in (c). n = 3 control colonic tissues and 4-5 AOM-DSS-treated colonic tissues per genotype. (e) Quantification of the total CD31+ blood vessel area within tissues in (c). n = 3 control colonic tissues and 4-5 AOM-DSS-treated colonic tissues per genotype. In (d) and (e), ***P < 0.001 by one-way ANOVA with Newman-Keuls post-test.

Similar articles

Cited by

References

    1. Global Burden of Disease Cancer C. Fitzmaurice C, Dicker D, Pain A, Hamavid H, Moradi-Lakeh M, et al. The Global Burden of Cancer 2013. JAMA Onc. 2015;1:505–527. - PMC - PubMed
    1. Brower V. Feeding the flame: new research adds to role of inflammation in cancer development. J Natl Cancer Inst. 2005;97:251–253. - PubMed
    1. Feagins LA, Souza RF, Spechler SJ. Carcinogenesis in IBD: potential targets for the prevention of colorectal cancer. Nat Rev Gastroenterol Hepatol. 2009;6:297–305. - PubMed
    1. Terzic J, Grivennikov S, Karin E, Karin M. Inflammation and colon cancer. Gastroenterology. 2010;138:2101–2114. e2105. - PubMed
    1. Martinez FO, Gordon S. The M1 and M2 paradigm of macrophage activation: Time for reassessment. F1000Prime Rep. 2014;6:13. - PMC - PubMed

MeSH terms