. 2017 Mar 6;13(3):e1006266.
doi: 10.1371/journal.ppat.1006266. eCollection 2017 Mar.

Parvovirus B19 NS1 protein induces cell cycle arrest at G2-phase by activating the ATR-CDC25C-CDK1 pathway

Affiliations

Parvovirus B19 NS1 protein induces cell cycle arrest at G2-phase by activating the ATR-CDC25C-CDK1 pathway

Peng Xu et al. PLoS Pathog. .

Abstract

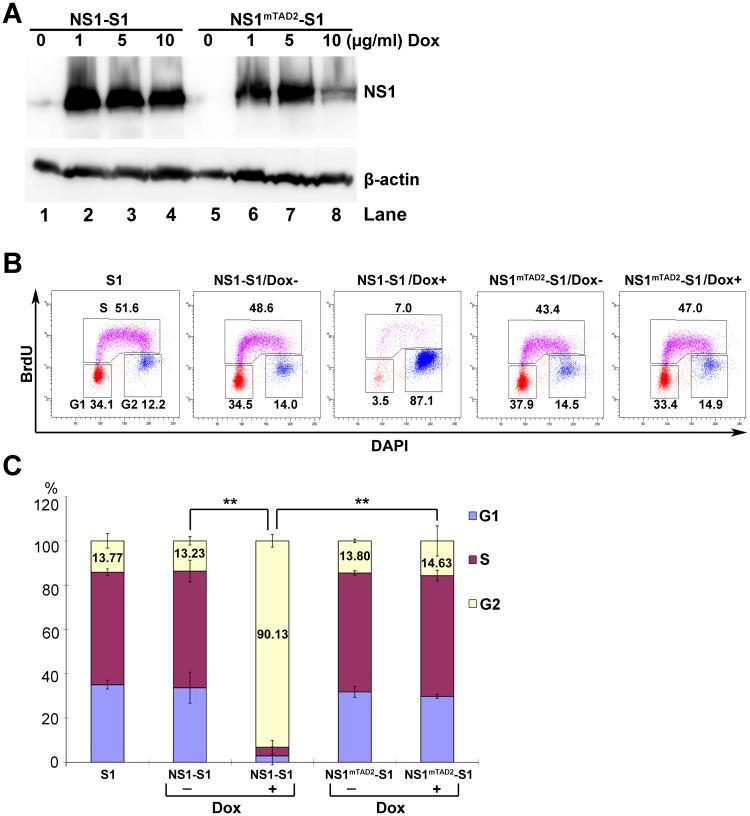
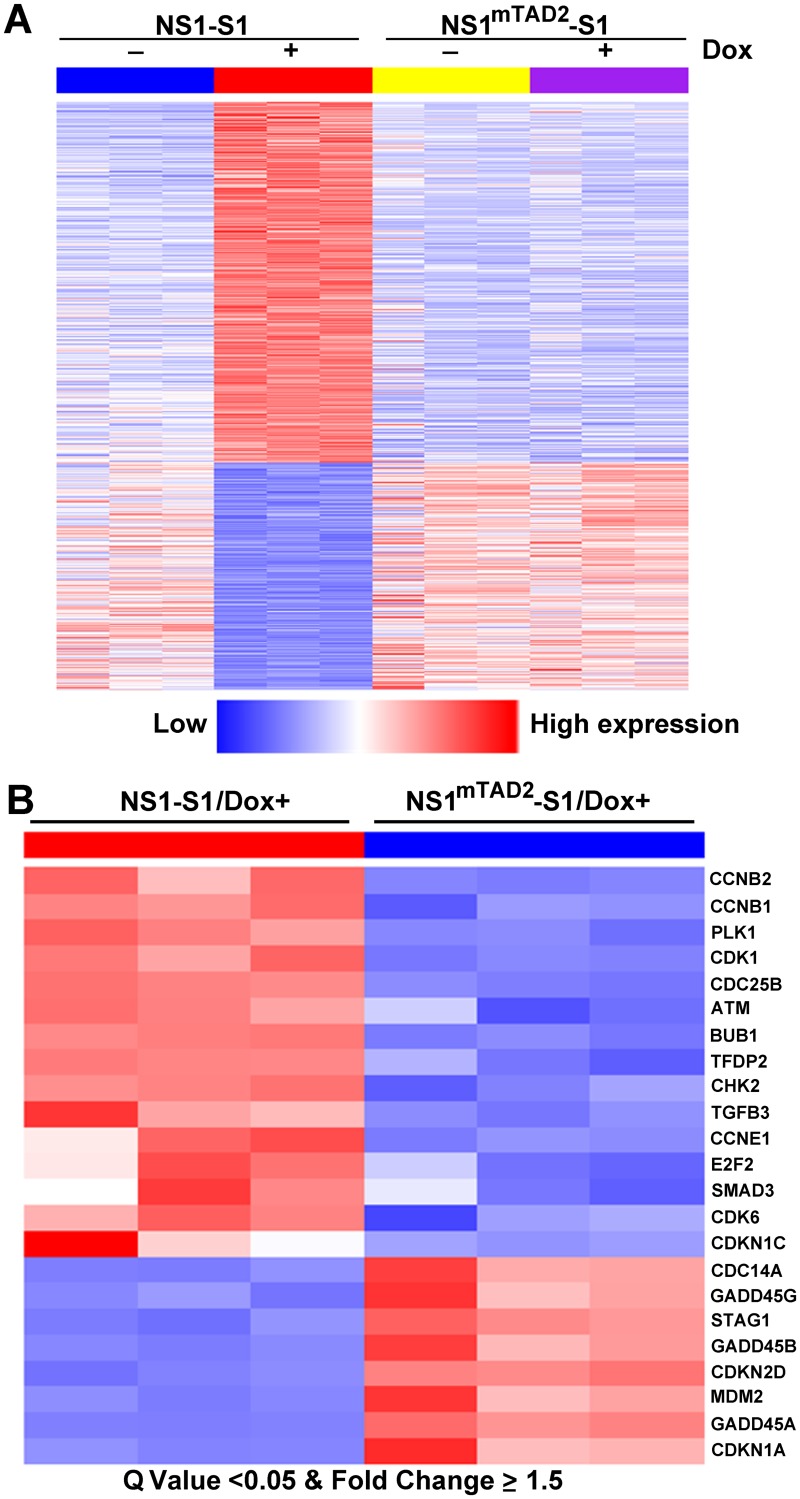
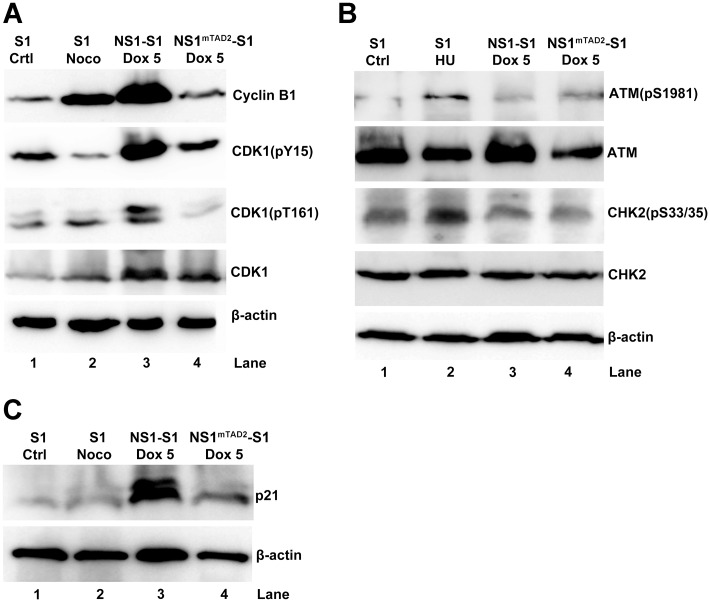
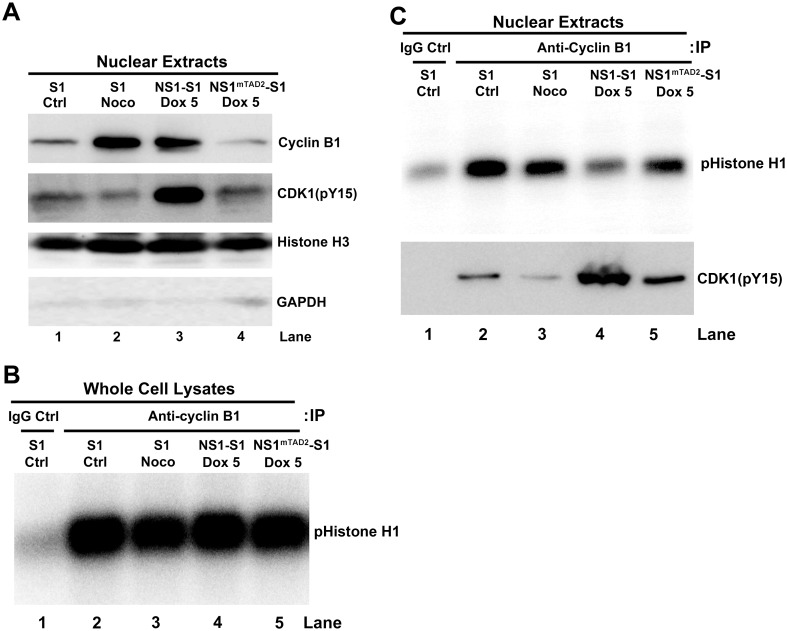
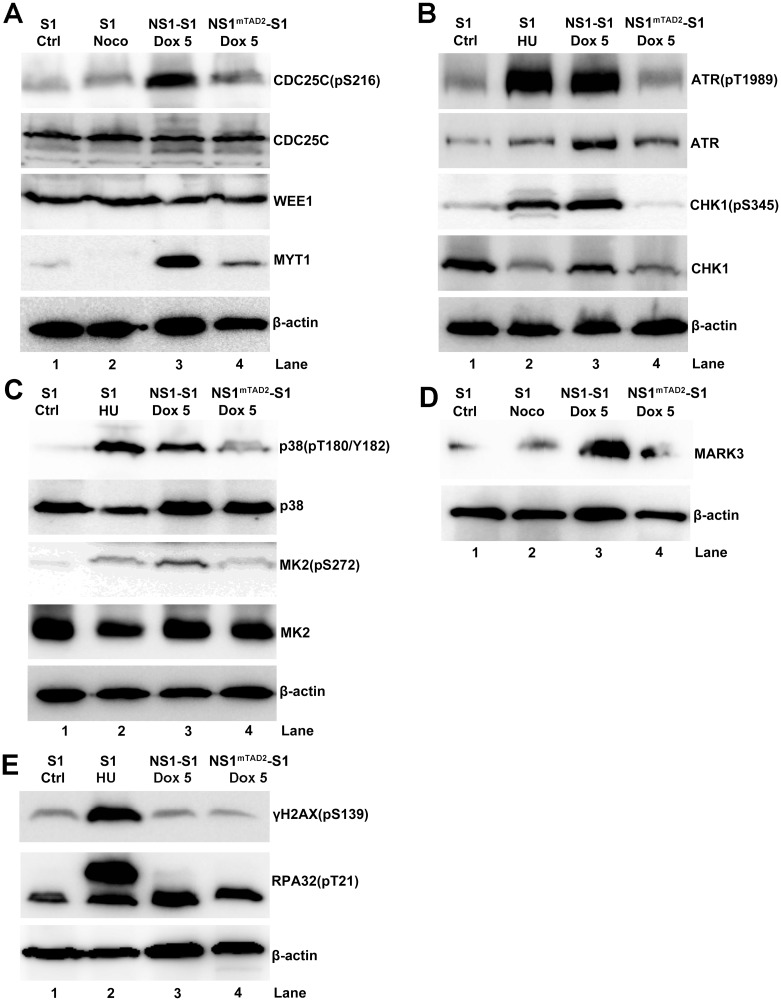
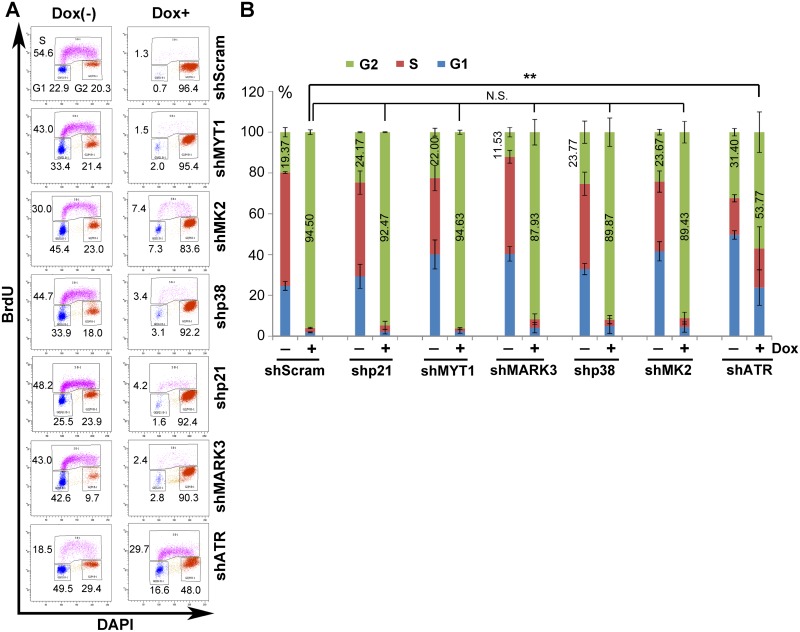
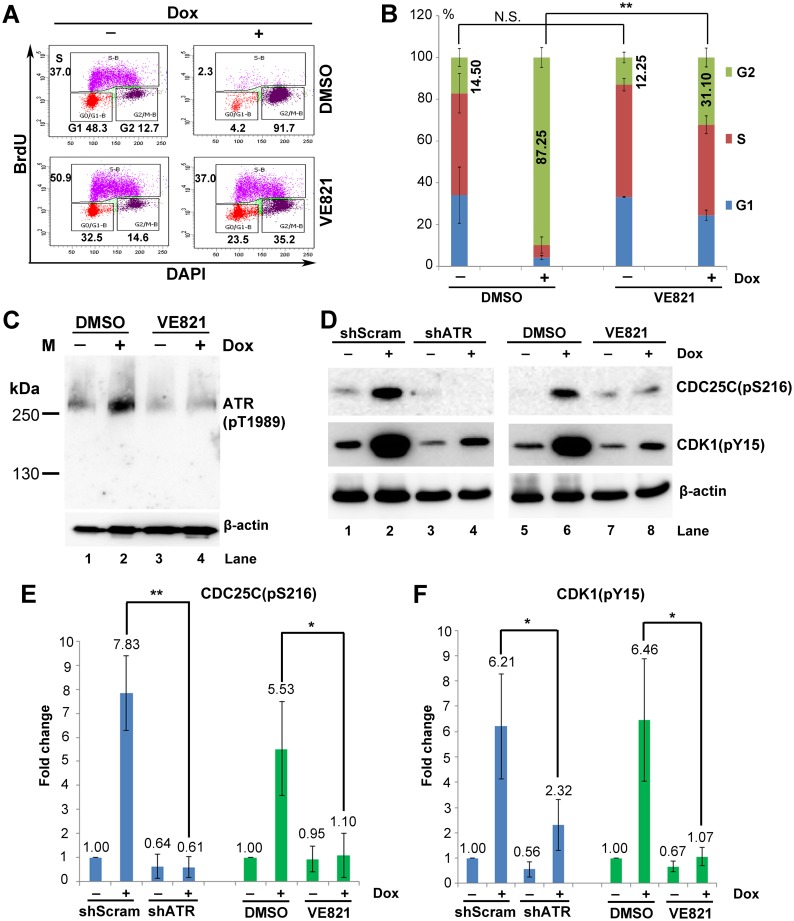
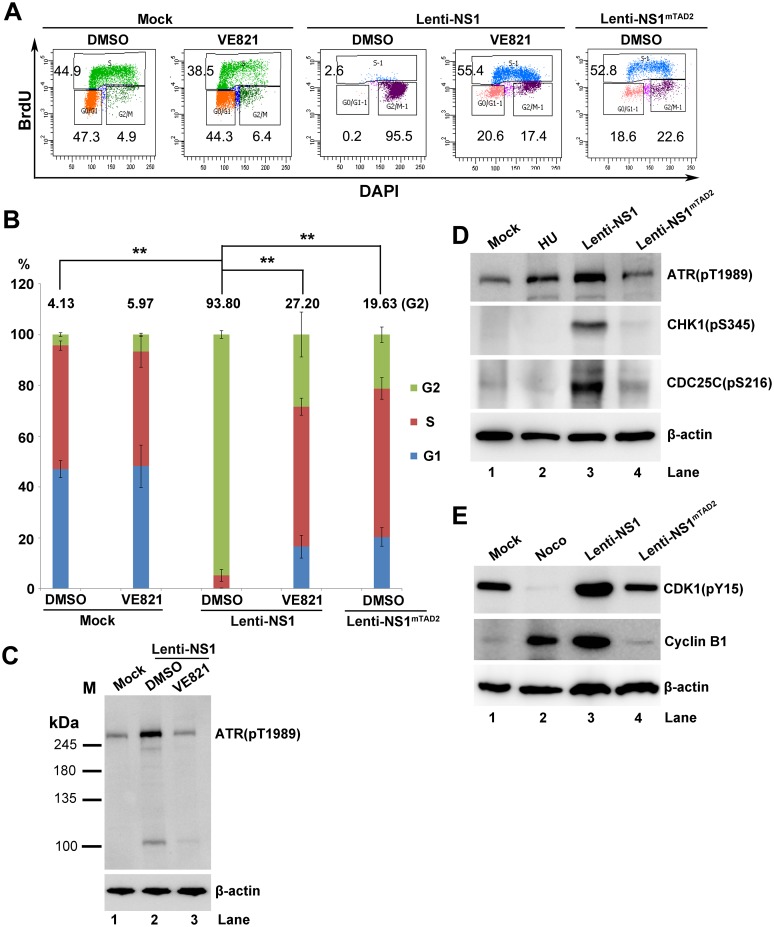
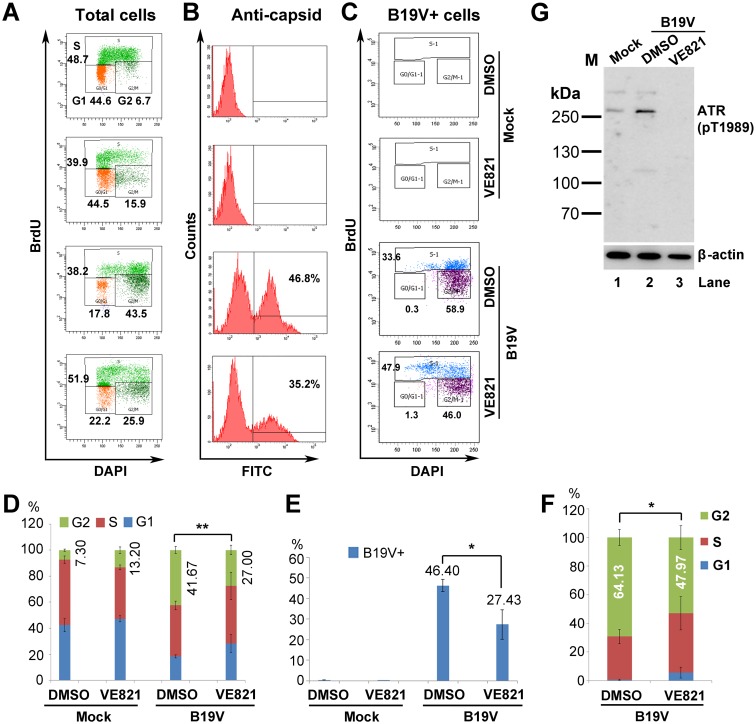
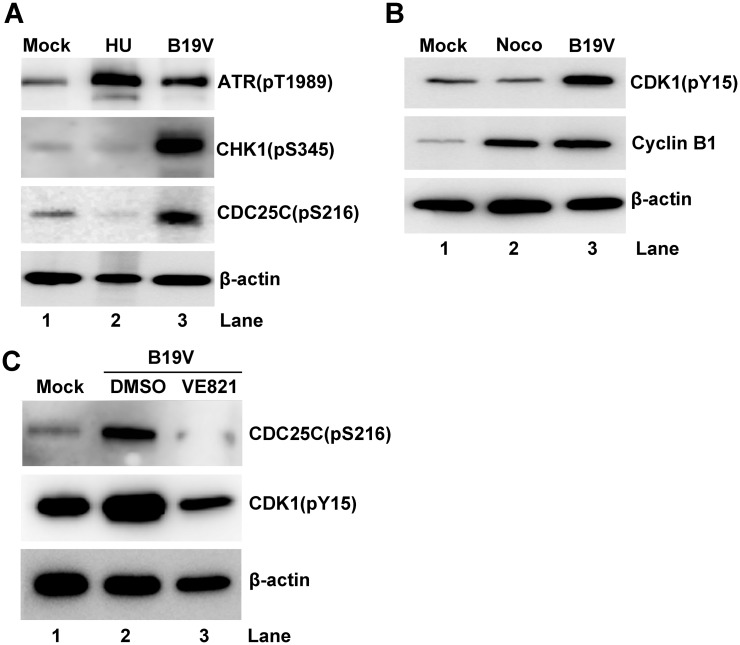
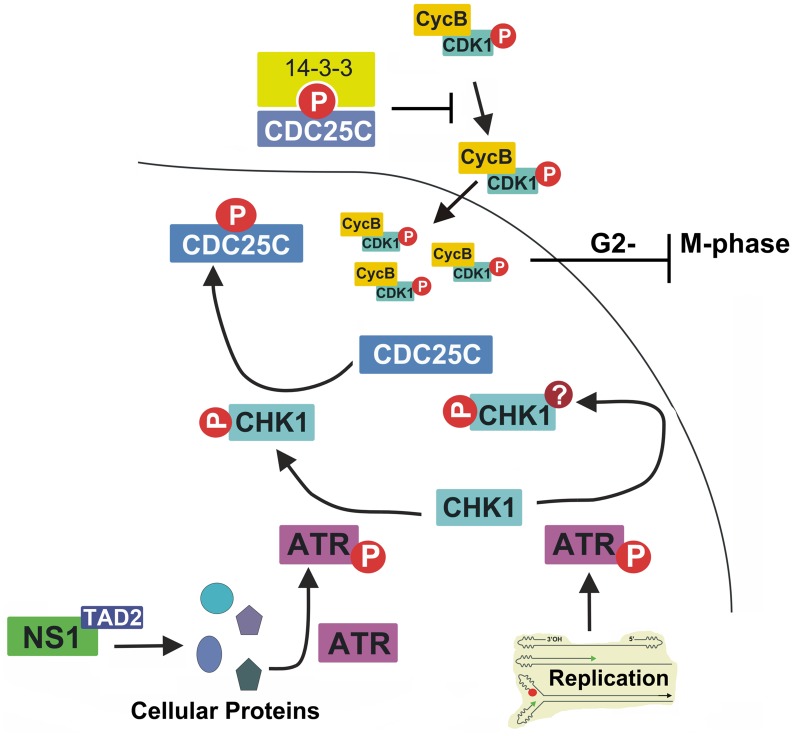
Human parvovirus B19 (B19V) infection of primary human erythroid progenitor cells (EPCs) arrests infected cells at both late S-phase and G2-phase, which contain 4N DNA. B19V infection induces a DNA damage response (DDR) that facilitates viral DNA replication but is dispensable for cell cycle arrest at G2-phase; however, a putative C-terminal transactivation domain (TAD2) within NS1 is responsible for G2-phase arrest. To fully understand the mechanism underlying B19V NS1-induced G2-phase arrest, we established two doxycycline-inducible B19V-permissive UT7/Epo-S1 cell lines that express NS1 or NS1mTAD2, and examined the function of the TAD2 domain during G2-phase arrest. The results confirm that the NS1 TAD2 domain plays a pivotal role in NS1-induced G2-phase arrest. Mechanistically, NS1 transactivated cellular gene expression through the TAD2 domain, which was itself responsible for ATR (ataxia-telangiectasia mutated and Rad3-related) activation. Activated ATR phosphorylated CDC25C at serine 216, which in turn inactivated the cyclin B/CDK1 complex without affecting nuclear import of the complex. Importantly, we found that the ATR-CHK1-CDC25C-CDK1 pathway was activated during B19V infection of EPCs, and that ATR activation played an important role in B19V infection-induced G2-phase arrest.


Conflict of interest statement

Steve Kleiboeker is an employee at Viracor-IBT Laboratories. This study has nothing relating to his employment, consultancy, patents, products in development or marketed products in the company. All other authors have declared that no competing interests exist.

Figures

Fig 1
Fig 1. Putative Transactivation Domain 2 (TAD2) is essential for NS1-induced G2-phase cycle arrest.
(A) Western blot analysis. NS1-S1 and NS1mTAD2-S1 cell lines were treated with different concentrations of Dox (1, 5, or 10 μg/ml) to induce expression of NS1 or NS1mTAD2, respectively. After 72 h, cell lysates were prepared and probed for NS1 and β-actin expression using anti-strep and anti-β-actin antibodies, respectively. (B) Cell cycle analysis. NS1-S1 and NS1mTAD2-S1 cells were treated with Dox (Dox+; 5 μg/ml) or not (Dox-) for 72 h and then incubated with BrdU, followed by treatment with 1N HCl. Treated cells were stained with an anti-BrdU antibody, and secondary antibody, and DAPI prior to flow cytometry. The numbers in each histogram are percentages of the cell populations with all BrdU-positive (S-phase), and BrdU-negative cell populations of 2N and 4N DNA content (G1- and G2-phase, respectively). (C) Statistical analysis. The percentage of cells at G1, S, and G2 are depicted in color. The percentages of the cells at G2-phase are shown in numbers, and compared in pairs as shown. **P<0.01.
Fig 2
Fig 2. Transcriptomes of NS1-S1 and NS1mTAD2-S1 cell lines treated with or without Dox.
(A) Heatmap of 1,770 genes differentially expressed between NS1-S1 and NS1mTAD2-S1 cell lines (Gene set 5). First, genes differentially expressed between NS1-S1 cell lines treated with and without Dox (NS1-S1 Dox+/-; Gene set 1) and between both NS1-S1 and NS1mTAD2-S1 cell lines treated with Dox (NS1-S1/Dox+ and NS1mTAD2-S1/Dox+; Gene set 2) were identified. Gene set 3 contains overlapped differential genes both in Gene sets 1 and 2. Next, genes differentially expressed between NS1mTAD2-S1 cells treated with and without Dox (NS1mTAD2-S1 Dox+/-) were identified as Gene set 4. Finally, Gene set 5, which represents the genes regulated by NS1 TAD2, was obtained by subtracting Gene set 4 from Gene set 3, and is shown. (B) Heatmap of 23 KEGG cell cycle genes showing significant differential expression between NS1-S1/Dox+ and NS1mTAD2-S1/Dox+ (Q value < 0.05 and fold change ≥ 1.5). Each column represents gene expression data for a NS1-S1 or a NS1mTAD2-S1 cell line (n = 3/cell line). Each row represents a gene. Red indicates increased expression. Blue indicates decreased expression.
Fig 3
Fig 3. NS1 upregulates expression of cyclin B1, CDK1, and p21, but not expression of ATM and CHK2.
NS1-S1 and NS1mTAD2-S1 cells were treated with Dox (5 μg/ml) and collected and lysed 72 h later. (A) Cell lysates were analyzed for expression of cyclin B1, phosphorylated CDK1 (CDK1(pY15) and CDK1(pT161), lower band [42]), and total CDK1 by Western blotting. (B) Cell lysates were analyzed for expression of ATM(pS1981), ATM, CHK2, CHK2(pS33/35), and β-actin by Western blotting. (C) Cell lysates were analyzed for expression of p21 by Western blotting with an anti-p21 antibody. β-actin was used as a loading control. Untreated UT7/Epo-S1 (S1) cells, S1 cells treated with nocodazole (Noco), and S1 cells treated with hydroxyurea (HU) were used as controls.
Fig 4
Fig 4. NS1 does not block the cyclin B1/CDK1 complex from entering the nucleus but it does inhibit its kinase activity.
(A) Western blot analysis. NS1-S1 and NS1mTAD2-S1 cells were treated with Dox for 72 h, collected, and lysed, and the nuclei were extracted. Western blot analysis was then performed to detect cyclin B1 and phosphorylated CDK1(pY15), as well as nuclear histone H3 and cytoplasmic GAPDH (Glyceraldehyde-3-Phosphate Dehydrogenase). Nuclear extracts from S1 cells and S1 cells treated with nocodazole (Noco) were loaded as controls. (B&C) In vitro CDK1 kinase assay. Equivalent amounts of proteins derived from whole cell lysate (B) or nuclear extracts (C) from S1 cells, S1 cells treated with Noco, and Dox-induced NS1-S1 and NS1mTAD2-S1 cells were immunoprecipitated with anti-cyclin B1-crosslinked protein A/G Plus agarose beads for in vitro CDK1 kinase assay. The final products were resolved on a 12% SDS-polyacrylamide gel. The gel was then dried prior to autoradiography, and the phosphorylated histone H1 (pHistone H1) is indicated. (C) Lower panel: Co-Immunoprecipitation (Co-IP) of cyclin B1 and CDK1(pY15) in the nuclear extracts. Nuclear extracts prepared from S1, S1/Noco, NS1-S1/Dox+, and NS1mTAD2-S1/Dox+ cells were immunoprecipitated with an anti-cyclin B1 antibody. The eluted proteins were analyzed for CDK1(pY15) by Western blotting. Normal mouse IgG (IgG Ctrl) was used as negative control of immunoprecipitation of control S1 cell extracts.
Fig 5
Fig 5. The NS1 TAD2 domain is responsible for transactivation of various cell cycle related genes.
NS1-S1 and NS1mTAD2-S1 cells were induced by Dox (5 μg/ml) for 72 h. The cells were then collected, lysed, and immunoblotted with the indicated antibodies in each panel (A-E). S1 cells and S1 cells treated with Noco or HU were loaded as controls. β-actin was used as a loading control.
Fig 6
Fig 6. Knockdown of ATR diminishes NS1-induced G2-phase arrest in UT7/Epo-S1 cells.
(A) Cell cycle analysis. NS1-S1 cells were transduced with shRNA-expressing lentivirus as indicated. After 48 h, cells were treated with Dox at 5 μg/ml (Dox+) or without (Dox-). After 72 h, the cells were collected and co-stained with an anti-BrdU antibody and DAPI. Cell cycle analysis of mCherry-expressing cells is shown. (B) Statistical analyses. The percentage of cells at G1-, S-, and G2-phase after shRNA transduction is depicted in color. The numbers show the percentages of the cells at G2-phase. The percentage of shScram and other shRNAs transduced NS1-expressing cells at G2-phase was statistically analyzed. **P<0.01, and N.S. represents no significance.
Fig 7
Fig 7. Inhibiting ATR phosphorylation abolishes NS1-induced G2-phase arrest in UT7/Epo-S1 cells.
(A) Cell cycle analysis. NS1-S1 cells were treated with the ATR-specific inhibitor VE821 at 3 h prior to Dox treatment. At 72 h post-treatment, the cells were then collected and co-stained with an anti-BrdU antibody and DAPI prior for flow cytometry. DMSO-treated NS1-S1 cells were used as a control. (B) Statistical analyses. The percentage of the cells at each stage of the cell cycle is depicted in color. Numbers shown are the percentages at G2-phase and are statistically compared within cell groups treated with or without Dox induction as indicated. **P<0.01, and N.S. represents no significance. (C) ATR inhibition. After treatment with DMSO or VE821, cells were collected, and expression of ATR(pT1989) was examined by Western blotting. (D) Activation of the ATR-CDC25C-CDK1 pathway. NS1-S1 cells were either transduced with lentivirus harboring scramble or ATR-specific shRNA for 48 h, or treated with DMSO and VE821, and then treated with Dox for 72 h. The cells were then collected, lysed, and immunoblotted with the indicated antibodies. (E&F) Quantification. The detected bands of CDC25C(pS216) and CDK1(pY15) shown in panel D were quantified, and the results are expressed as the mean ± standard deviation of at least three independent experiments. Statistical analysis was performed in paired groups as indicated. **P<0.01, and *P<0.05.
Fig 8
Fig 8. Inhibition of ATR activation inhibits the NS1-induced G2-phase arrest of CD36+ EPCs.
(A) Cell cycle analysis. CD36+ EPCs were treated with VE821 at 3 h prior to NS1-expressing lentivirus transduction or mock transduction. After 48 h, cells were collected, and the cell cycle phase of NS1-expressing cells (selected by staining with anti-Flag) was examined by flow cytometry. (B) Statistical analyses. The percentage of cells treated with DMSO or VE821 that were at G1-, S-, and G2-phase is depicted in color. The numbers shown are the percentages of the cells at G2-phase, and are statistically compared as indicated. ** P<0.01. (C-E) Western blot analysis. (C) CD36+ EPCs were either treated with DMSO or VE821 at 3 h prior to lentivirus or mock transduction. After 48 h, cells were collected for Western blotting to detect ATR(pT1989). (D&E) CD36+ EPCs were transduced with Lenti-NS1 or Lenti-NS1mTAD2. After 48 h, cells were collected for Western blotting to detect ATR(pT1989), CHK1(pS345), CDC25C(pS216), CDK1(pY15), and β-actin. Cells treated with HU or Noco at 24 h prior to analysis were used as controls.
Fig 9
Fig 9. Inhibition of ATR activation significantly decreases B19V-induced G2 arrest in infected CD36+ EPCs.
(A–C) B19V infection and cell cycle analysis. CD36+ EPCs were treated with VE821 for 3 h prior to B19V or mock infection. After 48 h, cells were collected, stained with an anti-capsid antibody, and cell cycle phase was examined by flow cytometry. (A) Total cells were selected for cell cycle analysis. (B) Percentage of B19V capsid-expressing cells were analyzed. (C) Anti-capsid staining-positive were selected for cell cycle analysis. (D–F) Statistical analyses. (D) The percentage of cells treated with DMSO or VE821 that were at G1-, S-, and G2-phase is depicted in color. The numbers shown are the percentages of the cells at G2, and are statistically compared as indicated. (E) The percentage of anti-capsid positive (B19V+) cells is shown the mean ± standard deviation of at least three independent experiments. (F) The percentage of capsid-expressing cells at G1-, S-, and G2-phase is depicted in color. The numbers shown are percentages of the cells at G2. **P<0.01 and *P<0.05. (G) Western blot analysis. CD36+ EPCs were either treated with DMSO or VE821 at 3 h prior to B19V infection or mock-infection. After 48 h, cells were collected for Western blotting to detect ATR(pT1989).
Fig 10
Fig 10. The ATR-CHK1-CDC25C-cyclin B1/CDK1 pathway is activated in B19V-infected CD36+ EPCs.
(A&B) CD36+ EPCs were infected with B19V or mock-infected. (C) CD36+ EPCs were treated with VE821 or DMSO at 3 h prior to B19V infection. After 48 h, cells were collected, lysed, and examined by Western blot analysis for the indicated proteins. β-actin was used as a loading control.
Fig 11
Fig 11. Proposed model for B19V NS1-induced G2-phase arrest.
NS1 activates ATR through its TAD domain. Activated ATR then transduces signals to CDC25C through activating CHK1. CDC25C phosphatase activity is negatively regulated by phosphorylation at serine 216, which then creates a binding site for the 14-3-3 protein in the cytoplasm [41]. Thus, inactive CDC25C cannot dephosphorylate the cyclin B1/CDK1(pT14/Y15) complex; the latter component is inactive, and so progression from G2- to M-phase is blocked. It is proposed that DNA replication-induced DDR, and thereafter ATR/CHK1 activation, which plays a role in viral DNA replication, should not be involved in CDC25C phosphorylation (see the Discussion section for further explanation). The question mark indicates potential modification of CHK1, in addition to the phosphorylation at S345.

References

    1. Cotmore SF, Agbandje-McKenna M, Chiorini JA, Mukha DV, Pintel DJ, Qiu J, Söderlund-Venermo M, Tattersall P, Tijssen P, Gatherer D, Davison AJ (2014) The family Parvoviridae. Arch Virol 159: 1239–1247. 10.1007/s00705-013-1914-1 - DOI - PMC - PubMed
    1. Young NS, Brown KE (2004) Parvovirus B19. N Engl J Med 350: 586–597. 10.1056/NEJMra030840 - DOI - PubMed
    1. Brown KE, Young NS (1997) Parvovirus B19 in human disease. Annu Rev Med 48:59–67.: 59–67. 10.1146/annurev.med.48.1.59 - DOI - PubMed
    1. Gallinella G (2013) Parvovirus B19 Achievements and Challenges. ISRN Virology 10.5402/2013/898730. - DOI
    1. Young NS (1995) B19 parvovirus. Baillieres Clin Haematol 8: 25–56. - PubMed

Publication types

MeSH terms