. 2017 Mar 16;543(7645):391-396.
doi: 10.1038/nature21401. Epub 2017 Mar 6.

Molecular basis of ancestral vertebrate electroreception

Affiliations

Molecular basis of ancestral vertebrate electroreception

Nicholas W Bellono et al. Nature. .

Abstract

Elasmobranch fishes, including sharks, rays, and skates, use specialized electrosensory organs called ampullae of Lorenzini to detect extremely small changes in environmental electric fields. Electrosensory cells within these ampullae can discriminate and respond to minute changes in environmental voltage gradients through an unknown mechanism. Here we show that the voltage-gated calcium channel CaV1.3 and the big conductance calcium-activated potassium (BK) channel are preferentially expressed by electrosensory cells in little skate (Leucoraja erinacea) and functionally couple to mediate electrosensory cell membrane voltage oscillations, which are important for the detection of specific, weak electrical signals. Both channels exhibit unique properties compared with their mammalian orthologues that support electrosensory functions: structural adaptations in CaV1.3 mediate a low-voltage threshold for activation, and alterations in BK support specifically tuned voltage oscillations. These findings reveal a molecular basis of electroreception and demonstrate how discrete evolutionary changes in ion channel structure facilitate sensory adaptation.


Figures

Extended Data Figure 1
Extended Data Figure 1. CaV and K+ channel expression in little skate
a. CaV auxiliary subunit mRNA expression in skate ampullary organs, ampullary canals, skin, and liver. Bars represent fragments per kilobase of exon per million fragments mapped (FPKM). b. Ten most highly expressed K+ channel α subunit transcripts in ampullary organs.
Extended Data Figure 2
Extended Data Figure 2. Skate CaV ion selectivity and Ca2+-dependent inactivation
a – c. Representative currents measured from electrosensory cells (native ICaV, top), HEK293 expressing skate CaV1.3 (sCaV, middle), or HEK293 expressing rat CaV1.3 (rCaV, bottom) in the presence of 5 mM extracellular Ca2+, Ba2+, or Sr2+. At the end of a 200 ms voltage pulse eliciting maximal current, approximately 50% of current remained in native electrosensory cell ICav or HEK293 cells heterologously expressing sCaV1.3, whereas rCaV1.3 had only ~20% current remaining. In electrosensory cells, heterologous sCaV1.3, or rCaV1.3, the percentage of remaining current was significantly increased by substituting extracellular Ca2+ for Ba2+ or Sr2+ (p < 0.05, one-way ANOVA with post-hoc Bonferroni test). Data represented as mean relative current remaining at the end of the 200 ms voltage pulses that elicited maximal currents (± sem, n = 5 per condition).
Extended Data Figure 3
Extended Data Figure 3. Skate CaV pharmacology
a – b. Pharmacology of skate CaV1.3 (sCav). Representative currents recorded in responses to voltage pulses in the presence of vehicle (control, <0.1% DMSO) or 10 μM nifedipine or nimodipine. Currents were incompletely inhibited similar to native electrosensory cell ICav (Fig. 1e). Dose response relationships of current amplitudes measured at voltages that elicited maximal currents. Data are represented as mean ± sem, n = 6 per treatment. c – d. Pharmacology of rat CaV1.3 (rCaV). Representative currents in the presence of vehicle or 10 μM nifedipine or nimodipine and associated dose-response relationships. n = 6 per treatment.
Extended Data Figure 4
Extended Data Figure 4. Skate CaV gating current properties
a – c. Gating current properties including peak amplitude (peak I), time-to-peak (TTP), exponential decay time constant (τ decay), peak width at 50% of maximal gating current (width) for skate CaV1.3 (sCaV) versus rat CaV1.3 (rCaV, a, top), wild-type skate CaV1.3 (WT) versus charge-neutralized skate CaV1.3 (neutral, b, middle), and rat CaV1.3 with charged skate motif (charged) versus rat CaV1.3 with neutralized skate motif (neutral, c, bottom). All values were similar except for peak I for sCaV versus rCaV, likely representing increased expression for rCaV compared with sCaV. Data are presented as mean ± sem, n listed above bars. d. Wild-type skate CaV1.3 (sCaV, blue, n = 7) and wild-type rat CaV (rCaV, red, n = 8) relative conductance (G)-voltage (V) and ON-gating charge movement (QON)-V relationships. Data represented as mean ± sem. e. G-V and QON-V relationships for wild-type sCaV1.3 (WT, blue) and charge-neutralized sCaV1.3 (neutral, red) relative conductance (G)-voltage (V) and ON-gating charge movement (QON)-V relationships. Data represented as mean ± sem, n = 7 per condition. f. G-V and QON-V relationships for rCaV1.3 with charged skate motif (charged, blue) and rCaV1.3 with neutral skate motif (neutral, red). Data represented as mean ± sem, n = 8 per condition.
Extended Data Figure 5
Extended Data Figure 5. Charged skate motif modulates voltage-dependent activation kinetics
a. Activation kinetics were faster in charged-rCaV (blue, n = 6) compared with wild-type rCaV1.3 (WT-rCaV, grey, n = 7) or neutral-rCaV (red, n = 8). Data represent mean ± sem, p < 0.05 at all voltages for charged-rCaV versus WT-rCaV1.3 or neutral-rCaV, two-way ANOVA with post-hoc Bonferroni test. b. Representative currents recorded in response to 1 s voltage pulses between −170 and −90 followed by a pulse to −10 mV for 20 ms. Cole-Moore effects, indicated by increased current activation rate at −90 mV (purple) versus −170 (green), were observed in currents recorded from charged-rCaV, but not in neutral-rCaV motif. Scale bar: 50 pA, 10 ms. c. Cole-Moore effects quantified as the time to reach half maximal current (t1/2). With increasing voltage during prepulses, charged-rCaV (blue, n = 9) reached maximal current amplitude faster while WT-rCaV (grey, n = 6) and neutral-rCaV (red, n = 8) were unchanged. All data represented as mean ± sem, n ≥ 7, p < 0.05 for charged-rCaV t1/2 comparing −170 with −130, −110, or −90 mV, two-way ANOVA with post-hoc Bonferroni test). d. Hypothetical model depicting the intracellular charged motif in the domain IV voltage sensor of sCaV1.3 destabilizing the inactive state of the channel by electrostatic repulsion, pushing it into a partially activated or primed state (gold oval) prior to full activation (green ovals). Because sCaV1.3 is primed for activation, channel activation requires a smaller increase in voltage compared with rCaV1.3.
Extended Data Figure 6
Extended Data Figure 6. Skate BK properties
a. Currents measured in response to 0, 1, or 10 μM intracellular Ca2+ at 80 mV from patches expressing sBK or mBK. Scale bar: 10pA, 50ms. Average open probability (Po) for sBK compared with mBK was similar for all concentrations tested. Data represented as mean ± sem, n = 5. b. Representative single-channel records at various voltages from patches expressing indicated BK channels. Scale bar: 25pA, 20ms. c. Representative currents recorded at 80 mV from patches expressing indicated BK channels. The same patch was exposed to local K+ concentrations of 140 mM, 640 mM, or 3.14 M. Dashed lines indicate single-channel current amplitude for sBK at 140 mM (green), 640 mM (orange), or 3.14 M (red). Scale bar: 50pA, 20ms.
Extended Data Figure 7
Extended Data Figure 7. Adaptations in skate BK promote increased relative ICaV current during channel coupling
a. Whole-cell currents in response to 200 ms voltage pulses from −80mV to +80mV from HEK293 expressing sBK, sBK-SE, or mBK in the presence of 0 or 20 μM intracellular Ca2+. Scale bar: 5nA, 50ms b. Average I-V relationships for sBK (blue), sBK-SE (green) or mBK (red) in the presence of 0 or 20 μM intracellular Ca2+. n = 7. c. Whole-cell currents from HEK293 expressing charged-rCaV1.3 coexpressed with sBK, sBK-SE, or mBK. Scale bar: 500pA, 50ms. t = transient current evoked by voltage pulse, s = sustained current. In the presence of CaV1.3, average transient and sustained current-voltage relationships showed a negative shifted reversal potential (EREV) for sBK-SE (green) or mBK (red) compared with sBK (blue), indicating increased relative K+ permeability. d. Reversal potentials for transient and sustained currents evoked in cells coexpressing charged-rCaV1.3 and BK were affected by BK identity. Inset: transient currents mediated by coupling of CaV1.3 and BK (scale bar: 100pA, 5ms). Transient EREV: sBK = 32.96 ± 2.17, mBK = 8.43 ± 2.76, sBK-SE = 3.42 ± 2.38, p < 0.0001 for sBK versus mBK or sBK-SE. Sustained EREV: sBK = −17.00 ± 2.48, mBK = −50.95 ± 4.16, sBK-SE = −45.13 ± 4.59, p < 0.0001. n = 10. All data represented as mean ± sem and p values from two-tailed Student’s t-test.
Extended Data Figure 8
Extended Data Figure 8. BK agonist NS11021 modulates skate BK channels
a. In representative records from outside-out patches expressing sBK the BK agonist NS11021 (NS, 10 μM) increased the Po and open-state dwell time of sBK channels and this effect was blocked by iberotoxin (IbTx, 100 nM). Scale bar: 5pA, 100ms. Associated all-points histograms demonstrate the increase in open time. Po: basal = 0.0024 ± 0.00068, NS: 0.16 ± 0.041, NS + IbTx = 0.00036 ± 0.00025, p < 0.0001 for NS versus basal or NS + IbTx. Open dwell time: 0.62 ± 0.32, NS: 4.59 ± 0.34, NS + IbTx = 0.30 ± 0.010, p < 0.0001. n = 5. b. Whole-cell currents and average transient and sustained current-voltage relationships from HEK293 expressing charged-rCaV1.3 and sBK (scale bar: 500pA, 50ms). Transient and sustained current-voltage relationships made from normalizing currents in the presence of NS to basal currents show an increase in CaV1.3-activated sBK current amplitude and negative-shifted EREV in response to 10 μM NS. Transient EREV: basal = 20.71 ± 3.46, +NS = −0.72 ± 0.94, p < 0.01. Sustained EREV: basal = −24.62 ± 0.61, NS = −47.21 ± 5.37, p < 0.05. n = 5. c. Representative currents recorded from an electrosensory cell show that 10 μM NS increases ICav-activated IK amplitude resulting in a decrease in relative ICav current (scale bars: 100pA, 50ms). d. Transient and sustained current-voltage relationships from normalizing currents in the presence of NS to basal currents. I-V relationships demonstrate an NS-mediated negative shift in EREV, indicating increased K+ permeability. Transient EREV: basal = −6.15 ± 5.95, +NS = −24.9 ± 8.23, p < 0.01. Sustained EREV: basal = −7.59 ± 6.02, NS = −26.65 ± 1.06, p < 0.05. n = 4. All data represented as mean ± sem and p values from two-tailed Student’s t-test.
Extended Data Figure 9
Extended Data Figure 9. Ca2+-handling proteins are enriched in Ampullae of Lorenzini
a. Top 4 highest expressed transcripts in ampullae. The Ca2+-binding protein (CBP) parvalbumin 8 is the highest expressed and is enriched in ampullae compared with other examined tissues. Bars represent fragments per kilobase of exon per million fragments mapped (FPKM). b. Top 4 highest expressed ATPase transcripts in ampullae. Notably, the plasma membrane Ca2+ ATPase 1a is highly expressed and is enriched in ampullae. c. Proposed mechanism for electrosensory cell Vm oscillations. sCaV1.3 is activated by low threshold electrical signals to depolarize the cell and mediate Ca2+ influx. Ca2+ stimulates sBK-mediated K+ current to hyperpolarize the cell. Ca2+-binding proteins (CBP) bind incoming Ca2+ to inhibit BK-mediated hyperpolarization and continue sCaV1.3-driven oscillations.
Extended Data Figure 10
Extended Data Figure 10. Behavioral paradigm for pharmacologically-treated skates and startle response-related control
a. Schematic drawing of electrical stimulus. A 9V battery was used to generate a dipole DC stimulus through two independent leads placed into Tygon rubber tubing filled with seawater (left). The ends of these tubes were threaded through an acrylic plate to 4 different equally spaced locations on the base of the behavioral observation tank which were then obscured by sand (right). b. Following 30 minutes of free exploration, control and pharmacologically-treated skates were gently tapped upon the pectoral fin. The average distance moved during the startle response is represented as mean ± sem; n=10. Differences were not significant according to a two-way ANOVA with post-hoc Tukey’s test. c. Schematic drawing traced from typical example of skate startle response following pectoral fin stimulation (red arrow). The distance covered during the startle response was measured from the initial location (left) to the final location where the body axis became straight again (right), and the distance from the center between the eyes from each respective position was recorded (dotted yellow line).
Figure 1
Figure 1. CaV1.3 and BK channels mediate the major cation currents in electrosensory cells
a. Dorsal profile of little skate (Leucoraja erinacea). b. Alcian Blue-stained ampullary organ canals on the ventral surface of a juvenile skate. c. Isolated ampullary organs with short lengths of canal and attached afferent nerve fibers (scale bar: 400 μm). d. Electrosensory cells in a representative patch-clamp experiment (scale bar: 5 μm). e. (Left) Representative ICav traces: green and blue traces show current elicited by −55 and −45 mV pulse, respectively. (Right) Average current-voltage (I-V) relationship, n = 11. Scale bar: 20 pA/pF vertical, 100 ms horizontal. f. Pharmacological profile of ICav. Channel subtype drug selectivity is indicated above bars. Each circle depicts one experiment; bars represent mean ± sem measured at peak amplitude; p < 0.05 for L-type channel modulators, one-way ANOVA with post-hoc Bonferroni test. g. Conductance-voltage (G-V) relationship with half-maximal activation voltage (Va1/2) of −52 ± 0.8 mV with slope factor (Ka) = 4.8 ± 0.6 mV. Inactivation-voltage relationship with half-inactivation potential (Vh1/2) of −55.9 ± 1.7 mV with slope factor (Ki) of −6.3 ± 1.6 mV. Window current was observed between −70 and −30 mV and peaks at ~-58 mV with ~40% maximal conductance. Data represented as mean ± sem, n = 10. h. Representative K+ currents. Scale bar: 20 pA/pF, 100 ms. i. Pharmacological profile of IK. Each circle depicts one experiment and bars represent mean ± sem measured at peak amplitude, p < 0.001 for control versus treatments, one-way ANOVA with post-hoc Bonferroni test. j. (Left) Cav α subunit mRNA expression in skate ampullary organs, ampullary canals, skin, and liver. (Right) Expressed Ca2+-activated K+ channel α subunits in ampullary organs. Bars represent fragments per kilobase of exon per million fragments mapped (FPKM). k. Co-localization of CaV1.3 (red) and BK (green) transcripts within electrosensory cells of ampullary organs visualized by in situ hybridization histochemistry. Nuclei were stained with DAPI (blue) Scale bar: 10 μm.
Figure 2
Figure 2. Skate CaV has a low voltage threshold
a. Representative voltage-activated currents recorded in HEK293 expressing skate CaV1.3 (sCaV, blue) or the homologous long isoform of rat CaV1.3 (rCaV, red). Scale bar: 200 pA, 50 ms. b. Normalized I-V relationship from sCaV (blue) and rCaV (red). n = 7. c. sCaV (blue) and rCaV (red) G-V (n = 8) and inactivation (n =7) curves. d. Average Va1/2 for sCaV (−42.68 ± 0.56, n = 8) compared with rCaV (−18.16 ± 0.51, n = 7, p < 0.0001). Vh1/2 was similar, n = 7. e. Ionic (left) and gating (right) currents from representative cells expressing sCaV or rCaV. Scale bar for sCaV: 100 pA, 50 ms; rCaV: 200 pA, 50 ms. Inset: enlarged ON-gating currents. Scale bar: 50 pA, 3 ms. f. Relationship of relative conductance (G / Gmax, y-axis) and charge movement (QON / QONmax, x-axis) for sCaV (blue, n = 7) and rCaV (red, n = 8). p < 0.0001 for difference in QON required for half maximal conductance (dashed line). g. Maximal tail current (Itail) versus maximal gating charge (QON,max). Slopes: 2.23 ± 0.20 for sCav (blue, n = 8), 0.79 ± 0.06 for rCav (red, n = 9). Inset: representative ON-gating currents and Itail elicited by a voltage step to reversal potential (EREV) from and returning to −100 mV. Scale bar: 100 pA, 50 ms. All data represented as mean ± sem, All p values from two-tailed Student’s t-test.
Figure 3
Figure 3. Positively charged motif confers skate CaV voltage threshold
a. Predicted topology of CaV1.3 α1 subunit. Species alignment reveals a positively charged insert in DIVS2-S3 of the skate orthologue. Charge-neutralized skate CaV1.3 (neutral-sCaV) was generated by replacing charged residues (KKKER) of the skate motif with glutamines (QQQQQ). b. Representative currents from HEK293 expressing wild-type skate CaV1.3 (WT-sCaV, blue) or neutral-sCaV (red). Scale bar: 100 pA, 50 ms. c. I-V relationships for WT-sCaV (blue) and neutral-sCaV (red). n = 7 per condition. Va1/2 from WT-sCaV (−37.24 ± 0.32 mV) compared with neutral-sCaV (−25.99 ± 0.92 mV), n = 7 per condition, p < 0.0001). d. G-QON relationship comparing neutral-sCaV (red) with WT-sCaV (blue).n = 7 per condition, p < 0.0001 for difference in QON required for half maximal conductance (dashed line). e. Itail versus QON,max. Slopes: 1.92 ± 0.15 for WT-sCaV (blue, n = 9), 0.66 ± 0.16 for neutral-sCaV (red, n = 7). Inset: representative maximal ON-gating currents and Itail. Scale bar: 100 pA, 50 ms. f. Representative currents from HEK293 expressing rCaV1.3 with the charged skate motif (charged-rCaV) or rCaV1.3 with a neutralized skate motif insert (neutral-rCaV). Scale bar: 100 pA, 50 ms. g. I-V relationships for charged-rCaV (blue) and neutral-rCaV (red). n = 9 per condition. Va1/2 from charged-rCaV (−37.24 ± 0.32 mV) compared with neutral-rCaV (−19.6 ± 0.32 mV), n = 9 per condition, p < 0.0001. h. G-QON relationship comparing charged-rCaV (blue, n = 9) and neutral-rCaV (red, n = 8). p < 0.0001 for difference in QON required for half maximal conductance (dashed line). i. Itail versus QON,max. Slopes: 2.45 ± 0.19 for charged-rCaV (blue), 1.19 ± 0.04 for neutral-rCaV (red). n = 9 per condition. Inset: representative maximal ON-gating currents and Itail. Scale bar: 100 pA, 50 ms. All data represented as mean ± sem, All p values from two-tailed Student’s t-test.
Figure 4
Figure 4. Skate BK has a small conductance and short open time
a. Representative sBK and mBK single-channel currents recorded at the indicated membrane voltages from excised patches from transfected HEK293 cells. Scale bar: 25pA vertical, 50ms horizontal. Average I-V relationship from sBK (blue) and mBK (red). n = 10 patches per condition, p < 0.0001 for difference in amplitude at each voltage. b. Representative sBK or mBK single-channel kinetics recorded at 80mV. Scale bar: 10pA, 1ms. Inset: longer traces from same experiment (scale bar: 10pA, 50ms). Histograms of channel open times from 60s records fitted with a single-exponential to calculate open-state dwell time constants (sBK = 1.09 ± 0.02 ms, mBK = 5.06 ± 0.07 ms, n = 5, p <0.0001). All p values from two-tailed Student’s t-test.
Figure 5
Figure 5. Intracellular electrostatic adaptations in the pore of skate BK
a. (Left) Species alignment of skate BK α subunit (kcnma1) reveals differences in charged residues. (Right) Net charge in this region determines local K+ concentration and conductance of BK. b. Representative single-channel records from patches at 120 mV expressing the indicated BK channels. Scale bar: 25pA, 20ms. c. Average I-V relationship. Slope conductances: WT sBK (blue) = 104 ± 5.4 pS, sR340S (purple) = 200 ± 9.9 pS, sA347E (teal) = 115 ± 5.4 pS, sBK-SE (green) = 287 ± 14 pS, mBK (red) = 263 ± 15 pS, mBK-RA (orange) = 97 ± 3.6 pS. n = 5. d. WT sBK and mBK-RA have significantly shorter open-state dwell times than all other BK channels tested (at 80 mV). p < 0.001, one-way ANOVA with post-hoc Tukey’s test, n = 7. e. Average single-channel amplitudes in response to changes in intracellular K+ concentration. n = 5. Dashed lines indicate single-channel current amplitude for sBK at 140 mM (bottom), 640 mM (middle), or 3.14 M (top). All data represented as mean ± sem,
Figure 6
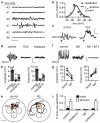
Figure 6. ICav and IK tune voltage oscillations and electroreceptive behaviors
a. Representative traces showing membrane voltage-dependent oscillations at indicated membrane potentials (Vm). Scale: 5 mV, 500 ms. b. Normalized amplitude of membrane voltage oscillations (from rest, averaged over 500 ms) at indicated Vm (n = 4). Overlaid normalized ICav window current (blue trace). c. Current injection (10 pA, 5 ms at arrow) at −65 mV elicited oscillations or a sustained depolarization in the presence of TEA+ (representative of n = 3). Scale bar: 5 mV, 100 ms. d. Representative Vm oscillations were inhibited by TEA+ or nifedipine. Scale bar: 5 mV, 100 ms. e. Average oscillation amplitude and frequency. Each circle depicts one experiment; p < 0.001, one-way ANOVA with post-hoc Tukey’s test. f. Vm oscillations in response to NS11021 (NS) or NS + IbTx. Scale bar: 10mV, 250ms. g. Average Vm oscillation amplitude and frequency. n = 4, p < 0.01 for amplitude, p < 0.05 for frequency, paired two-tailed Student’s t-test. h. Top down view of control (left) and NS11021-treated (NS, right) skates orienting towards a submerged electrical stimulus. Bolded line depicts movement from start time to end during 30 min trials. Scale bar: 5 cm. i. Normalized percent time spent in area of submerged electrode for control, nifedipine, NS, and mibefradil-treated skates during basal condition or in the presence of an electrical stimulus. n = 10 trials for all conditions, p < 0.001 for control stimulus versus basal, p < 0.01 for control stimulus versus all treatments except mibefradil, two-way ANOVA with post-hoc Tukey’s test. All data represented as mean ± sem.

Comment in

Similar articles

Cited by

References

    1. Kalmijn AJ. The electric sense of sharks and rays. The Journal of Experimental Biology. 1971;55:371–383. - PubMed
    1. Kalmijn AJ. Electric and magnetic field detection in elasmobranch fishes. Science. 1982;218:916–918. - PubMed
    1. Lissmann HW, Machin KE. The mechanism of object location in Gymnarchus niloticus and similar fish. Journal of Experimental Biology. 1958;35:451–486.
    1. Munz H, Claas B, Fritzsch B. Electroreceptive and mechanoreceptive units in the lateral line of the axolotl Ambystoma mexicanum. J Comp Physiol. 1984;154:33–44.
    1. Scheich H, Langner G, Tidemann C, Coles RB, Guppy A. Electroreception and electrolocation in platypus. Nature. 1986;319:401–402. - PubMed

Publication types