

Metabolic Effects of Replacing Sugar-Sweetened Beverages with Artificially-Sweetened Beverages in Overweight Subjects with or without Hepatic Steatosis: A Randomized Control Clinical Trial
- PMID: 28264429
- PMCID: PMC5372865
- DOI: 10.3390/nu9030202
Metabolic Effects of Replacing Sugar-Sweetened Beverages with Artificially-Sweetened Beverages in Overweight Subjects with or without Hepatic Steatosis: A Randomized Control Clinical Trial
Abstract
Objective: Addition of fructose to the diet of normal weight and overweight subjects can increase postprandial plasma triglyceride and uric acid concentration. We, therefore, assessed whether replacing sugar-sweetened beverages (SSB) with artificially-sweetened beverages (ASB) in the diet of overweight and obese subjects would decrease these parameters.
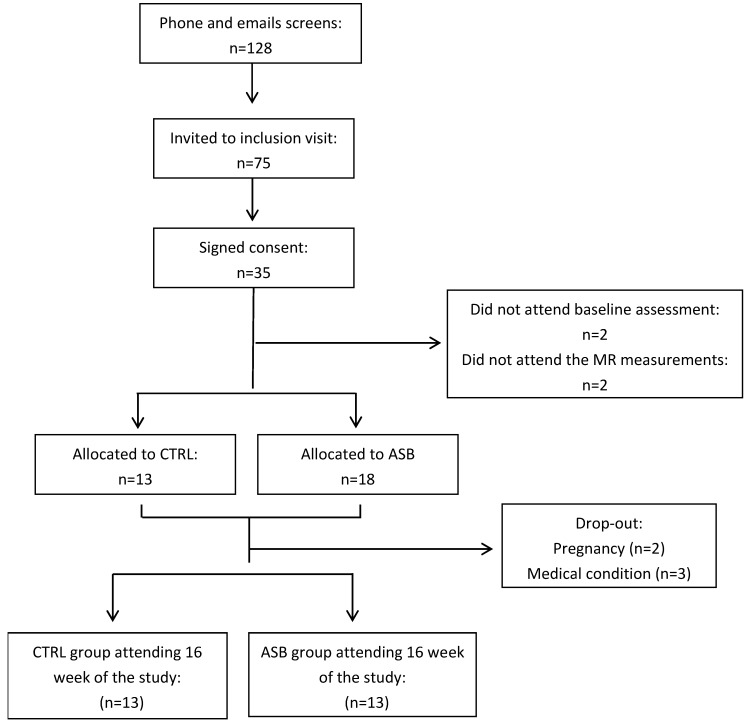
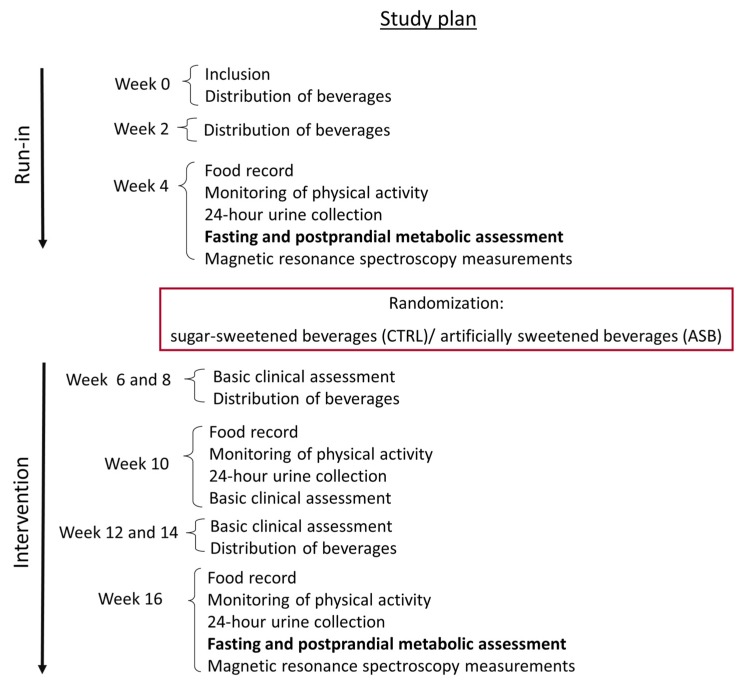
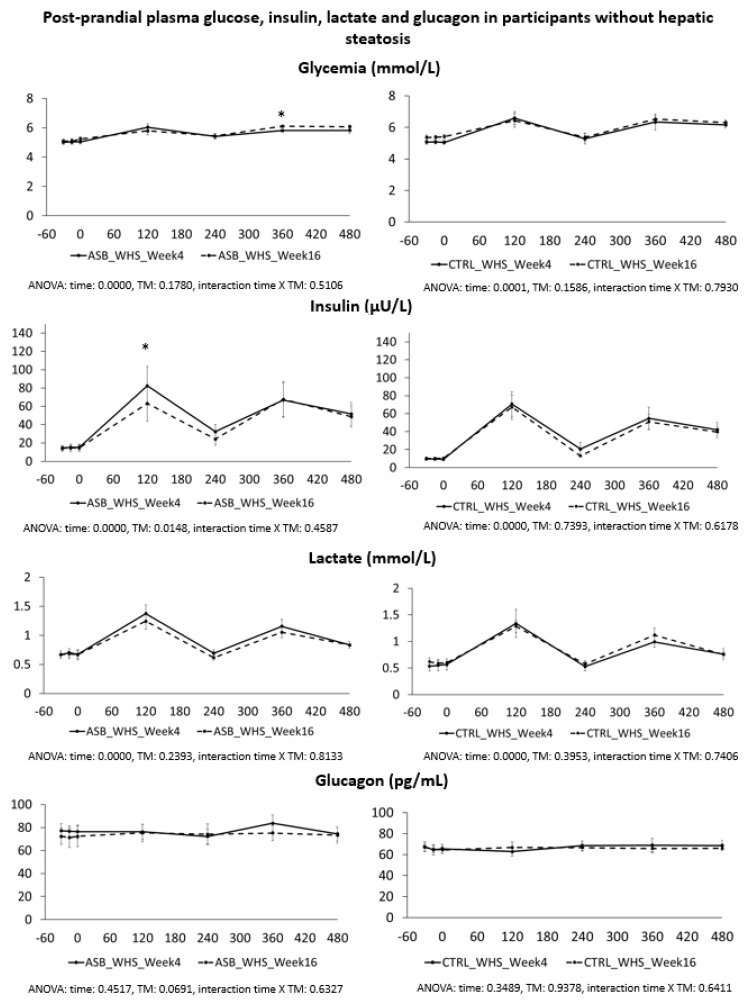
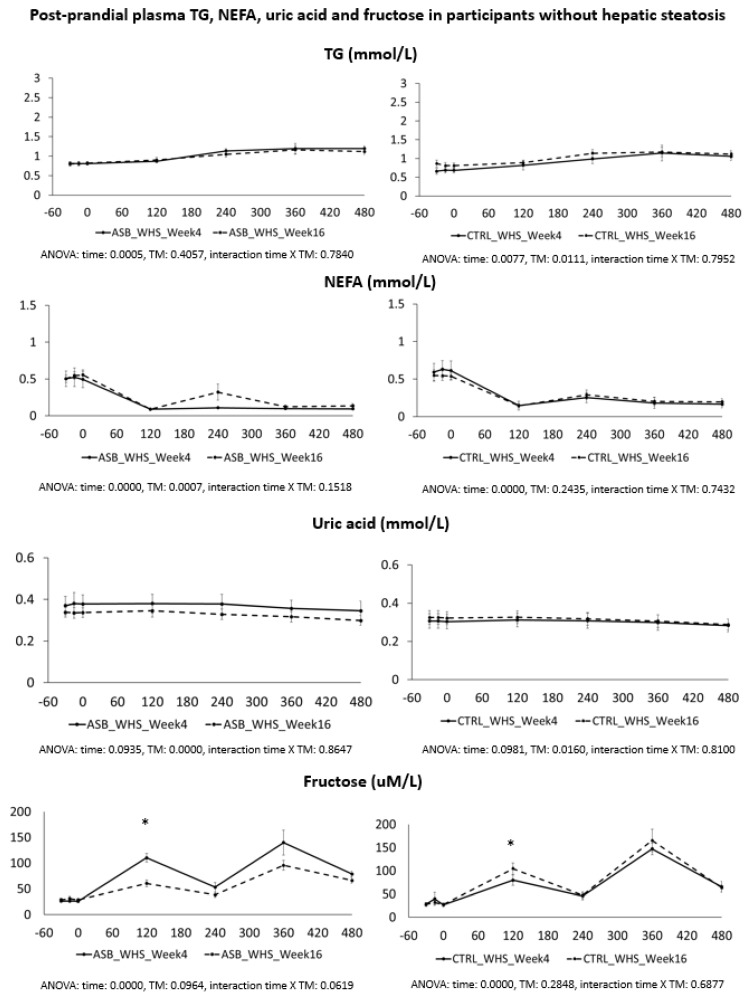
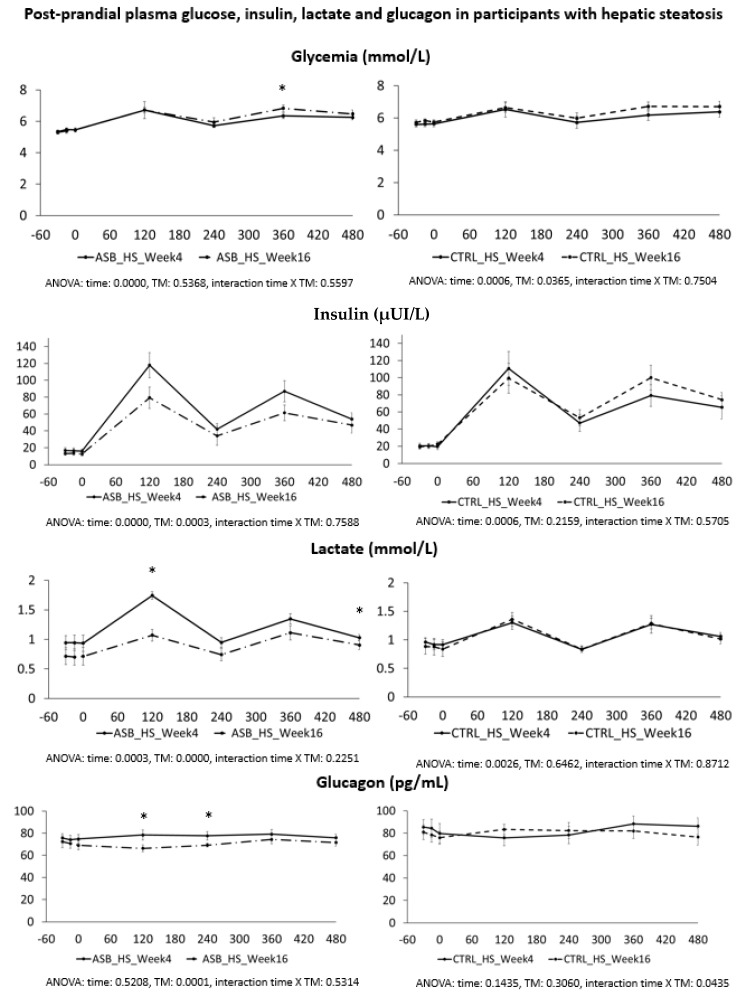
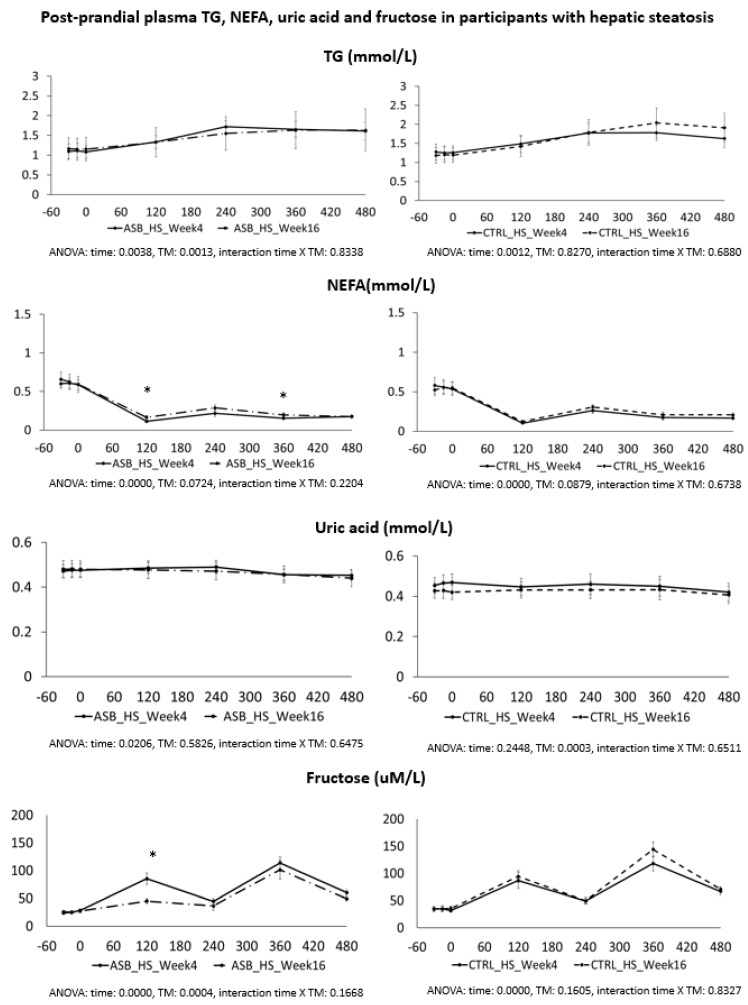
Methods: Twenty-six participants of the REDUCS study, which assessed the effects of replacing SSB by ASB over 12 weeks on intra-hepatocellular lipid concentration, were included in this sub-analysis. All were studied after a four-week run-in period during which they consumed their usual diet and SSBs, and after a 12-week intervention in which they were randomly assigned to replace their SSBs with ASBs (ASB arm) or to continue their usual diet and SSBs (control arm, CTRL). At the end of run-in (week 4) and again at the end of intervention (week 16), they took part in an 8.5 h metabolic investigation during which their plasma glucose, insulin, glucagon, lactate, triglyceride (TG), non-esterified fatty acids (NEFA), and uric acid concentrations were measured over a 30 min fasting period (-30-0 min), then every 2 h over 480 min. with ingestion of standard breakfast at time 0 min and a standard lunch at time 240 min. Breakfast and lunch were consumed together with a 3.3 dL SSB at week 4 and with either an ASB (ASB arm) or a SSB (CTRL arm) at week 16. After analyzing the whole group, a secondary analysis was performed on 14 subjects with hepatic steatosis (seven randomized to ASB, seven to CTRL) and 12 subjects without hepatic steatosis (six randomized to ASB and six to CTRL).
Results: Ingestion of meals increased plasma glucose, insulin, glucagon, lactate, and TG concentrations and decreased NEFA concentrations, but with no significant difference of integrated postprandial responses between week 4 and week 16 in both ASB and CTRL, except for a slightly decreased glucagon response in ASB. There was, however, no significant postprandial increase in uric acid concentration in both arms. In the secondary analysis, replacing SSBs with ASBs did not significantly change postprandial TG and uric acid concentrations irrespective of the presence or not of hepatic steatosis, Conclusions: In overweight, high SSB consumers, replacing SSBs with ASBs during 12 weeks did not significantly alter post-prandial TG and uric acid concentration, in spite of the lower energy and fructose content of the meals. These effects were globally the same in subjects without and with hepatic steatosis.
Keywords: cardiovascular risk factors; fructose; hypertriglyceridemia; intrahepatocellular lipid concentration.
Conflict of interest statement
L.T. received speaker’s honoraria from Ferrero, Italy, the Gatorade Sport Science Institute, USA, and C3 collaborating for health, UK. The other authors have no conflict of interest to disclose.
Figures
References
-
- Bray G., Nielsen S., Popkin B. Consumption of high-fructose corn syrup in beverages may play a role in the epidemic of obesity. Am. J. Clin. Nutr. 2004;79:737–743. - PubMed
-
- Chiu S., Sievenpiper J.L., de Souza R.J., Cozma A.I., Mirrahimi A., Carleton A.J., Ha V., Di Buono M., Jenkins A.L., Leiter L.A., et al. Effect of fructose on markers of non-alcoholic fatty liver disease (NAFLD): A systematic review and meta-analysis of controlled feeding trials. Eur. J. Clin. Nutr. 2014;68:416–423. doi: 10.1038/ejcn.2014.8. - DOI - PMC - PubMed
Publication types
MeSH terms
Substances
LinkOut - more resources
Full Text Sources
Other Literature Sources
Medical
Miscellaneous
