. 2017 Feb 27;9(3):207.
doi: 10.3390/nu9030207.

Equol, a Dietary Daidzein Gut Metabolite Attenuates Microglial Activation and Potentiates Neuroprotection In Vitro

Affiliations

Equol, a Dietary Daidzein Gut Metabolite Attenuates Microglial Activation and Potentiates Neuroprotection In Vitro

Lalita Subedi et al. Nutrients. .

Abstract

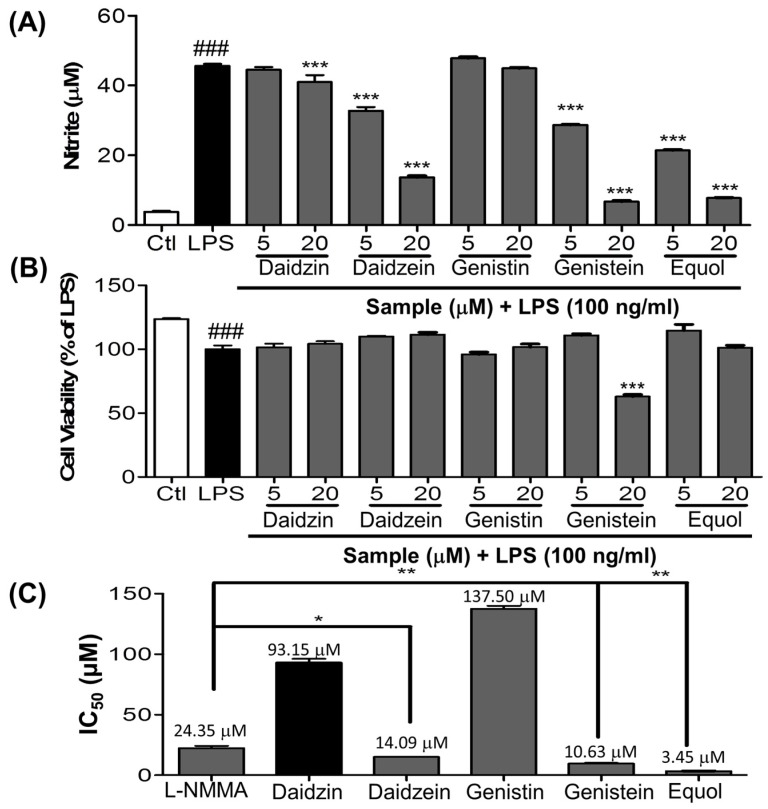
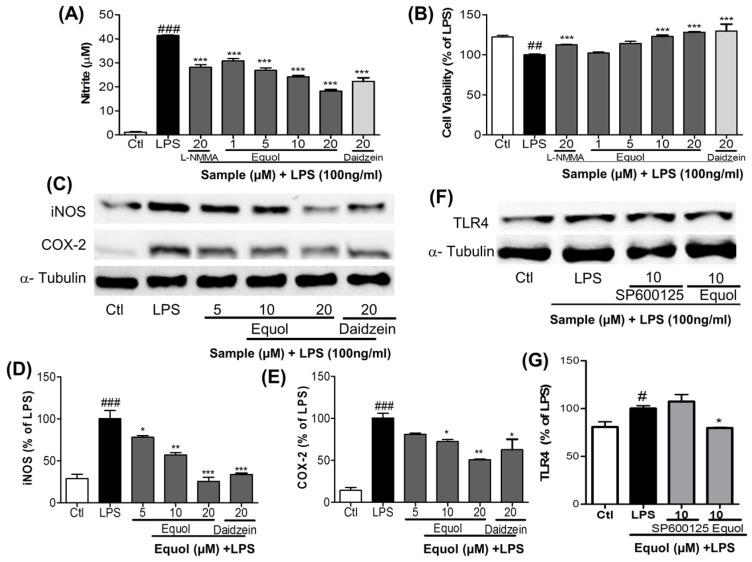
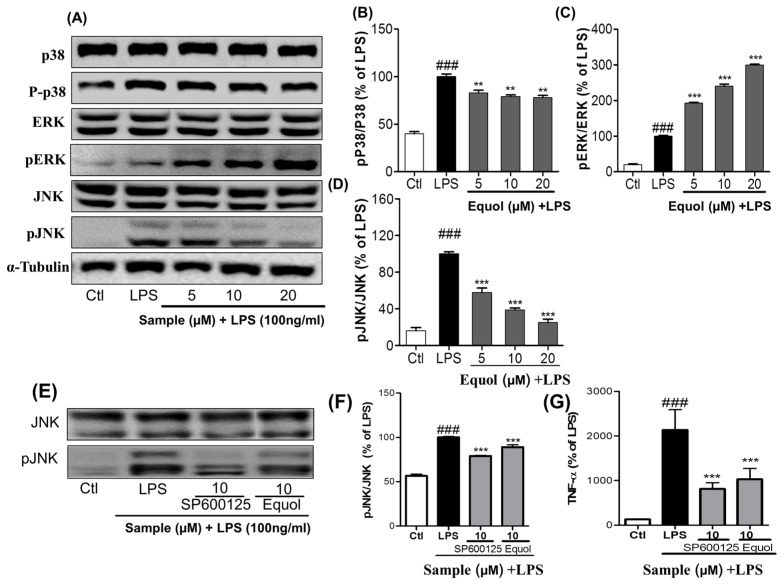
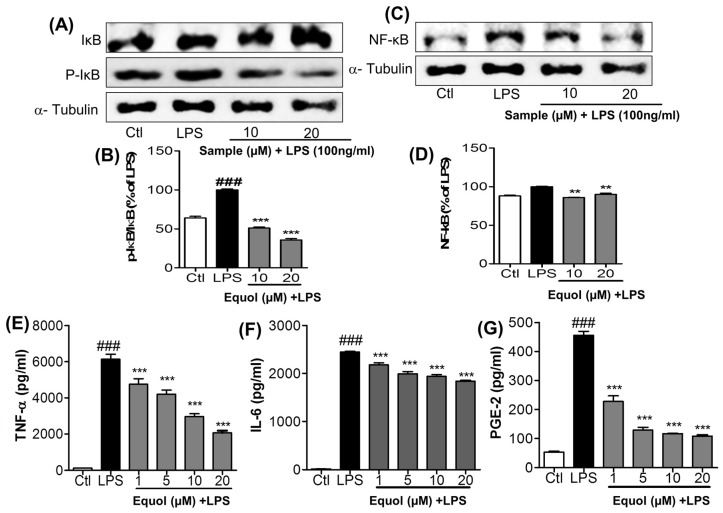
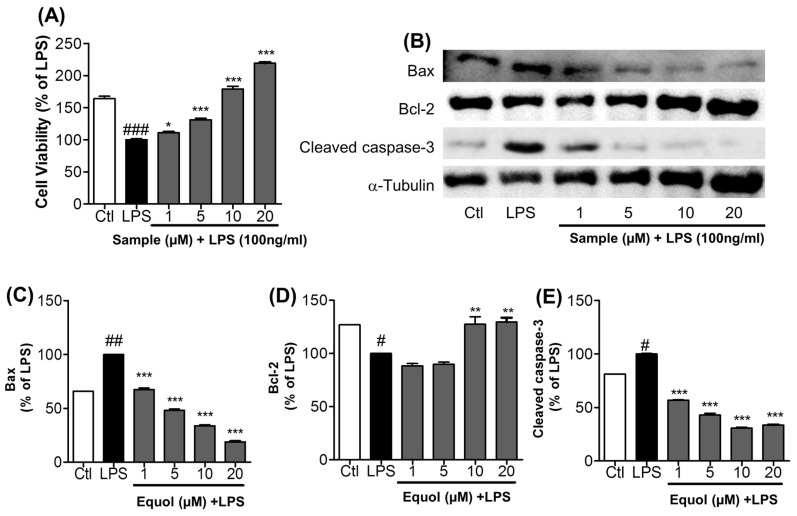
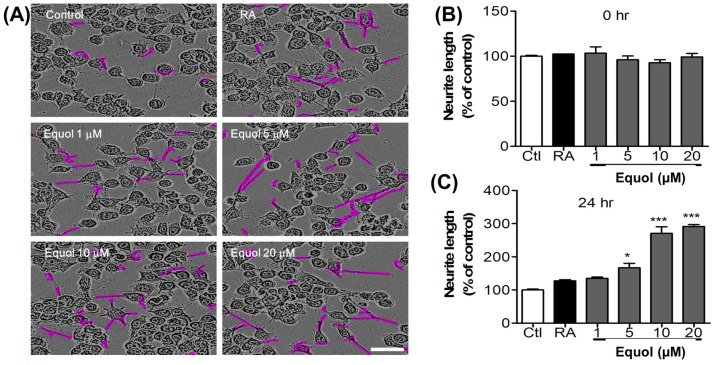
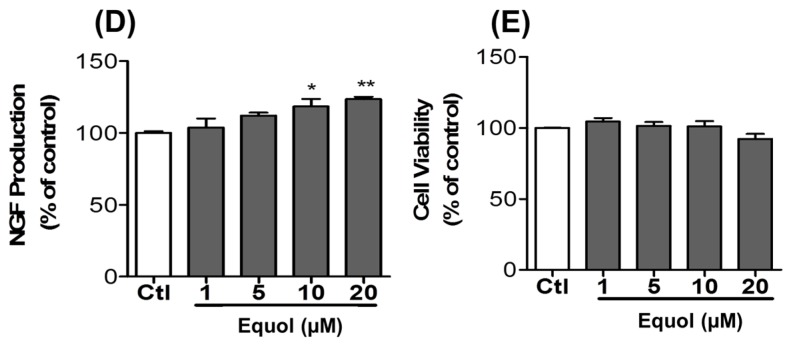
Estrogen deficiency has been well characterized in inflammatory disorders including neuroinflammation. Daidzein, a dietary alternative phytoestrogen found in soy (Glycine max) as primary isoflavones, possess anti-inflammatory activity, but the effect of its active metabolite Equol (7-hydroxy-3-(4'-hydroxyphenyl)-chroman) has not been well established. In this study, we investigated the anti-neuroinflammatory and neuroprotective effect of Equol in vitro. To evaluate the potential effects of Equol, three major types of central nervous system (CNS) cells, including microglia (BV-2), astrocytes (C6), and neurons (N2a), were used. Effects of Equol on the expression of inducible nitric oxide synthase (iNOS), cyclooxygenase (COX-2), Mitogen activated protein kinase (MAPK) signaling proteins, and apoptosis-related proteins were measured by western blot analysis. Equol inhibited the lipopolysaccharide (LPS)-induced TLR4 activation, MAPK activation, NF-kB-mediated transcription of inflammatory mediators, production of nitric oxide (NO), release of prostaglandin E2 (PGE-2), secretion of tumor necrosis factor-α (TNF-α) and interleukin 6 (IL-6), in Lipopolysaccharide (LPS)-activated murine microglia cells. Additionally, Equol protects neurons from neuroinflammatory injury mediated by LPS-activated microglia through downregulation of neuronal apoptosis, increased neurite outgrowth in N2a cell and neurotrophins like nerve growth factor (NGF) production through astrocytes further supporting its neuroprotective potential. These findings provide novel insight into the anti-neuroinflammatory effects of Equol on microglial cells, which may have clinical significance in cases of neurodegeneration.

Keywords: Equol; apoptosis; neuroinflammation; neuroprotection; phytoestrogen.


Conflict of interest statement

The authors declare no conflict of interest.

Figures

Figure 1
Figure 1
Effects of Equol and its derivatives on NO production in LPS-stimulated BV-2 cells. BV-2 cells were pretreated with 5, and 20 μM of Equol and its derivatives for 30 min and stimulated with LPS (100 ng/mL) for 24 h. (A) NO Production Assay; (B) Cell viability on BV-2 microglia was determined using an MTT assay; (C) IC50 value graph for Equol and its derivatives. All data are presented as the mean ± SEM of three independent experiments. * p < 0.05, ** p < 0.01 and *** p < 0.001 vs. LPS-treated group and ### p < 0.001 vs. untreated control group.
Figure 2
Figure 2
Effect of Equol on NO production, cell viability, and expression of iNOS, COX-2 and TLR4 expression in LPS-stimulated BV-2 cells. BV-2 cells were pretreated with various concentrations of Equol (μM) for 30 min, followed by treatment with LPS (100 ng/mL) for an additional 24 h to measure NO and MTT. 6 h treatment and LPS activation was used to measure iNOS and COX-2 expression via western blot analysis. (A) NO production measurement in LPS stimulated BV-2 cells. NMMA (20 μM) was used as a positive control; (B) Cell viability of BV-2 microglia following treatment with compounds with or without LPS; (C) Expression of iNOS and COX-2 in murine microglia; (D,E) Densitometric analysis of iNOS and COX-2 proteins; (F) Activation of TLR4 expression (G) Densitometric analysis for TLR4. α-Tubulin was used as the loading control. All data are presented as the mean ± SEM of three independent experiments. * p < 0.05, ** p < 0.01, *** p < 0.001 vs. LPS-treated group and # p < 0.05, ## p < 0.01, ### p < 0.001 vs. untreated control group.
Figure 3
Figure 3
Effect of Equol on LPS-induced MAPK signaling in BV-2 cells. BV-2 cells were pretreated with or without Equol (μM) 30 min prior to LPS (100 ng/mL) stimulation. Activated cells were incubated for 30 min. (A) expression of pP38, P38, pJNK, JNK, and pERK, ERK; (BD) Band intensities for pP38/P38, pERK/ERK, and pJNK/JNK as percentage of the LPS-treated group (set as 100%); (E) Phosphorylation of JNK to compare between Equol and SP600125 (F) Band intensities for pJNK/JNK (G) Secretion of TNF-α in 24 h LPS and compounds (Equol and SP600125) treated supernatant was measured using ELISA assay kit. SP600125 (JNK inhibitor) was used to compare the effect of Equol. All data are presented as the mean ± SEM of three independent experiments. ** p < 0.01, *** p < 0.001 vs. LPS-treated group and ### p < 0.001 vs. untreated control group.
Figure 4
Figure 4
Effect of Equol on LPS-induced NF-κB activation and pro-inflammatory cytokines (TNF-α, IL-6) and PGE-2 secretion in BV-2 cells. BV-2 microglial cells were pretreated with 1, 5, 10, or 20 μM of Equol for 30 min and stimulated with LPS (100 ng/mL) for 1 h for NF-κB related proteins and 24 h for secreted cytokines measurement. Nuclear extracts were prepared using a nuclear extraction kit. Expression of NF-κB, IκB, and p-IκB were measured by western blot. (A,B) Protein levels of IκB and p-IκB and their band intensity, respectively; (C,D) NF-κB expression and its densitometric analysis. α-Tubulin was used as the loading control. The culture media was subsequently collected to measure the quantity of PGE-2, TNF-α, and IL-6 released by the cells; (EG) secretion of TNF-α, IL-6 and PGE-2 in supernatant was measured using ELISA assay kit. Data are presented as mean ± SEM of three independent experiments performed in triplicate. ** p < 0.01, *** p < 0.001 vs. LPS-treated group and ### p < 0.001 vs. untreated control group.
Figure 5
Figure 5
Effect of Equol on activated microglia-induced neurotoxicity in N2a cells. BV-2 microglial cells were pretreated with 1, 5, 10, or 20 μM of Equol for 30 min and stimulated with LPS (100 ng/mL) for 24 h. After 24 h of LPS treatment, the culture medium was collected and transferred to dishes plated with N2a cells. (A) Cell viability in N2a cells after 24 h treatment of LPS activated microglia treated media. Cell lysates were prepared in order to evaluate protein levels of apoptosis-related factors; (B) The expression of Bax, Bcl-2 and cleaved caspase-3 (CE) Band intensity for above mentioned proteins respectively. α-Tubulin was used as the loading control. Data represent the mean ± SEM of three independent experiments performed in triplicate. * p < 0.05, ** p < 0.01, *** p < 0.001 vs. LPS-treated group and # p < 0.05, ## p < 0.01, ### p < 0.001 vs. untreated control group.
Figure 6
Figure 6
Effect of Equol on neurite outgrowth production in N2a cells and NGF production in C6 cells for neuroprotection. Neurite length in N2a cells was measured at regular intervals over a time span of 24 h after Equol (1, 5, 10, and 20 μM) treatment and images of cells were taken at the end of 24 h. (A) Neuronal cell morphology during treatment; Neurite outgrowth is shown in pink (scale bar = 50 μM) (B) Neurite length prior to treatment; (C) Neurite length after 24 h of treatment. Retinoic acid (10 μM) treatment was used as a positive control to stimulate neurite outgrowth. Retinoic Acid (RA) was used as a positive control. C6 cells were treated with Equol at concentrations of 1, 5, 10, and 20 μM, respectively. After 24 h, the amount of NGF produced by C6 cells was measured by ELISA; (D) NGF production in C6 glioma cells; (E) Cell viability of C6 cells during NGF production after 24 h of compound treatment. The data shown represent the mean ± SEM of three independent experiments performed in triplicate. * p < 0.05, ** p < 0.01, *** p < 0.001 vs. untreated control group.
Figure 6
Figure 6
Effect of Equol on neurite outgrowth production in N2a cells and NGF production in C6 cells for neuroprotection. Neurite length in N2a cells was measured at regular intervals over a time span of 24 h after Equol (1, 5, 10, and 20 μM) treatment and images of cells were taken at the end of 24 h. (A) Neuronal cell morphology during treatment; Neurite outgrowth is shown in pink (scale bar = 50 μM) (B) Neurite length prior to treatment; (C) Neurite length after 24 h of treatment. Retinoic acid (10 μM) treatment was used as a positive control to stimulate neurite outgrowth. Retinoic Acid (RA) was used as a positive control. C6 cells were treated with Equol at concentrations of 1, 5, 10, and 20 μM, respectively. After 24 h, the amount of NGF produced by C6 cells was measured by ELISA; (D) NGF production in C6 glioma cells; (E) Cell viability of C6 cells during NGF production after 24 h of compound treatment. The data shown represent the mean ± SEM of three independent experiments performed in triplicate. * p < 0.05, ** p < 0.01, *** p < 0.001 vs. untreated control group.

References

    1. Ullah M.F., Bhat S.H., Husain E., Abu-Duhier F., Hadi S.M., Sarkar F.H., Ahmad A. Pharmacological Intervention through Dietary Nutraceuticals in Gastrointestinal Neoplasia. Crit. Rev. Food Sci. Nutr. 2016;56:1501–1518. doi: 10.1080/10408398.2013.772091. - DOI - PubMed
    1. Fura A. Role of pharmacologically active metabolites in drug discovery and development. Drug Discov. Today. 2006;11:133–142. doi: 10.1016/S1359-6446(05)03681-0. - DOI - PubMed
    1. Howes M.J., Perry E. The role of phytochemicals in the treatment and prevention of dementia. Drugs Aging. 2011;28:439–468. doi: 10.2165/11591310-000000000-00000. - DOI - PubMed
    1. Ding Y., Zhou X., Zuo L., Wang H., Yu D. Identification and functional characterization of the sulfate transporter gene GmSULTR1;2b in soybean. BMC Genom. 2016;17:373. doi: 10.1186/s12864-016-2705-3. - DOI - PMC - PubMed
    1. Patisaul H.B., Jefferson W. The pros and cons of phytoestrogens. Front. Neuroendocrinol. 2010;31:400–419. doi: 10.1016/j.yfrne.2010.03.003. - DOI - PMC - PubMed

MeSH terms