

Rapid Sampling of Escherichia coli After Changing Oxygen Conditions Reveals Transcriptional Dynamics
- PMID: 28264512
- PMCID: PMC5368694
- DOI: 10.3390/genes8030090
Rapid Sampling of Escherichia coli After Changing Oxygen Conditions Reveals Transcriptional Dynamics
Abstract
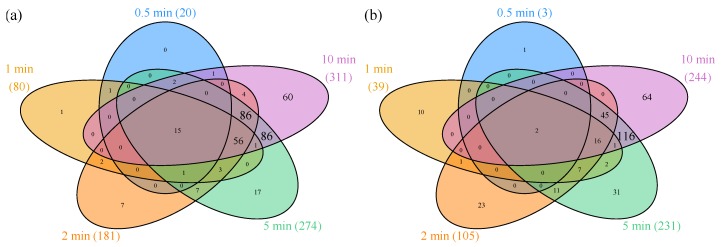
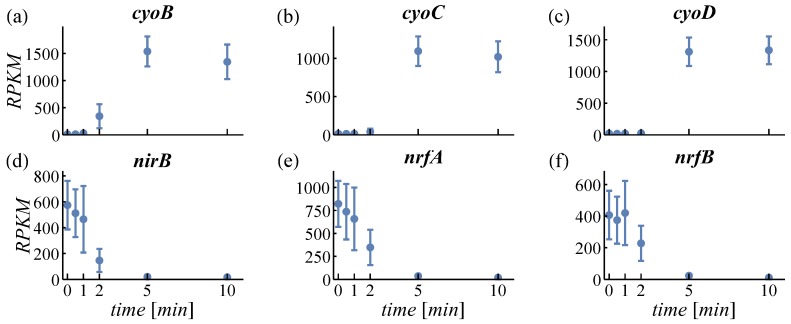
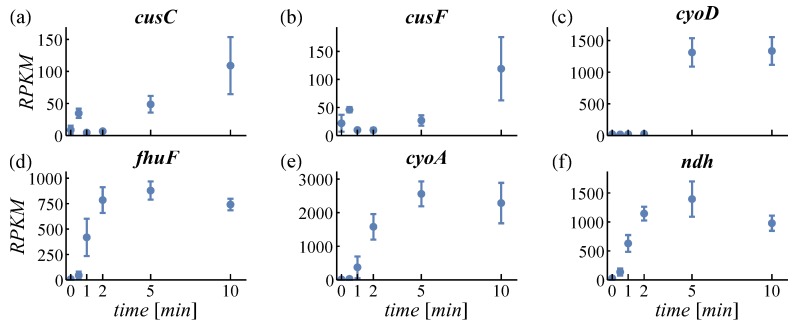
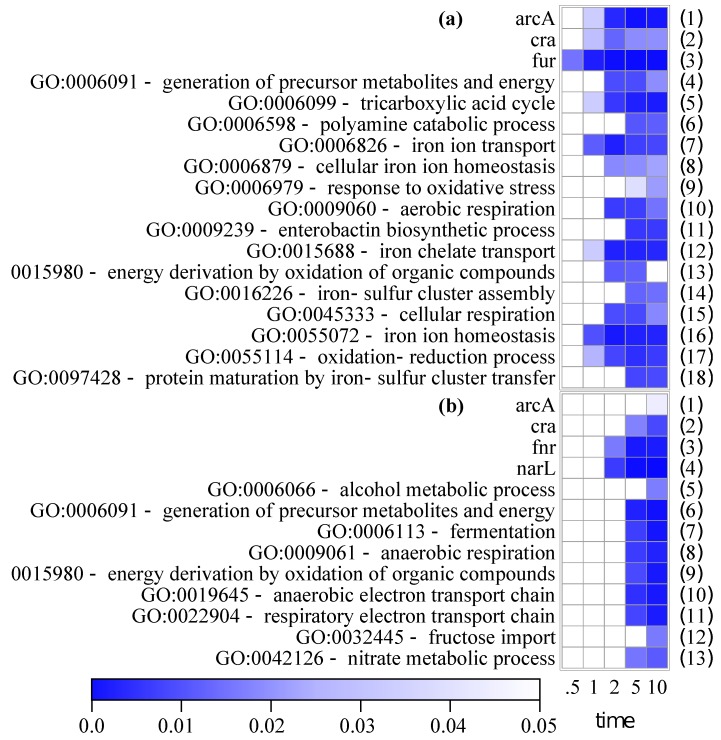
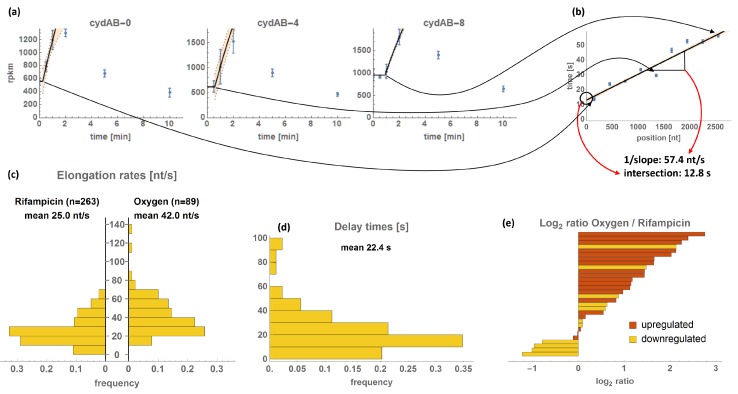
Escherichia coli is able to shift between anaerobic and aerobic metabolism by adapting its gene expression, e.g., of metabolic genes, to the new environment. The dynamics of gene expression that result from environmental shifts are limited, amongst others, by the time needed for regulation and transcription elongation. In this study, we examined gene expression dynamics after an anaerobic-to-aerobic shift on a short time scale (0.5, 1, 2, 5, and 10 min) by RNA sequencing with emphasis on delay times and transcriptional elongation rates (TER). Transient expression patterns and timing of differential expression, characterized by delay and elongation, were identified as key features of the dataset. Gene ontology enrichment analysis revealed early upregulation of respiratory and iron-related gene sets. We inferred specific TERs of 89 operons with a mean TER of 42.0 nt/s and mean delay time of 22.4 s. TERs correlate with sequence features, such as codon bias, whereas delay times correlate with the involvement of regulators. The presented data illustrate that at very short times after a shift in oxygenation, extensional changes of the transcriptome, such as temporary responses, can be observed. Besides regulation, TERs contribute to the dynamics of gene expression.
Keywords: Escherichia coli; RNA sequencing; oxygen; transcriptional elongation rates; transition.
Conflict of interest statement
The authors declare no conflict of interest. The funding sponsors had no role in the design of the study; in the collection, analyses, or interpretation of data; in the writing of the manuscript, and in the decision to publish the results.
Figures
Similar articles
-
Transition of an Anaerobic Escherichia coli Culture to Aerobiosis: Balancing mRNA and Protein Levels in a Demand-Directed Dynamic Flux Balance Analysis.PLoS One. 2016 Jul 6;11(7):e0158711. doi: 10.1371/journal.pone.0158711. eCollection 2016. PLoS One. 2016. PMID: 27384956 Free PMC article.
-
Transcriptional and metabolic response of recombinant Escherichia coli to spatial dissolved oxygen tension gradients simulated in a scale-down system.Biotechnol Bioeng. 2006 Feb 5;93(2):372-85. doi: 10.1002/bit.20704. Biotechnol Bioeng. 2006. PMID: 16187334
-
IscR-dependent gene expression links iron-sulphur cluster assembly to the control of O2-regulated genes in Escherichia coli.Mol Microbiol. 2006 May;60(4):1058-75. doi: 10.1111/j.1365-2958.2006.05160.x. Mol Microbiol. 2006. PMID: 16677314
-
Transcriptome and physiological responses to hydrogen peroxide of the facultatively phototrophic bacterium Rhodobacter sphaeroides.J Bacteriol. 2005 Nov;187(21):7232-42. doi: 10.1128/JB.187.21.7232-7242.2005. J Bacteriol. 2005. PMID: 16237007 Free PMC article.
-
O2-sensing and O2-dependent gene regulation in facultatively anaerobic bacteria.Arch Microbiol. 1995 Aug;164(2):81-90. Arch Microbiol. 1995. PMID: 8588737 Review.
Cited by
-
ScatLay: utilizing transcriptome-wide noise for identifying and visualizing differentially expressed genes.Sci Rep. 2020 Oct 15;10(1):17483. doi: 10.1038/s41598-020-74564-1. Sci Rep. 2020. PMID: 33060728 Free PMC article.
-
Pathway Tools version 23.0 update: software for pathway/genome informatics and systems biology.Brief Bioinform. 2021 Jan 18;22(1):109-126. doi: 10.1093/bib/bbz104. Brief Bioinform. 2021. PMID: 31813964 Free PMC article. Review.
-
Pathway Tools Visualization of Organism-Scale Metabolic Networks.Metabolites. 2021 Jan 22;11(2):64. doi: 10.3390/metabo11020064. Metabolites. 2021. PMID: 33499002 Free PMC article.
-
The Omics Dashboard for interactive exploration of gene-expression data.Nucleic Acids Res. 2017 Dec 1;45(21):12113-12124. doi: 10.1093/nar/gkx910. Nucleic Acids Res. 2017. PMID: 29040755 Free PMC article.
-
Investigation of Bar-seq as a method to study population dynamics of Saccharomyces cerevisiae deletion library during bioreactor cultivation.Microb Cell Fact. 2020 Aug 18;19(1):167. doi: 10.1186/s12934-020-01423-z. Microb Cell Fact. 2020. PMID: 32811554 Free PMC article.
References
LinkOut - more resources
Full Text Sources
Other Literature Sources
Molecular Biology Databases
Research Materials
