. 2017 Jun 16;6(6):936-942.
doi: 10.1021/acssynbio.6b00309. Epub 2017 Mar 10.

Quantitative Analysis of Synthetic Cell Lineage Tracing Using Nuclease Barcoding

Affiliations

Quantitative Analysis of Synthetic Cell Lineage Tracing Using Nuclease Barcoding

Stephanie Tzouanas Schmidt et al. ACS Synth Biol. .

Abstract

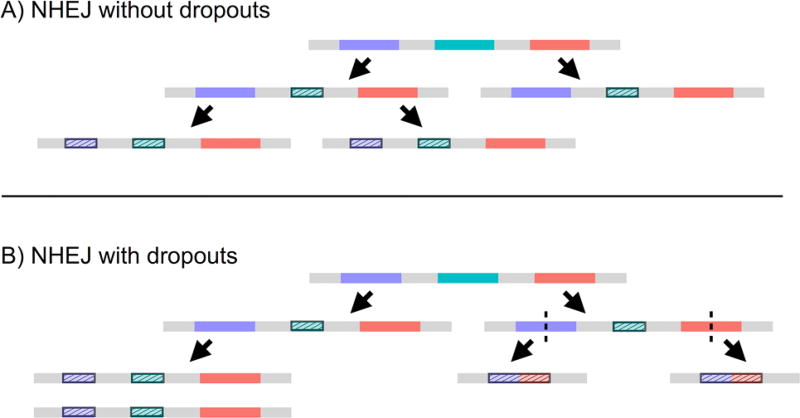
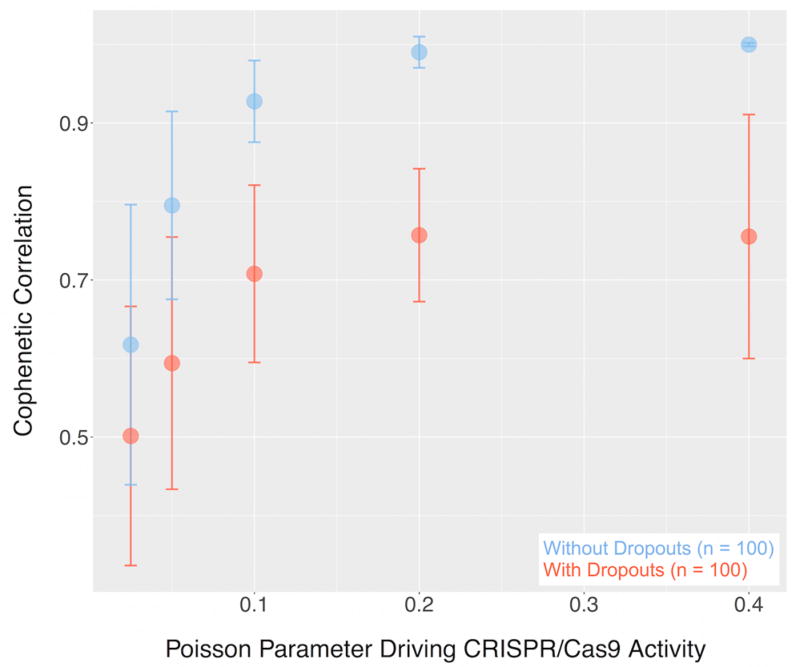
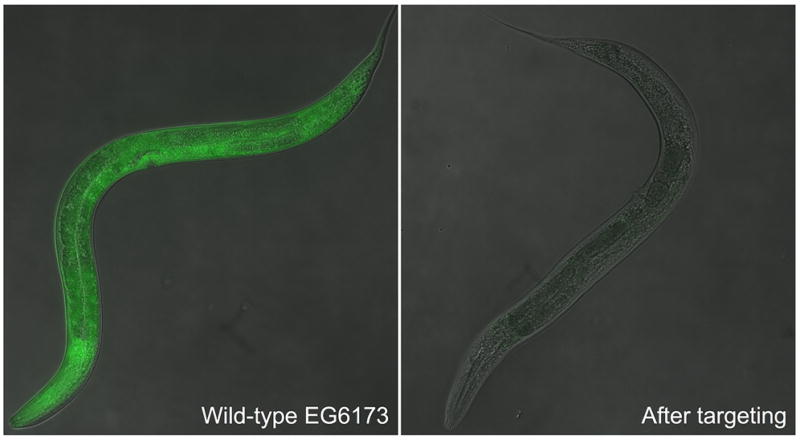
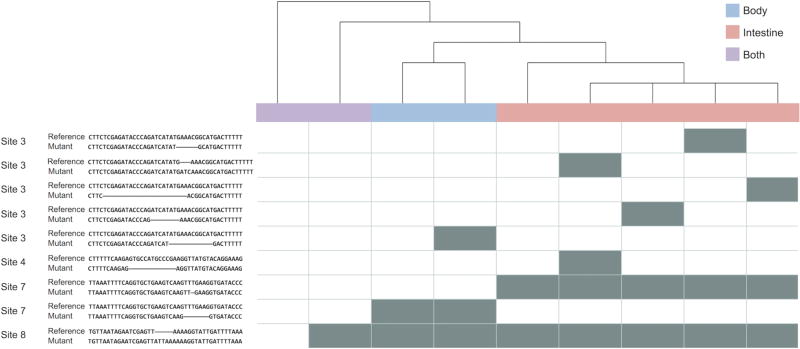
Lineage tracing by the determination and mapping of progeny arising from single cells is an important approach enabling the elucidation of mechanisms underlying diverse biological processes ranging from development to disease. We developed a dynamic sequence-based barcode system for synthetic lineage tracing and have demonstrated its performance in C. elegans, a model organism whose lineage tree is well established. The strategy we use creates lineage trees based upon the introduction of synthetically controlled mutations into cells and the propagation of these mutations to daughter cells at each cell division. We analyzed this experimental proof of concept along with a corresponding simulation and analytical model to gain a deeper understanding of the coding capacity of the system. Our results provide specific bounds on the fidelity of lineage tracing using such approaches.

Keywords: CRISPR/Cas9; DNA barcoding; lineage tracing.


Figures

Figure 1
Figure 1
Inheritance of introduced mutations enables inference of cell lineages. Making CRISPR/Cas9 available during development allows for the introduction and transmission of indels in the sequence barcode of cut sites in individual cells. Sample sequence barcodes are represented by gray line segments, and the contained cut sites are represented by each differently colored subsection. Upon targeting by CRISPR/Cas9, the resulting indels are denoted by the shortening of the colored subsections and by the dashed fill pattern. (A) Schematic of representative barcodes in the case where no sequence between cut sites is lost (i.e., no dropouts). (B) Schematic of representative barcodes in the case where dropouts occur, resulting in concomitant loss of information provided by previously created indels.
Figure 2
Figure 2
Performance overlaps predicted for cases with and without dropouts. Simulation of sequence barcodes and resulting lineage trees by modeling indel generation as a Poisson process without (blue) and with (red) dropouts enabled comparison with the known C. elegans lineage using cophenetic correlation for a range of Poisson expected values (n = 100).
Figure 3
Figure 3
Effective CRISPR/Cas9 targeting screenable by phenotype. Introduction of indels into barcode encoded in EGFP sequence allows for identification of barcoded organisms through disruption of EGFP expression.
Figure 4
Figure 4
Dynamic sequence barcoding identifies distinct cell populations. The relationships between a subset of unique sequence barcodes derived from the body (blue), intestine (red), and both samples (purple) of a single worm was used to create the following lineage tree. The barcodes corresponding to each member of the tree are presented in the columns of the heatmap, the individual indels are denoted by its rows, and each gray-shaded box indicates the presence of a given indel. The indels are presented in the table to the left of the heatmap as alignments between the reference (top) and observed (bottom) sequences, and the cut site with which each signature is associated is listed in the leftmost column of the table.
Figure 5
Figure 5
Barcoding permits determination of correct tissue of origin. The precision and recall of tissue identification based upon the full set of barcodes derived from the worm shown in Figure 4 for which the intestine and body were sequenced separately were calculated using the k-nearest neighbors algorithm. The experimental results, shown by the individual points over the columns, compare favorably with the results obtained by randomizing the data set’s labels (n = 100).
Figure 6
Figure 6
Profile of unique indels generated in C. elegans by CRISPR/Cas9 provides insight into information content of proposed barcoding technique. The unique indels observed in sequenced animals (n = 8) across all ten targeted sites were compared. (A) The probability distribution of which positions flanking the CRISPR/Cas9-created double-stranded break (DSB) were contained in the resulting indels has a Gaussian form. (B) The length-normalized position of the DSB as compared to the center of the indel tends to occur to its right (+) rather than left (−).

Similar articles

Cited by

References

    1. Kretzschmar K, Watt FM. Lineage Tracing. Cell. 2012;148:33–45. - PubMed
    1. Wilson HV. Embryology of the Sea Bass. Government Printing Office; Washington, D.C: 1891.
    1. Sulston JE, Horvitz HR. Post-embryonic cell lineages of the nematode, Caenorhabditis elegans. Dev. Biol. 1977;56:110–156. - PubMed
    1. Sulston JE, Schierenberg E, White JG, Thomson JN. The embryonic cell lineage of the nematode Caenorhabditis elegans. Dev. Biol. 1983;100:64–119. - PubMed
    1. Vogt W. Teil Gastrulation und Mesodermbildung bei Urodelen und Anuren. Gestaltungsanalyse am Amphibienkeim mit örtlicher Vitalfärbung. Dev. Genes Evol. 1929;120:384–706. - PubMed

Publication types

MeSH terms