. 2017 Mar 6;17(1):39.
doi: 10.1186/s12874-017-0315-7.

Trial Sequential Analysis in systematic reviews with meta-analysis

Affiliations

Trial Sequential Analysis in systematic reviews with meta-analysis

Jørn Wetterslev et al. BMC Med Res Methodol. .

Abstract

Background: Most meta-analyses in systematic reviews, including Cochrane ones, do not have sufficient statistical power to detect or refute even large intervention effects. This is why a meta-analysis ought to be regarded as an interim analysis on its way towards a required information size. The results of the meta-analyses should relate the total number of randomised participants to the estimated required meta-analytic information size accounting for statistical diversity. When the number of participants and the corresponding number of trials in a meta-analysis are insufficient, the use of the traditional 95% confidence interval or the 5% statistical significance threshold will lead to too many false positive conclusions (type I errors) and too many false negative conclusions (type II errors).

Methods: We developed a methodology for interpreting meta-analysis results, using generally accepted, valid evidence on how to adjust thresholds for significance in randomised clinical trials when the required sample size has not been reached.

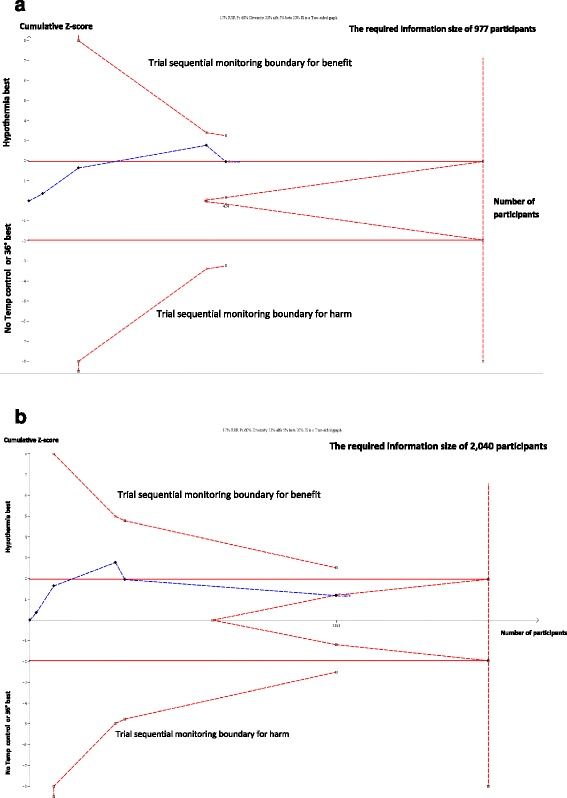
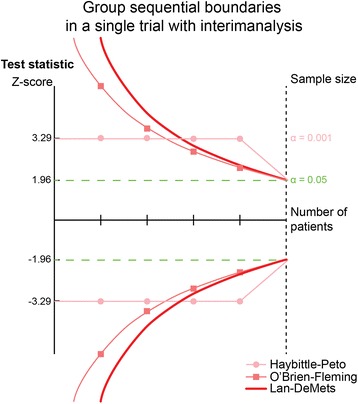
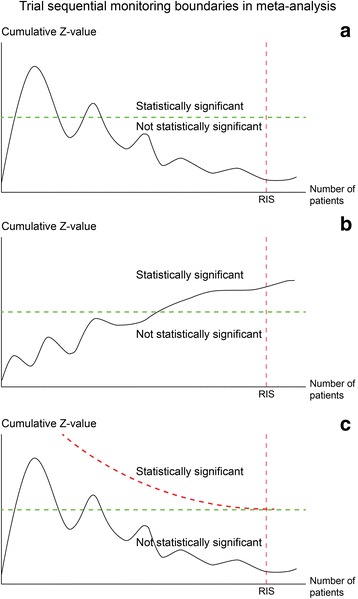
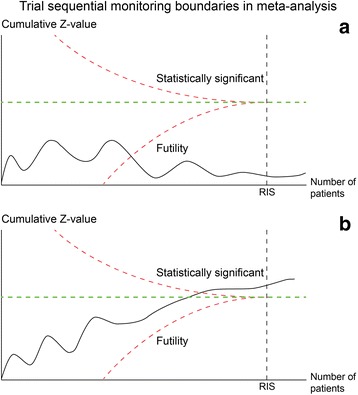
Results: The Lan-DeMets trial sequential monitoring boundaries in Trial Sequential Analysis offer adjusted confidence intervals and restricted thresholds for statistical significance when the diversity-adjusted required information size and the corresponding number of required trials for the meta-analysis have not been reached. Trial Sequential Analysis provides a frequentistic approach to control both type I and type II errors. We define the required information size and the corresponding number of required trials in a meta-analysis and the diversity (D2) measure of heterogeneity. We explain the reasons for using Trial Sequential Analysis of meta-analysis when the actual information size fails to reach the required information size. We present examples drawn from traditional meta-analyses using unadjusted naïve 95% confidence intervals and 5% thresholds for statistical significance. Spurious conclusions in systematic reviews with traditional meta-analyses can be reduced using Trial Sequential Analysis. Several empirical studies have demonstrated that the Trial Sequential Analysis provides better control of type I errors and of type II errors than the traditional naïve meta-analysis.

Conclusions: Trial Sequential Analysis represents analysis of meta-analytic data, with transparent assumptions, and better control of type I and type II errors than the traditional meta-analysis using naïve unadjusted confidence intervals.

Keywords: Diversity; Fixed-effect model; Group sequential analysis; Heterogeneity; Information size; Interim analysis; Meta-analysis; Random-effects model; Sample size; Trial sequential analysis.


Figures

Fig. 1
Fig. 1
a Showing Trial Sequential Analysis of meta-analysis before the Target Temperature Management Trial. The Z-value is the test statistic and |Z| = 1.96 corresponds to a P = 0.05; the higher the Z-value, the lower the P-value. Trial Sequential Analysis (TSA) of mortality after out of hospital cardiac arrest patients, randomised to cooling to 33°–34 °C versus 36 °C or no temperature control in four trials performed before the Target Temperature Management (TTM) trial [16, 20]. The required information size to detect or reject the 17% relative risk reduction found in the random-effects model meta-analysis is calculated to 977 participants using the diversity found in the meta-analysis of 23%, mortality in the control groups of 60%, with a double sided α of 0.05 and a β of 0.20 (power of 80.0%). The cumulative Z-curve (black full line with quadratic indicatons of each trial) surpasses the traditional boundary for statistical significance during the third trial and touches the traditional boundary after the fourth trial (95% confidence interval: 0.70 to 1.00; P = 0.05). However, none of the trial sequential monitoring boundaries (etched curves above and below the traditional horizontal lines for statistical significance) have been surpassed in the TSA. Therefore, the result is inconclusive when adjusted for sequential testing on an accumulating number of participants and the fact that the required information size has not yet been achieved. The TSA-adjusted confidence interval is 0.63 to 1.12 after inclusion of the fourth trial [10, 12]. b showing Trial Sequential Analysis of meta-analysis after the Target Temperature Management Trial. The Z-value is the test statistic and |Z| = 1.96 corresponds to a P = 0.05; the higher the Z-value, the lower the P-value. Trial Sequential Analysis (TSA) of mortality after out of hospital cardiac arrest patients, randomised to cooling to 33°–34 °C versus 36 °C or no temperature control in five trials after inclusion of the Target Temperature Management (TTM) Trial [17]. The required information size to detect or reject the 17% relative risk reduction found in the random-effects model meta-analysis prior to the TTM Trial is calculated to 2040 participants using the diversity found in the meta-analysis of 65%, mortality in the control groups of 60%, with a double sided α of 0.05 and a β of 0.20 (power of 80.0%). The cumulative Z-curve (black full line with quadratic indicatons of each trial) touches the boundary for futility indicating that it will be unlikely to reach a statistical significant P < 0.05, even if we proceed to include trials randomising patients until the required information size of 2040 is reached. The result indicates that a 17% relative risk reduction (or more) may be excluded, even though the required information size has not been achieved, adjusting for sparse data and sequential testing on an accumulating number of patients [10, 12]
Fig. 2
Fig. 2
Showing three different group sequential boundaries in a single trial with interim analysis. The Z-value is the test statistic and a |Z| = 1.96 corresponds to P = 0.05; the higher the Z-value, the lower the P-value. This is a historical overview of group sequential boundaries for the cumulative Z-curve in relation to the number of randomised participant in a single trial [19, 32, 33]
Fig. 3
Fig. 3
Showing trial sequential monitoring boundaries for benefit and harm in a cumulative meta-analysis. The Z-value is the test statistic and |Z| = 1.96 corresponds to P = 0.05; the higher Z-values, the lower the P-values. a Shows how an early statistical significance no longer is present in a cumulative meta-analysis when the required information size has been reached. b Shows how an early lack of statistical significance emerges later when the requiered information size is achieved. c Shows how an early statistical significance can be avoided by adjusting the level of statistical significance. The etched upper curve is the group sequential boundary adjusting the level of statistical significance for multiple testing and sparse data. Z-value is shown on the y-axis and on the x-axis IS is the required information size [10]
Fig. 4
Fig. 4
Showing trial sequential monitoring boundaries for benefit and futility in cumulative meta-analysis. The Z-value is the test statistic and |Z| = 1.96 corresponds to P = 0.05; the higher Z-values, the lower P-values. a Shows how trial sequential monitoring of a cumulative meta-analysis, before the requiered information size (IS) is achieved, makes it likely that the assumed effect is in fact absent when the Z-curve surpasses the futility-boundary (etched curve). b Shows how trial sequential monitoring of a cumulative meta-analysis, before the required information size (RIS) is achieved, makes it likely that the assumed effect is in fact true when the Z-curve surpasses the trial sequential monitoring boundary for benefit (etched curve). Lan-DeMets’ α-spending-function has been applied for the construction of the trial sequential monitoring boundaries, the critical Z-values [10]

References

    1. Turner RM, Bird SM, Higgins JP. The impact of study size on metaanalyses: examination of underpowered studies in Cochrane reviews. PLoS One. 2013;8:e59202. doi: 10.1371/journal.pone.0059202. - DOI - PMC - PubMed
    1. Pereira TV, Ioannidis JP. Statistically significant metaanalyses of clinical trials have modest credibility and inflated effects. J Clin Epidemiol. 2011;64:1060–9. doi: 10.1016/j.jclinepi.2010.12.012. - DOI - PubMed
    1. AlBalawi Z, McAlister FA, Thorlund K, Wong M, Wetterslev J. Random error in cardiovascular meta-analyses: how common are false positive and false negative results? Int J Cardiol. 2013;168:1102–7. doi: 10.1016/j.ijcard.2012.11.048. - DOI - PubMed
    1. Imberger G. Multiplicity and sparse data in systematic reviews of anaesthesiological interventions: a cause of increased risk of random error and lack of reliability of conclusions? Copenhagen: Copenhagen University, Faculty of Health and Medical Sciences; 2014.
    1. Brok J, Thorlund K, Wetterslev J, Gluud C. Apparently conclusive metaanalyses may be inconclusive—trial sequential analysis adjustment of random error risk due to repetitive testing of accumulating data in apparently conclusive neonatal metaanalyses. Int J Epidemiol. 2009;38:287–98. doi: 10.1093/ije/dyn188. - DOI - PubMed

Publication types

LinkOut - more resources