. 2017 Mar 7;15(1):15.
doi: 10.1186/s12915-017-0356-8.

Exploring the floristic diversity of tropical Africa

Affiliations

Exploring the floristic diversity of tropical Africa

Marc S M Sosef et al. BMC Biol. .

Abstract

Background: Understanding the patterns of biodiversity distribution and what influences them is a fundamental pre-requisite for effective conservation and sustainable utilisation of biodiversity. Such knowledge is increasingly urgent as biodiversity responds to the ongoing effects of global climate change. Nowhere is this more acute than in species-rich tropical Africa, where so little is known about plant diversity and its distribution. In this paper, we use RAINBIO - one of the largest mega-databases of tropical African vascular plant species distributions ever compiled - to address questions about plant and growth form diversity across tropical Africa.

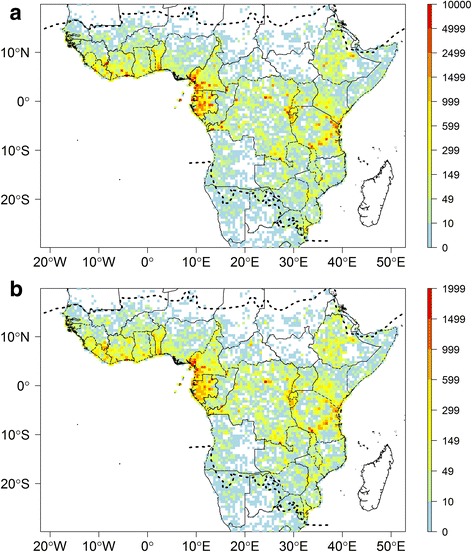
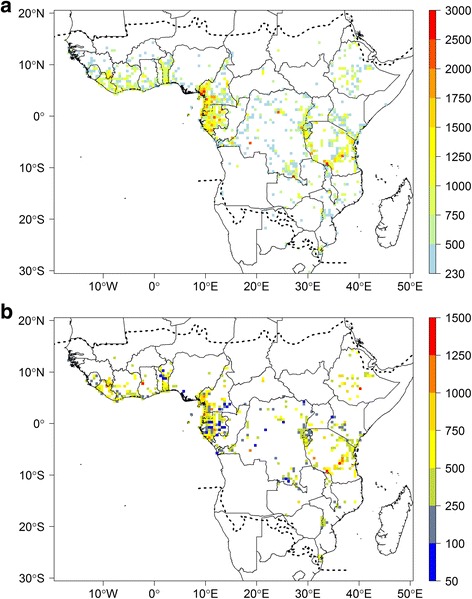
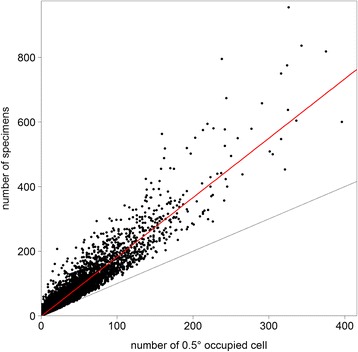
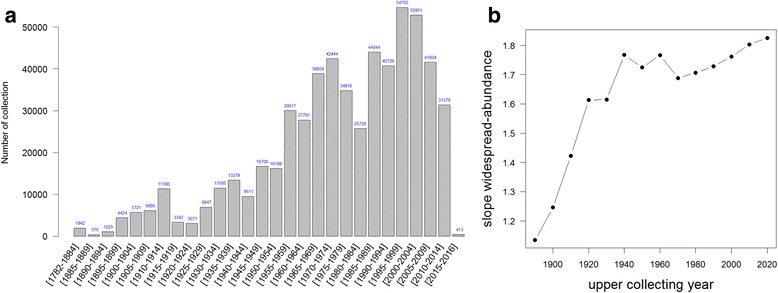
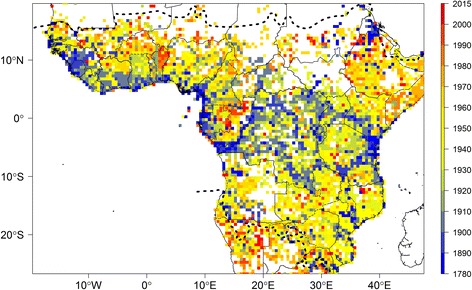
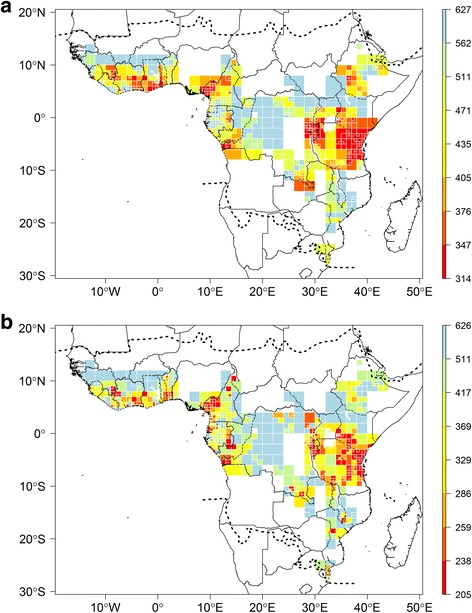
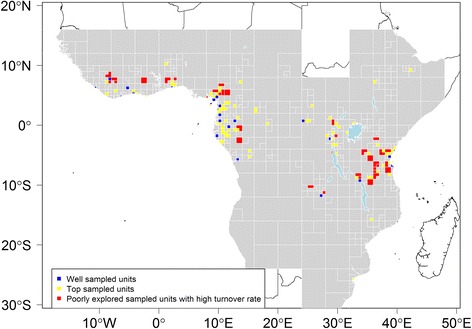
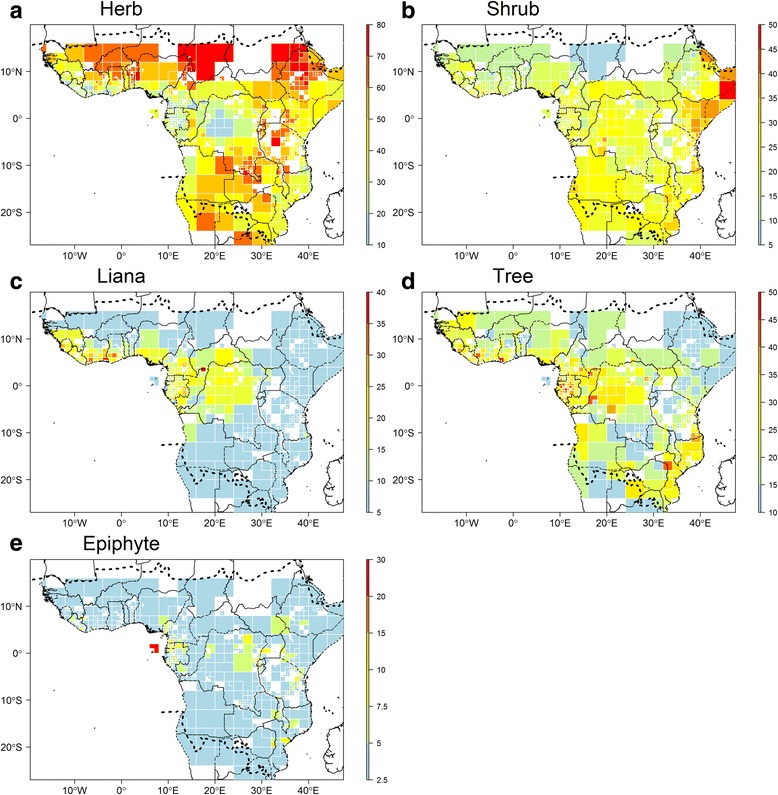
Results: The filtered RAINBIO dataset contains 609,776 georeferenced records representing 22,577 species. Growth form data are recorded for 97% of all species. Records are well distributed, but heterogeneous across the continent. Overall, tropical Africa remains poorly sampled. When using sampling units (SU) of 0.5°, just 21 reach appropriate collection density and sampling completeness, and the average number of records per species per SU is only 1.84. Species richness (observed and estimated) and endemism figures per country are provided. Benin, Cameroon, Gabon, Ivory Coast and Liberia appear as the botanically best-explored countries, but none are optimally explored. Forests in the region contain 15,387 vascular plant species, of which 3013 are trees, representing 5-7% of the estimated world's tropical tree flora. The central African forests have the highest endemism rate across Africa, with approximately 30% of species being endemic.

Conclusions: The botanical exploration of tropical Africa is far from complete, underlining the need for intensified inventories and digitization. We propose priority target areas for future sampling efforts, mainly focused on Tanzania, Atlantic Central Africa and West Africa. The observed number of tree species for African forests is smaller than those estimated from global tree data, suggesting that a significant number of species are yet to be discovered. Our data provide a solid basis for a more sustainable management and improved conservation of tropical Africa's unique flora, and is important for achieving Objective 1 of the Global Strategy for Plant Conservation 2011-2020. In turn, RAINBIO provides a solid basis for a more sustainable management and improved conservation of tropical Africa's unique flora.

Keywords: Botanical exploration; Digitization; Floristic patterns; Herbarium specimens; Plant growth form; Species richness; Tropical forests.


Figures

Fig. 1
Fig. 1
Distribution of botanical records across tropical Africa. Number of specimens (a) and observed species richness (b) per 0.5° sampling units. Dashed lines represent the limits for tropical Africa as defined in our study. Map based on georeferenced herbarium records, silica gel samples and plot data
Fig. 2
Fig. 2
Estimated botanical diversity of tropical Africa. a Estimated species diversity based on the Chao1 estimator for each 0.5° sampling units (SUs) with more than 100 records. b Effective number of species estimated using the Nielsen statistic per 0.5° SUs with more than 100 records. Dashed lines represent the limits for tropical Africa as defined in our study. This map is based on georeferenced herbarium records, silica gel samples and plot data
Fig. 3
Fig. 3
Spatial distribution of specimens per species. Each dot represents a species with its number of specimens against the number of 0.5° sampling units (SUs) it occupies. The slope of the red line (linear regression) indicates the average number of specimens per SU for all species. The grey line (slope equal to one) indicates when the number of specimens equals the number of occupied SUs
Fig. 4
Fig. 4
Temporal distribution of collecting efforts. a Number of herbarium records for tropical Africa per 5-year slices from 1782 to 2015. b Temporal evolution of the average number of specimens per SU for all species. Plots based on georeferenced herbarium records only
Fig. 5
Fig. 5
Time lapse of botanical collecting history across tropical Africa. The map represents the date of the first botanical collection made within each 0.5° sampling unit. Dashed lines represent the limits for tropical Africa as defined in our study. Map based on georeferenced herbarium records, silica gel samples and plot data. An animated gif version of this map is available at: http://rainbio.cesab.org
Fig. 6
Fig. 6
Floristic turnover rates across tropical Africa. Values based on adaptive resolution sampling unit (explanation see text). Pairwise floristic similarity is computed as 1–βsim turnover index using two values of μ (see section in Methods and Additional file 1). a Meso-scale floristic turnover rate with μ = 1°; b Large-scale turnover rate with μ = 2°. Dashed lines represent the limits for tropical Africa as defined in our study. Maps based on georeferenced herbarium records, silica gel samples and plot data
Fig. 7
Fig. 7
Level of botanical exploration across tropical Africa. Based on an adaptive resolution sampling units (SUs). This map shows priority SUs calculated based on a turnover rate using μ = 1°. Grey SUs represent SUs that did not meet any of our threshold limits (see text for explanation) and thus highlight SUs that are poorly documented. Dashed lines represent the limits for tropical Africa as defined in our study. Map based on georeferenced herbarium records, silica gel samples and plot data
Fig. 8
Fig. 8
Distribution of growth form diversity across tropical Africa. Based on an adaptive resolution sampling units (SUs; for explanation see text). Proportion of species of a given growth form type occurring in each SU. a Proportion of herbs; b Proportion of shrubs; c Proportion of lianas; d Proportion of trees; e Proportion of epiphytes. Dashed lines represent the limits for tropical Africa as defined in our study. Map based on georeferenced herbarium records, silica gel samples and plot data

Comment in

References

    1. Gaston KJ. Global patterns in biodiversity. Nature. 2000;405:220–7. doi: 10.1038/35012228. - DOI - PubMed
    1. Klopper RR, Gautier L, Chatelain C, Smith GF, Spichiger R. Floristics of the angiosperm flora of sub-Saharan Africa: an analysis of the African Plant Checklist and Database. Taxon. 2007;56:201–8.
    1. Linder HP. Plant diversity and endemism in sub-Saharan tropical Africa. J Biogeogr. 2001;28:169–82. doi: 10.1046/j.1365-2699.2001.00527.x. - DOI
    1. Linder HP. The evolution of African plant diversity. Front Genet. 2014;2:38.
    1. Watson JE, Shanahan DF, Di Marco M, Allan J, Laurance WF, Sanderson EW, et al. Catastrophic declines in wilderness areas undermine global environment targets. Curr Biol. 2016;26(21):2929–34. doi: 10.1016/j.cub.2016.08.049. - DOI - PubMed

Publication types

LinkOut - more resources