

ABCG1 regulates pulmonary surfactant metabolism in mice and men
- PMID: 28264879
- PMCID: PMC5408613
- DOI: 10.1194/jlr.M075101
ABCG1 regulates pulmonary surfactant metabolism in mice and men
Abstract
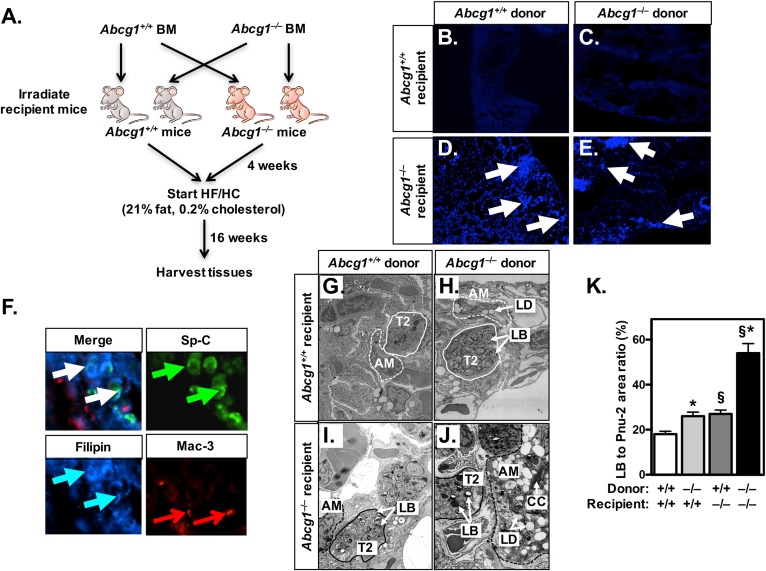
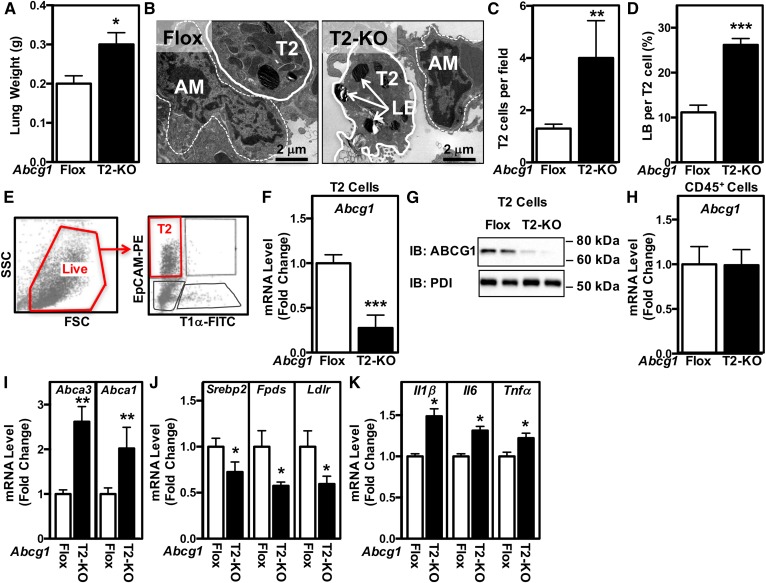
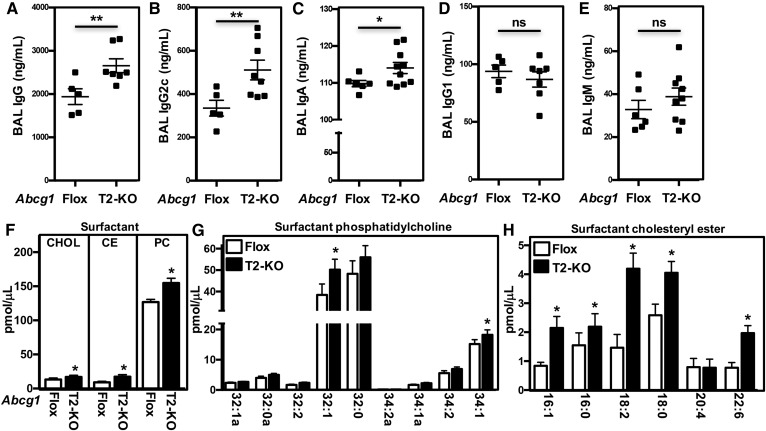
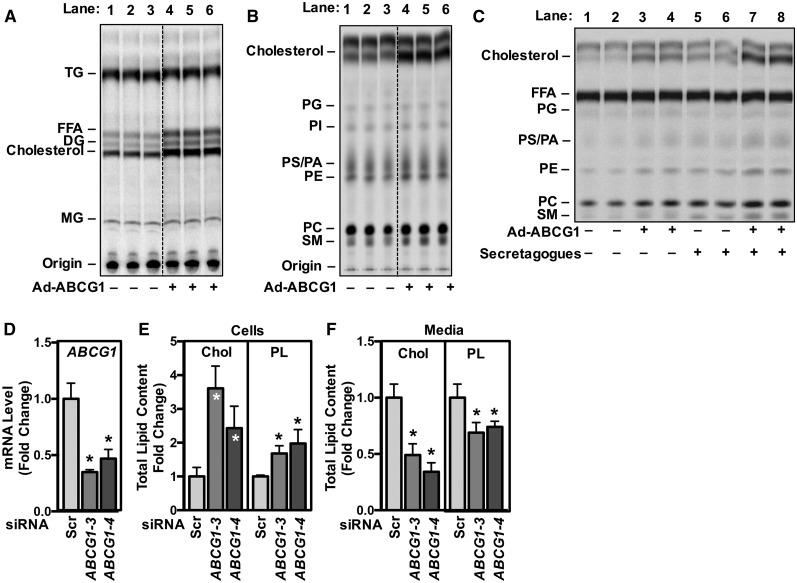
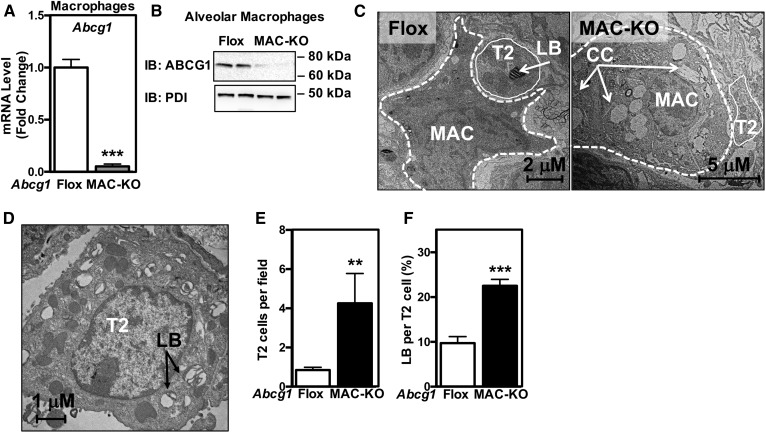
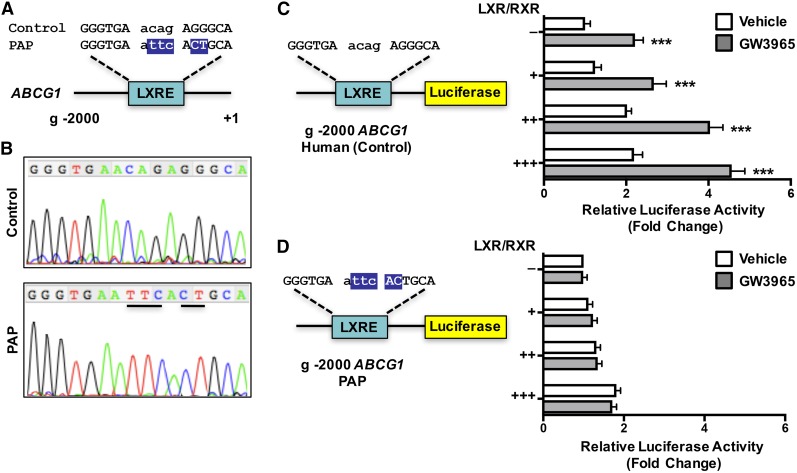
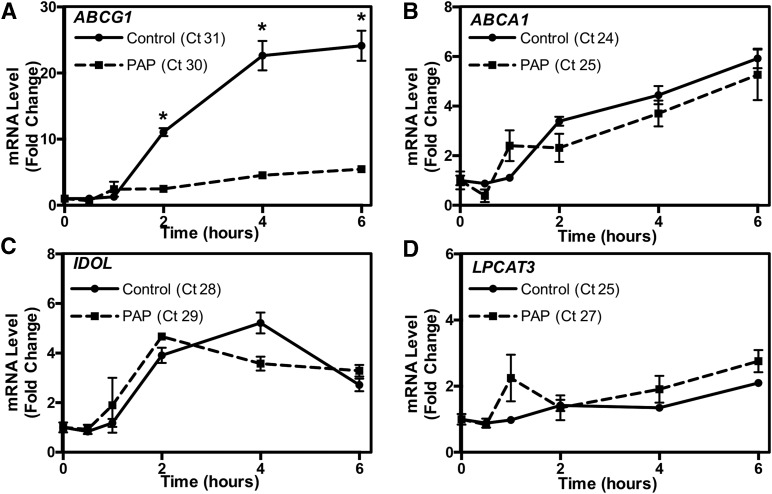
Idiopathic pulmonary alveolar proteinosis (PAP) is a rare lung disease characterized by accumulation of surfactant. Surfactant synthesis and secretion are restricted to epithelial type 2 (T2) pneumocytes (also called T2 cells). Clearance of surfactant is dependent upon T2 cells and macrophages. ABCG1 is highly expressed in both T2 cells and macrophages. ABCG1-deficient mice accumulate surfactant, lamellar body-loaded T2 cells, lipid-loaded macrophages, B-1 lymphocytes, and immunoglobulins, clearly demonstrating that ABCG1 has a critical role in pulmonary homeostasis. We identify a variant in the ABCG1 promoter in patients with PAP that results in impaired activation of ABCG1 by the liver X receptor α, suggesting that ABCG1 basal expression and/or induction in response to sterol/lipid loading is essential for normal lung function. We generated mice lacking ABCG1 specifically in either T2 cells or macrophages to determine the relative contribution of these cell types on surfactant lipid homeostasis. These results establish a critical role for T2 cell ABCG1 in controlling surfactant and overall lipid homeostasis in the lung and in the pathogenesis of human lung disease.
Keywords: ATP binding cassette transporter G1; cholesterol; lung; phospholipid; pulmonary alveolar proteinosis.
Copyright © 2017 by the American Society for Biochemistry and Molecular Biology, Inc.
Figures
Similar articles
-
ABCG1 is deficient in alveolar macrophages of GM-CSF knockout mice and patients with pulmonary alveolar proteinosis.J Lipid Res. 2007 Dec;48(12):2762-8. doi: 10.1194/jlr.P700022-JLR200. Epub 2007 Sep 11. J Lipid Res. 2007. PMID: 17848583
-
Restoration of PPARγ reverses lipid accumulation in alveolar macrophages of GM-CSF knockout mice.Am J Physiol Lung Cell Mol Physiol. 2011 Jan;300(1):L73-80. doi: 10.1152/ajplung.00128.2010. Epub 2010 Oct 29. Am J Physiol Lung Cell Mol Physiol. 2011. PMID: 21036914
-
Targeted PPAR{gamma} deficiency in alveolar macrophages disrupts surfactant catabolism.J Lipid Res. 2010 Jun;51(6):1325-31. doi: 10.1194/jlr.M001651. Epub 2010 Jan 11. J Lipid Res. 2010. PMID: 20064973 Free PMC article.
-
Pulmonary Alveolar Proteinosis Syndrome.Clin Chest Med. 2016 Sep;37(3):431-40. doi: 10.1016/j.ccm.2016.04.006. Epub 2016 Jun 17. Clin Chest Med. 2016. PMID: 27514590 Free PMC article. Review.
-
Expanding roles of ABCG1 and sterol transport.Curr Opin Lipidol. 2013 Apr;24(2):138-46. doi: 10.1097/MOL.0b013e32835da122. Curr Opin Lipidol. 2013. PMID: 23340182 Review.
Cited by
-
CYFRA21-1 is a more sensitive biomarker to assess the severity of pulmonary alveolar proteinosis.BMC Pulm Med. 2022 Jan 3;22(1):2. doi: 10.1186/s12890-021-01795-x. BMC Pulm Med. 2022. PMID: 34980056 Free PMC article.
-
Lipid-Protein and Protein-Protein Interactions in the Pulmonary Surfactant System and Their Role in Lung Homeostasis.Int J Mol Sci. 2020 May 25;21(10):3708. doi: 10.3390/ijms21103708. Int J Mol Sci. 2020. PMID: 32466119 Free PMC article. Review.
-
Homeostatic Functions of Tissue-Resident Macrophages and Their Role in Tissue Maintenance.Results Probl Cell Differ. 2024;74:3-54. doi: 10.1007/978-3-031-65944-7_1. Results Probl Cell Differ. 2024. PMID: 39406900 Review.
-
Critical Role of the Human ATP-Binding Cassette G1 Transporter in Cardiometabolic Diseases.Int J Mol Sci. 2017 Sep 2;18(9):1892. doi: 10.3390/ijms18091892. Int J Mol Sci. 2017. PMID: 28869506 Free PMC article. Review.
-
Biological Functions and Clinical Significance of the ABCG1 Transporter.Biology (Basel). 2024 Dec 25;14(1):8. doi: 10.3390/biology14010008. Biology (Basel). 2024. PMID: 39857239 Free PMC article. Review.
References
-
- Schürch S., Lee M., and Gehr P.. 1992. Pulmonary surfactant: surface properties and function of alveolar and airway surfactant. Pure Appl. Chem. 64: 1745–1750.
-
- Chander A., and Fisher A. B.. 1990. Regulation of lung surfactant secretion. Am. J. Physiol. 258: L241–L253. - PubMed
-
- Haagsman H. P., Hogenkamp A., van Eijk M., and Veldhuizen E. J. A.. 2008. Surfactant collectins and innate immunity. Neonatology. 93: 288–294. - PubMed
-
- McIntosh J. C., Swyers A. H., Fisher J. H., and Wright J. R.. 1996. Surfactant proteins A and D increase in response to intratracheal lipopolysaccharide. Am. J. Respir. Cell Mol. Biol. 15: 509–519. - PubMed
-
- Wright J. R. 2004. Host defense functions of pulmonary surfactant. Biol. Neonate. 85: 326–332. - PubMed
Publication types
MeSH terms
Substances
Grants and funding
LinkOut - more resources
Full Text Sources
Other Literature Sources
Molecular Biology Databases
Research Materials
