

Perforin Expression by CD8 T Cells Is Sufficient To Cause Fatal Brain Edema during Experimental Cerebral Malaria
- PMID: 28264905
- PMCID: PMC5400849
- DOI: 10.1128/IAI.00985-16
Perforin Expression by CD8 T Cells Is Sufficient To Cause Fatal Brain Edema during Experimental Cerebral Malaria
Abstract
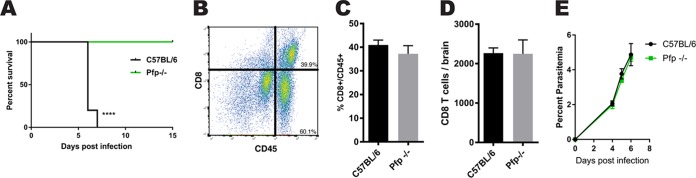
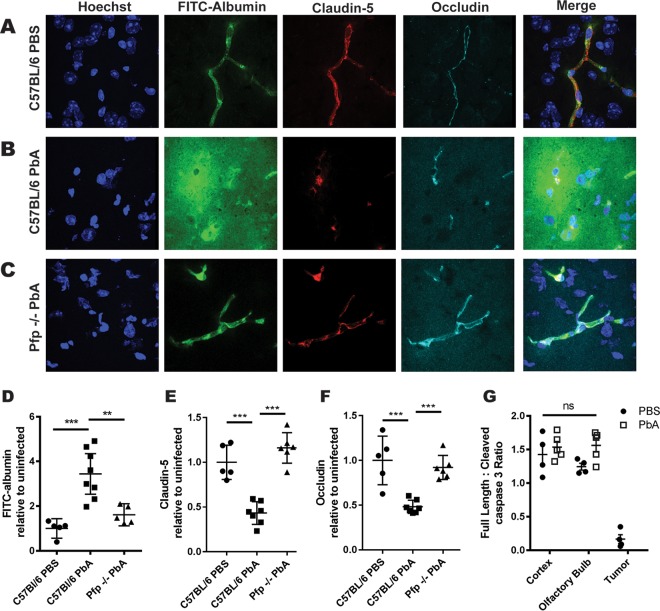
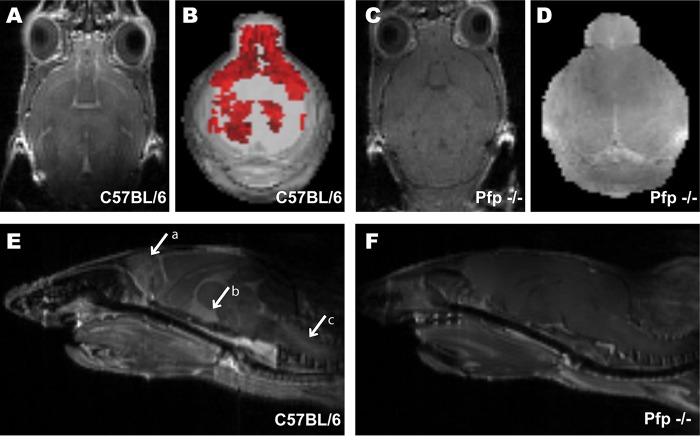
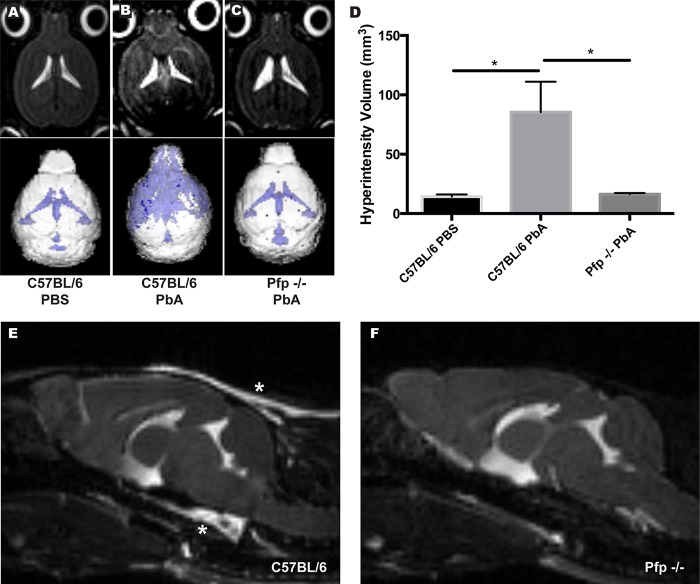
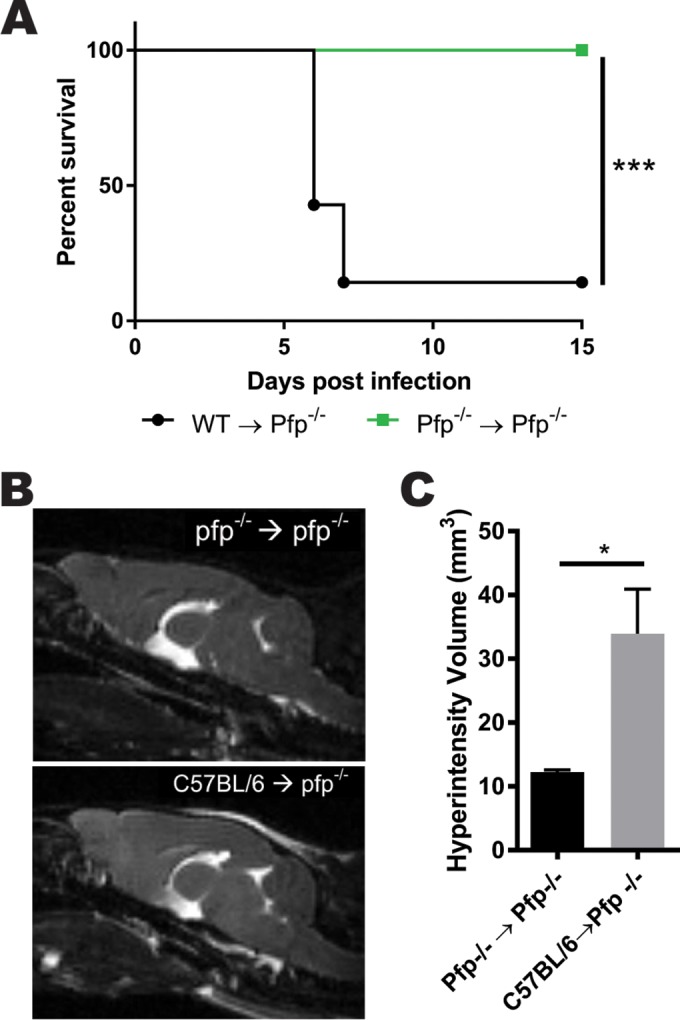
Human cerebral malaria (HCM) is a serious complication of Plasmodium falciparum infection. The most severe outcomes for patients include coma, permanent neurological deficits, and death. Recently, a large-scale magnetic resonance imaging (MRI) study in humans identified brain swelling as the most prominent predictor of fatal HCM. Therefore, in this study, we sought to define the mechanism controlling brain edema through the use of the murine experimental cerebral malaria (ECM) model. Specifically, we investigated the ability of CD8 T cells to initiate brain edema during ECM. We determined that areas of blood-brain barrier (BBB) permeability colocalized with a reduction of the cerebral endothelial cell tight-junction proteins claudin-5 and occludin. Furthermore, through small-animal MRI, we analyzed edema and vascular leakage. Using gadolinium-enhanced T1-weighted MRI, we determined that vascular permeability is not homogeneous but rather confined to specific regions of the brain. Our findings show that BBB permeability was localized within the brainstem, olfactory bulb, and lateral ventricle. Concurrently with the initiation of vascular permeability, T2-weighted MRI revealed edema and brain swelling. Importantly, ablation of the cytolytic effector molecule perforin fully protected against vascular permeability and edema. Furthermore, perforin production specifically by CD8 T cells was required to cause fatal edema during ECM. We propose that CD8 T cells initiate BBB breakdown through perforin-mediated disruption of tight junctions. In turn, leakage from the vasculature into the parenchyma causes brain swelling and edema. This results in a breakdown of homeostatic maintenance that likely contributes to ECM pathology.
Keywords: CD8 T cell; blood-brain barrier; experimental cerebral malaria; perforin.
Copyright © 2017 American Society for Microbiology.
Figures
Similar articles
-
Induction of blood brain barrier tight junction protein alterations by CD8 T cells.PLoS One. 2008 Aug 22;3(8):e3037. doi: 10.1371/journal.pone.0003037. PLoS One. 2008. PMID: 18725947 Free PMC article.
-
Perforin mediated apoptosis of cerebral microvascular endothelial cells during experimental cerebral malaria.Int J Parasitol. 2006 Apr;36(4):485-96. doi: 10.1016/j.ijpara.2005.12.005. Epub 2006 Jan 19. Int J Parasitol. 2006. PMID: 16500656
-
MRI of Iron Oxide Nanoparticles and Myeloperoxidase Activity Links Inflammation to Brain Edema in Experimental Cerebral Malaria.Radiology. 2019 Feb;290(2):359-367. doi: 10.1148/radiol.2018181051. Epub 2018 Dec 4. Radiology. 2019. PMID: 30615566
-
Theiler's murine encephalomyelitis virus as an experimental model system to study the mechanism of blood-brain barrier disruption.J Neurovirol. 2014 Apr;20(2):107-12. doi: 10.1007/s13365-013-0187-5. Epub 2013 Jul 16. J Neurovirol. 2014. PMID: 23857332 Free PMC article. Review.
-
Finding a Balance between Protection and Pathology: The Dual Role of Perforin in Human Disease.Int J Mol Sci. 2017 Jul 25;18(8):1608. doi: 10.3390/ijms18081608. Int J Mol Sci. 2017. PMID: 28757574 Free PMC article. Review.
Cited by
-
Mouse Models for Unravelling Immunology of Blood Stage Malaria.Vaccines (Basel). 2022 Sep 14;10(9):1525. doi: 10.3390/vaccines10091525. Vaccines (Basel). 2022. PMID: 36146602 Free PMC article. Review.
-
Small Molecule Inhibitors of Lymphocyte Perforin as Focused Immunosuppressants for Infection and Autoimmunity.J Med Chem. 2022 Nov 10;65(21):14305-14325. doi: 10.1021/acs.jmedchem.2c01338. Epub 2022 Oct 20. J Med Chem. 2022. PMID: 36263926 Free PMC article. Review.
-
Brain resident memory T cells rapidly expand and initiate neuroinflammatory responses following CNS viral infection.Brain Behav Immun. 2023 Aug;112:51-76. doi: 10.1016/j.bbi.2023.05.009. Epub 2023 May 24. Brain Behav Immun. 2023. PMID: 37236326 Free PMC article.
-
Protective and Pathological Immunity during Central Nervous System Infections.Immunity. 2017 Jun 20;46(6):891-909. doi: 10.1016/j.immuni.2017.06.012. Immunity. 2017. PMID: 28636958 Free PMC article. Review.
-
Localized skin inflammation during cutaneous leishmaniasis drives a chronic, systemic IFN-γ signature.PLoS Negl Trop Dis. 2021 Apr 1;15(4):e0009321. doi: 10.1371/journal.pntd.0009321. eCollection 2021 Apr. PLoS Negl Trop Dis. 2021. PMID: 33793565 Free PMC article.
References
-
- WHO. 2015. World malaria report: 2015. WHO Global Malaria Program, Geneva, Switzerland.
-
- WHO. 2000. Severe falciparum malaria. Trans R Soc Trop Med Hyg 94(Suppl 1):S1–S90. - PubMed
Publication types
MeSH terms
Substances
Grants and funding
LinkOut - more resources
Full Text Sources
Other Literature Sources
Molecular Biology Databases
Research Materials
