. 2017 Apr 21;85(5):e00053-17.
doi: 10.1128/IAI.00053-17. Print 2017 May.

Differences in the Importance of Mast Cells, Basophils, IgE, and IgG versus That of CD4+ T Cells and ILC2 Cells in Primary and Secondary Immunity to Strongyloides venezuelensis

Affiliations

Differences in the Importance of Mast Cells, Basophils, IgE, and IgG versus That of CD4+ T Cells and ILC2 Cells in Primary and Secondary Immunity to Strongyloides venezuelensis

Kaori Mukai et al. Infect Immun. .

Abstract

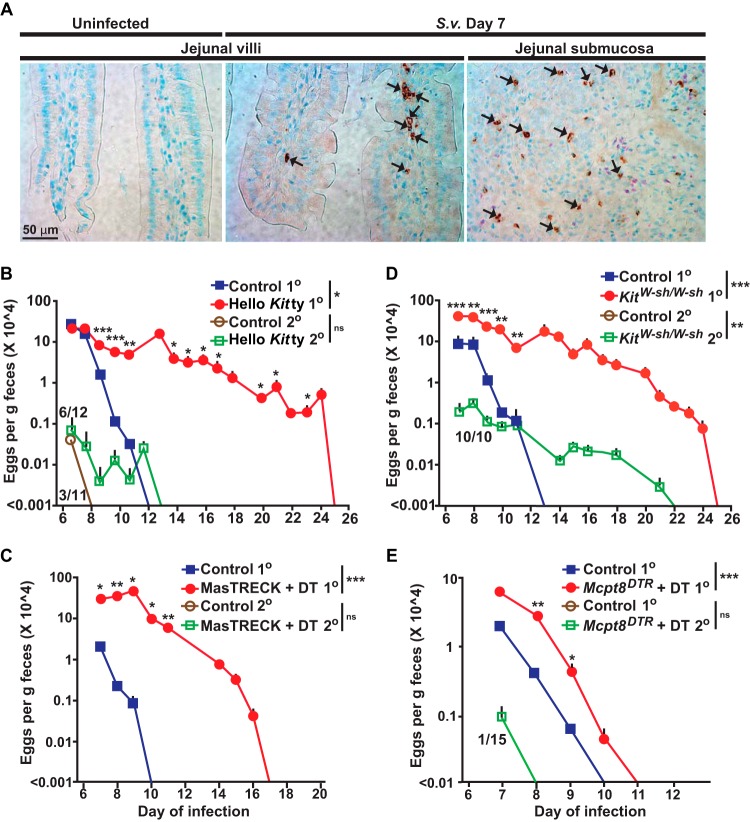
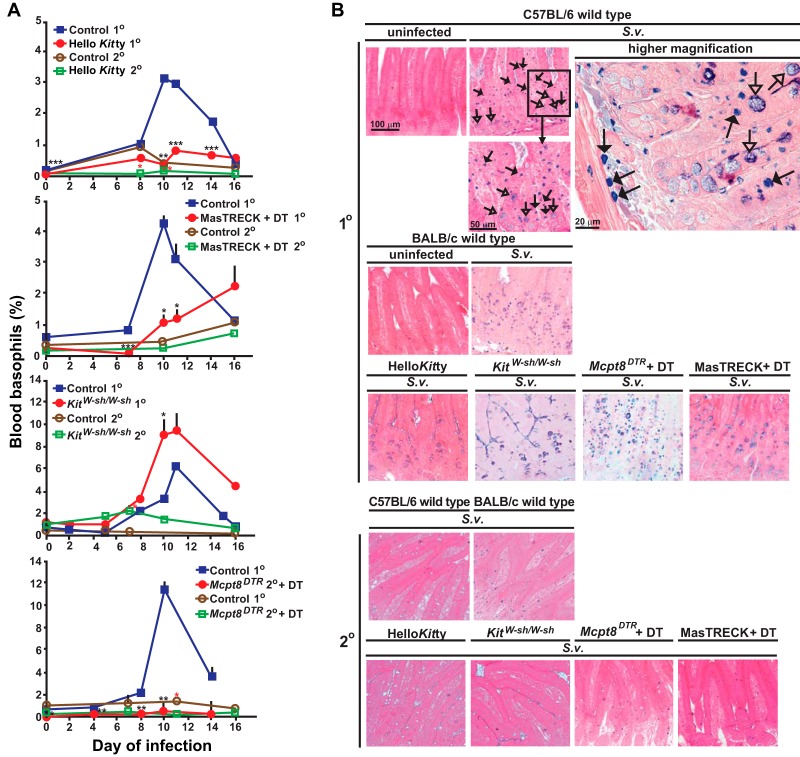
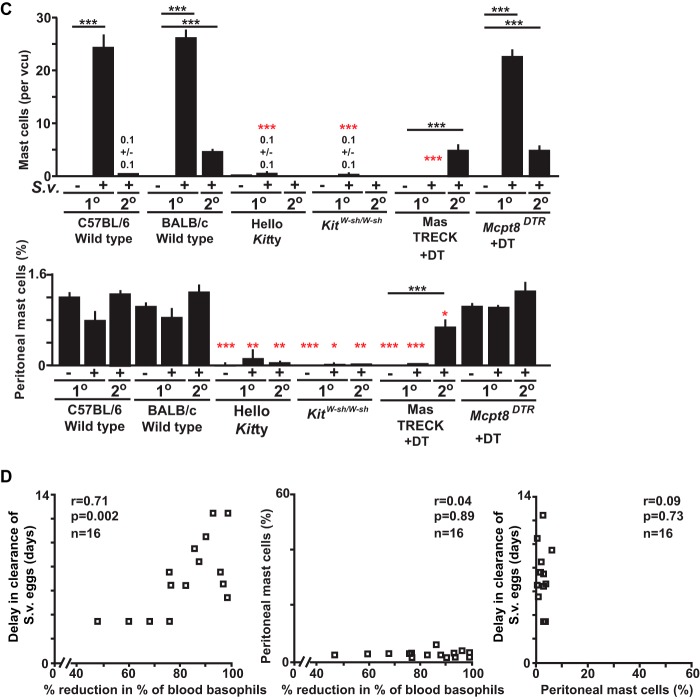
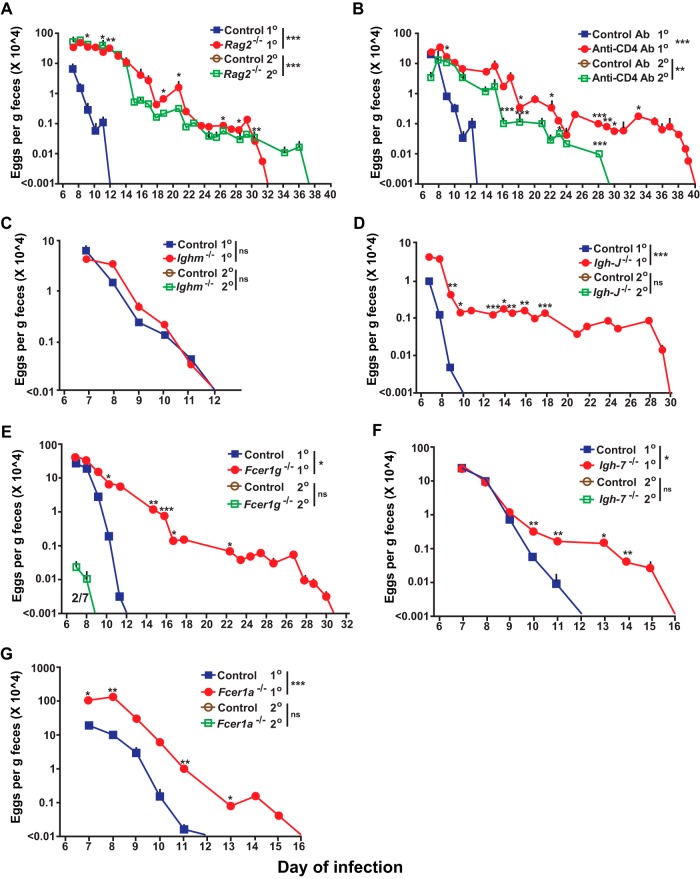
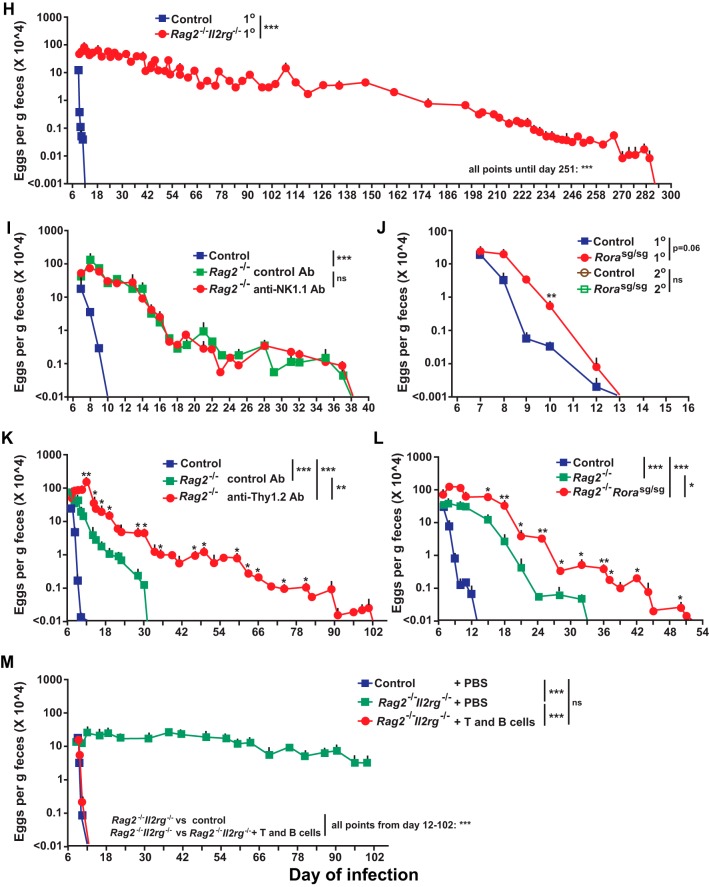
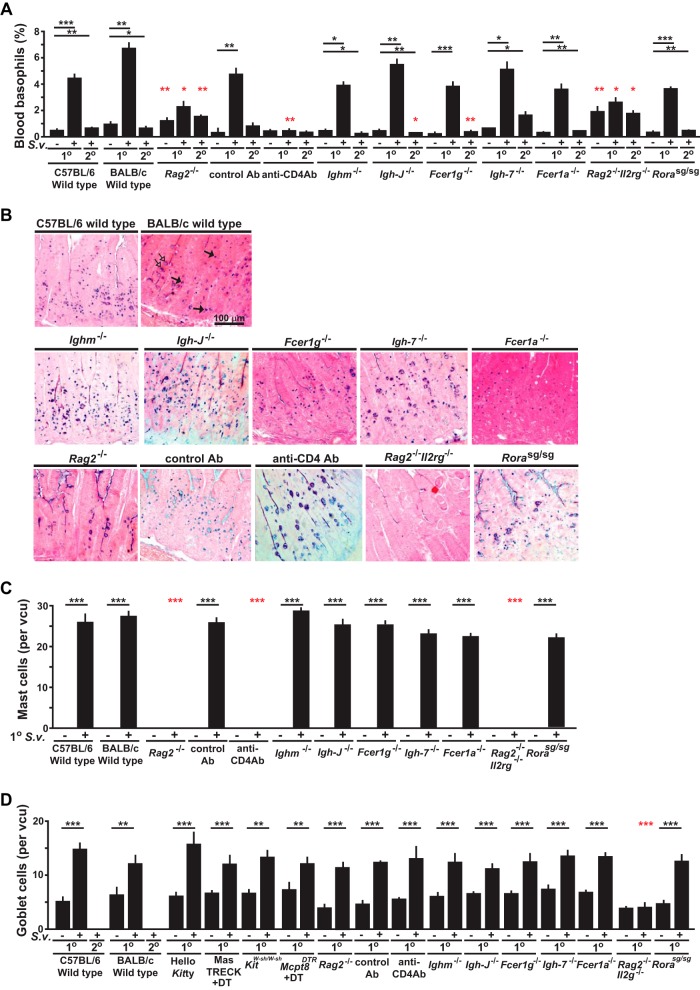
There is evidence that mast cells, basophils, and IgE can contribute to immune responses to parasites; however, the relative levels of importance of these effector elements in parasite immunity are not fully understood. Previous work in Il3-deficient and c-kit mutant KitW/W-v mice indicated that interleukin-3 and c-Kit contribute to expulsion of the intestinal nematode Strongyloides venezuelensis during primary infection. Our findings in mast cell-deficient KitW-sh/W-sh mice and two types of mast cell-deficient mice that have normal c-kit ("Hello Kitty" and MasTRECK mice) confirmed prior work in KitW/W-v mice that suggested that mast cells play an important role in S. venezuelensis egg clearance in primary infections. We also assessed a possible contribution of basophils in immune responses to S. venezuelensis By immunohistochemistry, we found that numbers of basophils and mast cells were markedly increased in the jejunal mucosa during primary infections with S. venezuelensis Studies in basophil-deficient Mcpt8DTR mice revealed a small but significant contribution of basophils to S. venezuelensis egg clearance in primary infections. Studies in mice deficient in various components of immune responses showed that CD4+ T cells and ILC2 cells, IgG, FcRγ, and, to a lesser extent, IgE and FcεRI contribute to effective immunity in primary S. venezuelensis infections. These findings support the conclusion that the hierarchy of importance of immune effector mechanisms in primary S. venezuelensis infection is as follows: CD4+ T cells/ILC2 cells, IgG, and FcRγ>mast cells>IgE and FcεRI>basophils. In contrast, in secondary S. venezuelensis infection, our evidence indicates that the presence of CD4+ T cells is of critical importance but mast cells, antibodies, and basophils have few or no nonredundant roles.

Keywords: Immunoglobulin E; basophils; mast cells; parasites.


Figures

FIG 1
FIG 1
Roles of mast cells and basophils in primary and secondary S. venezuelensis infections. (A) Immunohistochemical staining with an anti-mMCP8 Ab (DAB [3,3′-diaminobenzidine] substrate) to visualize basophils (some are indicated with small black arrows) and Giemsa counterstaining (4-μm-thick, paraffin-embedded sections) in sections of jejunum from wild-type C57BL/6 mice 7 days after inoculation with 10,000 S. venezuelensis L3. The left and middle panels are representative images from jejunal villi, and the right panel is a representative image from jejunal submucosa. S. v., S. venezuelensis. (B to E) Kinetics of S. venezuelensis egg excretion after inoculation of 10,000 S. venezuelensis L3 in primary infections (1o) or secondary infections (2o [in mice inoculated with 10,000 S. venezuelensis L3 28 days after the first inoculation]) in C57BL/6-Hello Kitty and control mice (n = 22 each) for 1o infections (7 experiments) and C57BL/6-Hello Kitty (n = 12) and control (n = 11) mice for 2o infections (4 experiments) (B), BALB/c-MasTRECK mice treated with DT (n = 5) and control mice (n = 4) for 1o infections (2 experiments) and BALB/c-MasTRECK mice treated with DT and control mice (n = 5 for each) for 2o infections (2 experiments) (C), C57BL/6-KitW-sh/W-sh and control mice (n = 9 each) for 1o infections (6 experiments) and C57BL/6-KitW-sh/W-sh (n = 10) and control (n = 3) mice for 2o infections (3 experiments) (D), and Mcpt8DTR/+ mice treated with DT (n = 26) and control mice (n = 27) for 1o infections (9 experiments) and Mcpt8DTR/+ mice treated with DT (n = 15) and control mice (n = 7) for 2o infections (2 experiments) (E). The numbers of eggs are shown as means + standard errors of the means (SEM) determined by pooling the data from all the experiments that were performed with each strain. Numerators in the fraction numbers for 2o infections indicate the number of mice for which eggs were detected, and denominators indicate the number of mice examined. Absence of fraction numbers or lines for 2o infections means that none of the mice produced detectable eggs. ***, P < 0.0001; **, P < 0.001; *, P < 0.05; no asterisks, P > 0.05 (for comparisons between each mutant mouse and the corresponding controls at each time point performed with the unpaired, two-tailed Student's t test and, as indicated next to the legend for groups of mice, with 2-way ANOVA to compare the time courses of the responses).
FIG 2
FIG 2
Changes in numbers of basophils, mast cells, and epithelial goblet cells in wild-type and mast cell- and/or basophil-deficient mice during primary and secondary S. venezuelensis infections. (A) Blood was collected from each mouse at the indicated points after S. venezuelensis infection and stained with anti-IgE and anti-CD49b. Percentages of basophils in live cells were plotted. C57BL/6-Hello Kitty (n = 21) and control (n = 22) mice were analyzed in both the 1o and 2o infections (separate groups of 21 and 22 mice, for a total of 86 mice). Data for 1o infections include those from 16/21 Hello Kitty mice and all 22 control mice in the same 7 experiments performed as described for Fig. 1, as well as 5 additional Hello Kitty mice with 1o infections which were not used as described for Fig. 1. For basophil counts in 2o infections, data are shown from all of the Hello Kitty mice (n = 11) and control mice (n = 12) reported as described for Fig. 1 plus an additional 10 Hello Kitty and 10 control mice with 2o infections. Data represent results for BALB/c-MasTRECK mice treated with DT and control mice (a mixture of DT-treated wild-type mice [n = 5] and PBS-treated BALB/c-MasTRECK mice [n = 5]) (n = 10 each for both 1o and 2o infections, for a total of 40 mice), including 5 BALB/c-MasTRECK mice treated with DT and 4 control mice for the 1o infections and 5 BALB/c-MasTRECK mice treated with DT and 5 control mice for the 2o infections. Data represent results for C57BL/6-KitW-sh/W-sh (n = 14) and control (n = 18) mice (separate groups of 14 and 18 mice for the 1o and 2o infections, for a total of 64 mice), including 9 C57BL/6-KitW-sh/W-sh and 9 control mice from the 6 experiments performed as described for Fig. 1 for the 1o infections and 3 C57BL/6-KitW-sh/W-sh and 10 control mice from the 3 experiments performed as described for Fig. 1 for the 2o infections. Data for Mcpt8DTR mice treated with DT and control mice (a mixture of DT-treated wild-type mice [n = 3] and PBS-treated Mcpt8DTR mice [n = 3]) (n = 6 each) were from the 2 experiments performed as described for Fig. 1. ***, P < 0.0005; **, P < 0.005; *, P < 0.05; no asterisks, P > 0.05. Black asterisks (for 1o infections) or red asterisks (for 2o infections) indicate the statistical significance of results of comparisons between each type of mutant mouse and the corresponding control mice for that time point. (B and C) Jejunums were collected 14 days after 1o or 2o infections. (B) Mast cells (some indicated with filled arrows) were stained with alcian blue after fixation with Carnoy's solution (open arrows indicate goblet cells). Representative tissue images are shown in panel B, and numbers of mast cells per villus crypt unit (vcu) are shown as bar graphs in panel C (upper panel, means + SEM, n = 9 to 10 each; data pooled from 3 experiments). Peritoneal fluid was collected 14 days after the start of the 1o or 2o infections, and mast cells in live cells were assessed using anti-IgE and anti-c-Kit antibodies. Percentages of peritoneal mast cells in live cells are shown as bar graphs in panel C (lower panel, means + SEM, n = 3 to 10 each; data pooled from 2 or 3 experiments). Wild-type values for comparisons to those from mutant mice were combined from corresponding controls of the same strain (C57BL/6 or BALB/c). Black asterisks, statistical significance of results of comparisons of values for uninfected mice versus 1o or 2o infected mice in the same group (as indicated by bars). Red asterisks, statistical significance of results of comparisons of values for each type of mutant mouse and the corresponding wild-type mice for that condition (i.e., uninfected or 1o or 2o infected). Actual values are noted (means ± SEM) for low numbers; absence of a bar or of numbers means that none were detected. (D) (Left panel) Correlation between the delay in achieving cessation of egg excretion (defined as 0 egg count) in each Hello Kitty mouse (compared to the average number of days for cessation of egg excretion in the corresponding wild-type mice in each experiment) (y axis) and percent reduction in the percentage of blood basophils of individual Hello Kitty mice (calculated based on the average percentage of blood basophils in the corresponding control wild-type mice in each experiment) 10 to 12 days after initiation of 1o infection with S. venezuelensis (e.g., an 80% reduction means that that Hello Kitty mouse had 20% the average percentage of basophils in the corresponding wild-type mice in that experiment]) (x axis) (n = 16). (Middle panel) Correlation between the percentage of peritoneal mast cells in that Hello Kitty mouse 18 to 20 days postinitiation of 1o infection with S. venezuelensis (y axis) and the percentage of reduction in the percentage of blood basophils of individual Hello Kitty mice (defined as for left panel) (x axis) (n = 16). (Right panel) Correlation between the delay in achieving cessation of egg excretion in each Hello Kitty mouse (defined as for left panel) (y axis) and the percentage of peritoneal mast cells in that Hello Kitty mouse 18 to 20 days after initiation of 1o infection with S. venezuelensis (x axis) (n = 16). r, correlation coefficient. The data in each panel are from the same 16 Hello Kitty mice, all of them pooled from the data for the 16 mice in the 7 experiments performed as described for Fig. 1 for which data on basophils and peritoneal mast cells were obtained.
FIG 2
FIG 2
Changes in numbers of basophils, mast cells, and epithelial goblet cells in wild-type and mast cell- and/or basophil-deficient mice during primary and secondary S. venezuelensis infections. (A) Blood was collected from each mouse at the indicated points after S. venezuelensis infection and stained with anti-IgE and anti-CD49b. Percentages of basophils in live cells were plotted. C57BL/6-Hello Kitty (n = 21) and control (n = 22) mice were analyzed in both the 1o and 2o infections (separate groups of 21 and 22 mice, for a total of 86 mice). Data for 1o infections include those from 16/21 Hello Kitty mice and all 22 control mice in the same 7 experiments performed as described for Fig. 1, as well as 5 additional Hello Kitty mice with 1o infections which were not used as described for Fig. 1. For basophil counts in 2o infections, data are shown from all of the Hello Kitty mice (n = 11) and control mice (n = 12) reported as described for Fig. 1 plus an additional 10 Hello Kitty and 10 control mice with 2o infections. Data represent results for BALB/c-MasTRECK mice treated with DT and control mice (a mixture of DT-treated wild-type mice [n = 5] and PBS-treated BALB/c-MasTRECK mice [n = 5]) (n = 10 each for both 1o and 2o infections, for a total of 40 mice), including 5 BALB/c-MasTRECK mice treated with DT and 4 control mice for the 1o infections and 5 BALB/c-MasTRECK mice treated with DT and 5 control mice for the 2o infections. Data represent results for C57BL/6-KitW-sh/W-sh (n = 14) and control (n = 18) mice (separate groups of 14 and 18 mice for the 1o and 2o infections, for a total of 64 mice), including 9 C57BL/6-KitW-sh/W-sh and 9 control mice from the 6 experiments performed as described for Fig. 1 for the 1o infections and 3 C57BL/6-KitW-sh/W-sh and 10 control mice from the 3 experiments performed as described for Fig. 1 for the 2o infections. Data for Mcpt8DTR mice treated with DT and control mice (a mixture of DT-treated wild-type mice [n = 3] and PBS-treated Mcpt8DTR mice [n = 3]) (n = 6 each) were from the 2 experiments performed as described for Fig. 1. ***, P < 0.0005; **, P < 0.005; *, P < 0.05; no asterisks, P > 0.05. Black asterisks (for 1o infections) or red asterisks (for 2o infections) indicate the statistical significance of results of comparisons between each type of mutant mouse and the corresponding control mice for that time point. (B and C) Jejunums were collected 14 days after 1o or 2o infections. (B) Mast cells (some indicated with filled arrows) were stained with alcian blue after fixation with Carnoy's solution (open arrows indicate goblet cells). Representative tissue images are shown in panel B, and numbers of mast cells per villus crypt unit (vcu) are shown as bar graphs in panel C (upper panel, means + SEM, n = 9 to 10 each; data pooled from 3 experiments). Peritoneal fluid was collected 14 days after the start of the 1o or 2o infections, and mast cells in live cells were assessed using anti-IgE and anti-c-Kit antibodies. Percentages of peritoneal mast cells in live cells are shown as bar graphs in panel C (lower panel, means + SEM, n = 3 to 10 each; data pooled from 2 or 3 experiments). Wild-type values for comparisons to those from mutant mice were combined from corresponding controls of the same strain (C57BL/6 or BALB/c). Black asterisks, statistical significance of results of comparisons of values for uninfected mice versus 1o or 2o infected mice in the same group (as indicated by bars). Red asterisks, statistical significance of results of comparisons of values for each type of mutant mouse and the corresponding wild-type mice for that condition (i.e., uninfected or 1o or 2o infected). Actual values are noted (means ± SEM) for low numbers; absence of a bar or of numbers means that none were detected. (D) (Left panel) Correlation between the delay in achieving cessation of egg excretion (defined as 0 egg count) in each Hello Kitty mouse (compared to the average number of days for cessation of egg excretion in the corresponding wild-type mice in each experiment) (y axis) and percent reduction in the percentage of blood basophils of individual Hello Kitty mice (calculated based on the average percentage of blood basophils in the corresponding control wild-type mice in each experiment) 10 to 12 days after initiation of 1o infection with S. venezuelensis (e.g., an 80% reduction means that that Hello Kitty mouse had 20% the average percentage of basophils in the corresponding wild-type mice in that experiment]) (x axis) (n = 16). (Middle panel) Correlation between the percentage of peritoneal mast cells in that Hello Kitty mouse 18 to 20 days postinitiation of 1o infection with S. venezuelensis (y axis) and the percentage of reduction in the percentage of blood basophils of individual Hello Kitty mice (defined as for left panel) (x axis) (n = 16). (Right panel) Correlation between the delay in achieving cessation of egg excretion in each Hello Kitty mouse (defined as for left panel) (y axis) and the percentage of peritoneal mast cells in that Hello Kitty mouse 18 to 20 days after initiation of 1o infection with S. venezuelensis (x axis) (n = 16). r, correlation coefficient. The data in each panel are from the same 16 Hello Kitty mice, all of them pooled from the data for the 16 mice in the 7 experiments performed as described for Fig. 1 for which data on basophils and peritoneal mast cells were obtained.
FIG 3
FIG 3
Roles of T cells, ILC2 cells, antibodies, and antibody receptors in primary and secondary S. venezuelensis infections. Analyses of kinetics of S. venezuelensis egg excretion during 1o or 2o infections after inoculation with 10,000 S. venezuelensis L3 (second inoculations with S. venezuelensis were performed 42 days [panels A, B, D, E, and I] or 28 days [C, F, G, and J] after the first inoculation) in C57BL/6-Rag2-deficient (n = 13) and control C57BL/6 (n = 4) mice for 1o infection (3 experiments) and C57BL/6-Rag2-deficient (n = 6) and control C57BL/6 (n = 4) mice for 2o infection (2 experiments) (A), C57BL/6 wild-type mice treated with an anti-CD4 antibody or an isotype-matched control antibody (n = 3 each) (2 experiments) (B), C57BL/6-Ighm-deficient (n = 9) and control C57BL/6 (n = 7) mice for 1o infection (4 experiments) and C57BL/6-Ighm-deficient and control mice for 2o infection (n = 5 each) (2 experiments) (C), BALB/c-Igh-J-deficient (n = 8) and control BALB/c (n = 5) mice for 1o infection (3 experiments) and BALB/c-Igh-J-deficient and control BALB/c mice (n = 5 each) for 2o infection (2 experiments) (D), C57BL/6-Fcer1g-deficient (n = 7) and control C57BL/6 (n = 6) mice for 1o infection (3 experiments) and C57BL/6-Fcer1g-deficient (n = 3) and control C57BL/6 (n = 7) mice for 2o infection (3 experiments) (E), BALB/c-Igh-7-deficient (n = 17) and BALB/c-Igh-7-sufficient (n = 15) mice for 1o infection (6 experiments) and BALB/c-Igh-7-deficient (n = 11) and control BALB/c (n = 3) mice for 2o infection (3 experiments) (F), C57BL/6-Fcer1a-deficient (n = 10) and control C57BL/6 (n = 8) mice for 1o infection (3 experiments) and C57BL/6-Fcer1a-deficient and control C57BL/6 mice (n = 5 each) for 2o infection (2 experiments) (G), BALB/c-Rag2Il2g doubly deficient (n = 12) and control BALB/c (n = 10) mice for 1o infection (2 experiments) (H), C57BL/6-Rag2-deficient mice injected with an anti-NK1.1 antibody or an isotype-matched control antibody (n = 3 each) for 1o infection (2 experiments) (I), C57BL/6-Rorasg/sg (n = 3) and control C57BL/6 (n = 4) mice for 1o infection (2 experiments) and C57BL/6-Rorasg/sg (n = 4) and control C57BL/6 (n = 3) mice for 2o infection (2 experiments) (J), C57BL/6-Rag2-deficient mice injected with an anti-Thy1.2 antibody or an isotype-matched control antibody (n = 3 each) for 1o infection (2 experiments) (K), C57BL/6-Rag2-deficient mice (n = 5) and C57BL/6-Rag2-deficient Rorasg/sg mice (n = 3) and the corresponding wild-type C57BL/6 (n = 3) mice for 1o infection (2 experiments) (L), and BALB/c-Rag2Il2g doubly deficient mice treated with PBS (n = 3) and BALB/c-Rag2Il2g doubly deficient mice which received splenic T and B cells from wild-type BALB/c mice (n = 3) and the corresponding control BALB/c mice treated with PBS (n = 3) for 1o infection (2 experiments) (M). The numbers of eggs are shown as means + SEM, with data derived by pooling results from all experiments performed (as indicated for each strain). The fraction number in panel E is displayed as described for Fig. 1. ***, P < 0.0001; **, P < 0.001; *, P < 0.05; no asterisks, P > 0.05 (for comparisons between each type of mutant or antibody-treated mouse or mutant mouse that received splenic T and B cells and the corresponding control mice at each time point performed with the unpaired, two-tailed Student's t test and, as indicated next to the legend for groups of mice, with 2-way ANOVA to compare the time courses of the responses).
FIG 3
FIG 3
Roles of T cells, ILC2 cells, antibodies, and antibody receptors in primary and secondary S. venezuelensis infections. Analyses of kinetics of S. venezuelensis egg excretion during 1o or 2o infections after inoculation with 10,000 S. venezuelensis L3 (second inoculations with S. venezuelensis were performed 42 days [panels A, B, D, E, and I] or 28 days [C, F, G, and J] after the first inoculation) in C57BL/6-Rag2-deficient (n = 13) and control C57BL/6 (n = 4) mice for 1o infection (3 experiments) and C57BL/6-Rag2-deficient (n = 6) and control C57BL/6 (n = 4) mice for 2o infection (2 experiments) (A), C57BL/6 wild-type mice treated with an anti-CD4 antibody or an isotype-matched control antibody (n = 3 each) (2 experiments) (B), C57BL/6-Ighm-deficient (n = 9) and control C57BL/6 (n = 7) mice for 1o infection (4 experiments) and C57BL/6-Ighm-deficient and control mice for 2o infection (n = 5 each) (2 experiments) (C), BALB/c-Igh-J-deficient (n = 8) and control BALB/c (n = 5) mice for 1o infection (3 experiments) and BALB/c-Igh-J-deficient and control BALB/c mice (n = 5 each) for 2o infection (2 experiments) (D), C57BL/6-Fcer1g-deficient (n = 7) and control C57BL/6 (n = 6) mice for 1o infection (3 experiments) and C57BL/6-Fcer1g-deficient (n = 3) and control C57BL/6 (n = 7) mice for 2o infection (3 experiments) (E), BALB/c-Igh-7-deficient (n = 17) and BALB/c-Igh-7-sufficient (n = 15) mice for 1o infection (6 experiments) and BALB/c-Igh-7-deficient (n = 11) and control BALB/c (n = 3) mice for 2o infection (3 experiments) (F), C57BL/6-Fcer1a-deficient (n = 10) and control C57BL/6 (n = 8) mice for 1o infection (3 experiments) and C57BL/6-Fcer1a-deficient and control C57BL/6 mice (n = 5 each) for 2o infection (2 experiments) (G), BALB/c-Rag2Il2g doubly deficient (n = 12) and control BALB/c (n = 10) mice for 1o infection (2 experiments) (H), C57BL/6-Rag2-deficient mice injected with an anti-NK1.1 antibody or an isotype-matched control antibody (n = 3 each) for 1o infection (2 experiments) (I), C57BL/6-Rorasg/sg (n = 3) and control C57BL/6 (n = 4) mice for 1o infection (2 experiments) and C57BL/6-Rorasg/sg (n = 4) and control C57BL/6 (n = 3) mice for 2o infection (2 experiments) (J), C57BL/6-Rag2-deficient mice injected with an anti-Thy1.2 antibody or an isotype-matched control antibody (n = 3 each) for 1o infection (2 experiments) (K), C57BL/6-Rag2-deficient mice (n = 5) and C57BL/6-Rag2-deficient Rorasg/sg mice (n = 3) and the corresponding wild-type C57BL/6 (n = 3) mice for 1o infection (2 experiments) (L), and BALB/c-Rag2Il2g doubly deficient mice treated with PBS (n = 3) and BALB/c-Rag2Il2g doubly deficient mice which received splenic T and B cells from wild-type BALB/c mice (n = 3) and the corresponding control BALB/c mice treated with PBS (n = 3) for 1o infection (2 experiments) (M). The numbers of eggs are shown as means + SEM, with data derived by pooling results from all experiments performed (as indicated for each strain). The fraction number in panel E is displayed as described for Fig. 1. ***, P < 0.0001; **, P < 0.001; *, P < 0.05; no asterisks, P > 0.05 (for comparisons between each type of mutant or antibody-treated mouse or mutant mouse that received splenic T and B cells and the corresponding control mice at each time point performed with the unpaired, two-tailed Student's t test and, as indicated next to the legend for groups of mice, with 2-way ANOVA to compare the time courses of the responses).
FIG 4
FIG 4
Changes in numbers of basophils, mast cells, and epithelial goblet cells in mice deficient in various components of immune responses during primary and secondary S. venezuelensis infections. (A) Blood was collected from each mouse during all of the experiments performed as described for Fig. 3A to J before infection or 10 to 12 days after 1o or 2o S. venezuelensis infections and stained with anti-IgE and anti-CD49b. Percentages of basophils in live cells are shown as bar graphs with means + SEM. ***, P < 0.0005; **, P < 0.005; *, P > 0.05; no asterisks, P > 0.05. Black asterisks indicate the statistical significance of results of comparisons between values for uninfected mice and 1o or 2o infected mice in the same group (as indicated by bars). Red asterisks indicate the statistical significance of results of comparisons between each type of mutant or anti-CD4 Ab-treated mouse and the corresponding control mice for that condition. (B to D) Jejunums were collected 14 days after the start of 1o infections, and sections of jejunum were stained as described for Fig. 2B (in the panel showing the histology in BALB/c wild-type mice, some of the mast cells are indicated with filled arrows and some of the goblet cells are indicated with open arrows) (B), and numbers of mast cells (C) or goblet cells (D) per villus crypt unit (vcu) are shown as bar graphs (n = 4 to 12 each; data were combined from 2 or 3 experiments). Wild-type values for comparisons to those from mutant mice were combined from corresponding controls of the same strain (C57BL/6 or BALB/c).

Similar articles

Cited by

References

    1. Bethony J, Brooker S, Albonico M, Geiger SM, Loukas A, Diemert D, Hotez PJ. 2006. Soil-transmitted helminth infections: ascariasis, trichuriasis, and hookworm. Lancet 367:1521–1532. doi:10.1016/S0140-6736(06)68653-4. - DOI - PubMed
    1. Taylor MJ, Hoerauf A, Bockarie M. 2010. Lymphatic filariasis and onchocerciasis. Lancet 376:1175–1185. doi:10.1016/S0140-6736(10)60586-7. - DOI - PubMed
    1. Grove DI. 1996. Human strongyloidiasis. Adv Parasitol 38:251–309. doi:10.1016/S0065-308X(08)60036-6. - DOI - PubMed
    1. Nawa Y, Kiyota M, Korenaga M. 1985. Defective protective capacity of W/Wv mice against Strongyloides ratti infection and its reconstitution with bone marrow cells. Parasite Immunol 7:429–438. doi:10.1111/j.1365-3024.1985.tb00088.x. - DOI - PubMed
    1. Abe T, Sugaya H, Ishida K, Khan WI, Tasdemir I, Yoshimura K. 1993. Intestinal protection against Strongyloides ratti and mastocytosis induced by administration of interleukin-3 in mice. Immunology 80:116–121. - PMC - PubMed

Publication types

LinkOut - more resources