

Cooperation of Gastric Mononuclear Phagocytes with Helicobacter pylori during Colonization
- PMID: 28264969
- PMCID: PMC5380565
- DOI: 10.4049/jimmunol.1601902
Cooperation of Gastric Mononuclear Phagocytes with Helicobacter pylori during Colonization
Abstract
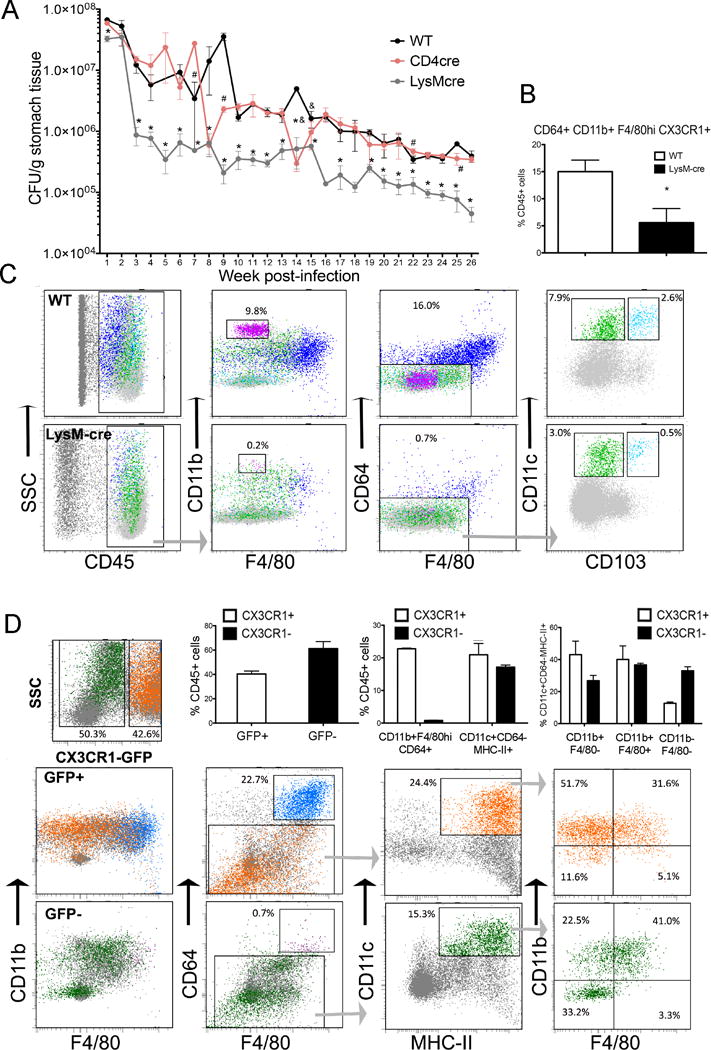
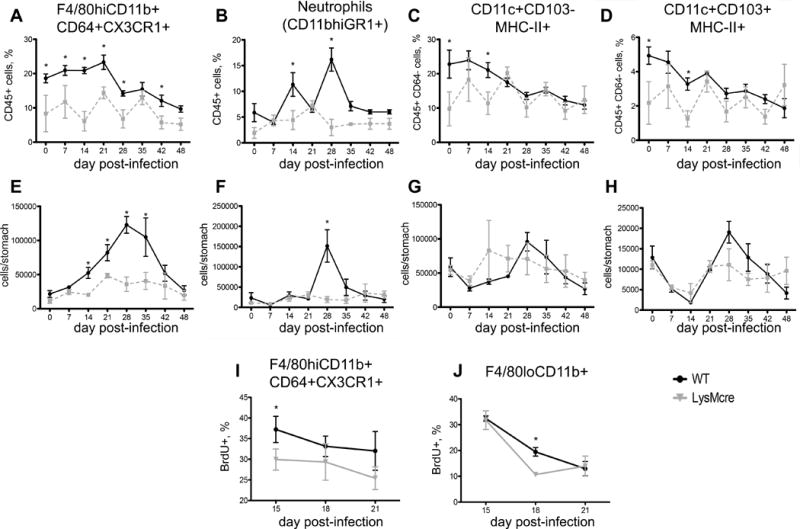
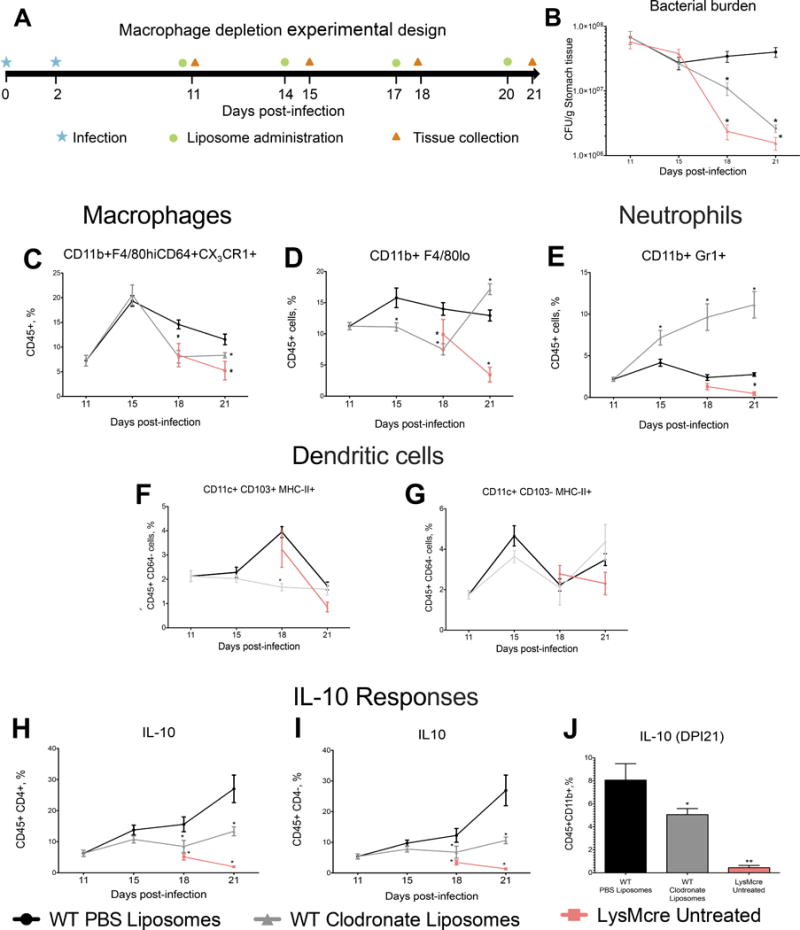
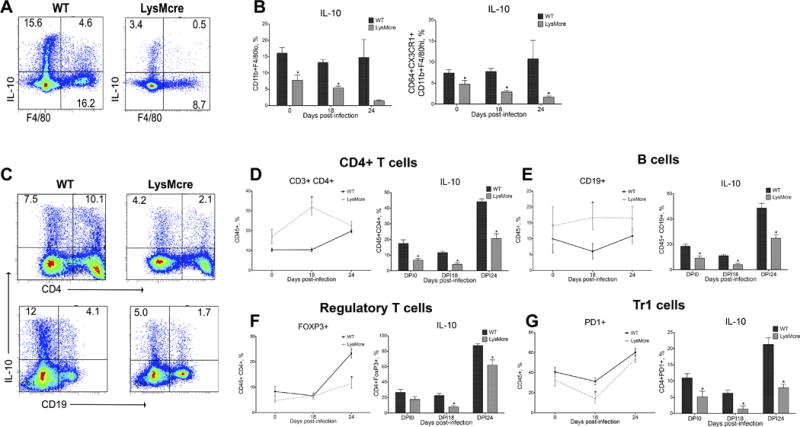
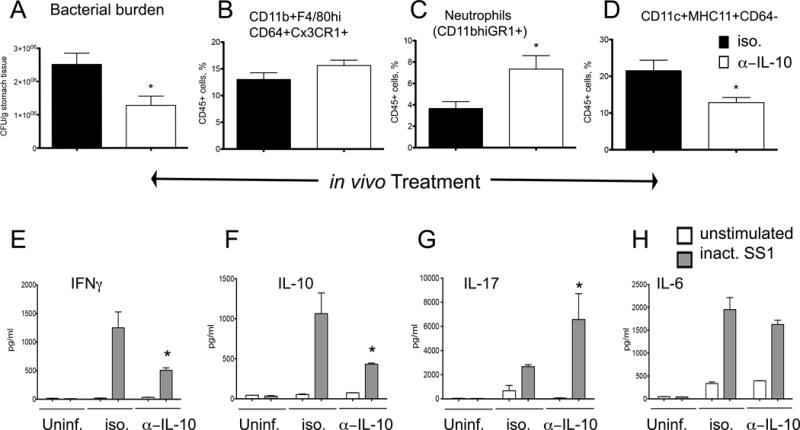
Helicobacter pylori, the dominant member of the human gastric microbiota, elicits immunoregulatory responses implicated in protective versus pathological outcomes. To evaluate the role of macrophages during infection, we employed a system with a shifted proinflammatory macrophage phenotype by deleting PPARγ in myeloid cells and found a 5- to 10-fold decrease in gastric bacterial loads. Higher levels of colonization in wild-type mice were associated with increased presence of mononuclear phagocytes and in particular with the accumulation of CD11b+F4/80hiCD64+CX3CR1+ macrophages in the gastric lamina propria. Depletion of phagocytic cells by clodronate liposomes in wild-type mice resulted in a reduction of gastric H. pylori colonization compared with nontreated mice. PPARγ-deficient and macrophage-depleted mice presented decreased IL-10-mediated myeloid and T cell regulatory responses soon after infection. IL-10 neutralization during H. pylori infection led to increased IL-17-mediated responses and increased neutrophil accumulation at the gastric mucosa. In conclusion, we report the induction of IL-10-driven regulatory responses mediated by CD11b+F4/80hiCD64+CX3CR1+ mononuclear phagocytes that contribute to maintaining high levels of H. pylori loads in the stomach by modulating effector T cell responses at the gastric mucosa.
Copyright © 2017 by The American Association of Immunologists, Inc.
Conflict of interest statement
The authors have declared that no conflict of interest exists.
Figures
Similar articles
-
Heme oxygenase-1 dysregulates macrophage polarization and the immune response to Helicobacter pylori.J Immunol. 2014 Sep 15;193(6):3013-22. doi: 10.4049/jimmunol.1401075. Epub 2014 Aug 8. J Immunol. 2014. PMID: 25108023 Free PMC article.
-
Helicobacter pylori VacA Targets Myeloid Cells in the Gastric Lamina Propria To Promote Peripherally Induced Regulatory T-Cell Differentiation and Persistent Infection.mBio. 2019 Mar 19;10(2):e00261-19. doi: 10.1128/mBio.00261-19. mBio. 2019. PMID: 30890606 Free PMC article.
-
Predictive computational modeling of the mucosal immune responses during Helicobacter pylori infection.PLoS One. 2013 Sep 5;8(9):e73365. doi: 10.1371/journal.pone.0073365. eCollection 2013. PLoS One. 2013. PMID: 24039925 Free PMC article.
-
Systems-wide analyses of mucosal immune responses to Helicobacter pylori at the interface between pathogenicity and symbiosis.Gut Microbes. 2016;7(1):3-21. doi: 10.1080/19490976.2015.1116673. Gut Microbes. 2016. PMID: 26939848 Free PMC article. Review.
-
Chemokine expression in Helicobacter pylori-infected gastric mucosa.J Gastroenterol. 1998 Oct;33(5):613-7. doi: 10.1007/s005350050146. J Gastroenterol. 1998. PMID: 9773923 Review.
Cited by
-
Genetics of Host Protection against Helicobacter pylori Infections.Int J Mol Sci. 2021 Mar 21;22(6):3192. doi: 10.3390/ijms22063192. Int J Mol Sci. 2021. PMID: 33801073 Free PMC article. Review.
-
Identification of new regulatory genes through expression pattern analysis of a global RNA-seq dataset from a Helicobacter pylori co-culture system.Sci Rep. 2020 Jul 13;10(1):11506. doi: 10.1038/s41598-020-68439-8. Sci Rep. 2020. PMID: 32661418 Free PMC article.
-
Prevotellaceae produces butyrate to alleviate PD-1/PD-L1 inhibitor-related cardiotoxicity via PPARα-CYP4X1 axis in colonic macrophages.J Exp Clin Cancer Res. 2022 Jan 3;41(1):1. doi: 10.1186/s13046-021-02201-4. J Exp Clin Cancer Res. 2022. PMID: 34980222 Free PMC article.
-
Glabridin Prevents Doxorubicin-Induced Cardiotoxicity Through Gut Microbiota Modulation and Colonic Macrophage Polarization in Mice.Front Pharmacol. 2019 Feb 15;10:107. doi: 10.3389/fphar.2019.00107. eCollection 2019. Front Pharmacol. 2019. PMID: 30833897 Free PMC article.
-
Targeting the Adaptive Immune System in Depression: Focus on T Helper 17 Cells.Pharmacol Rev. 2022 Apr;74(2):373-386. doi: 10.1124/pharmrev.120.000256. Pharmacol Rev. 2022. PMID: 35302045 Free PMC article. Review.
References
-
- Stolte M. Helicobacter pylori gastritis and gastric MALT-lymphoma. Lancet. 1992;339:745–746. - PubMed
-
- Suerbaum S, Michetti P. Helicobacter pylori infection. N Engl J Med. 2002;347:1175–1186. - PubMed
-
- Amieva MR, El-Omar EM. Host-bacterial interactions in Helicobacter pylori infection. Gastroenterology. 2008;134:306–323. - PubMed
MeSH terms
Grants and funding
LinkOut - more resources
Full Text Sources
Other Literature Sources
Medical
Molecular Biology Databases
Research Materials
