. 2017 Apr 5;37(14):3741-3752.
doi: 10.1523/JNEUROSCI.2923-16.2017. Epub 2017 Mar 6.

A PTEN-Regulated Checkpoint Controls Surface Delivery of δ Opioid Receptors

Affiliations

A PTEN-Regulated Checkpoint Controls Surface Delivery of δ Opioid Receptors

Daniel J Shiwarski et al. J Neurosci. .

Abstract

The δ opioid receptor (δR) is a promising alternate target for pain management because δR agonists show decreased abuse potential compared with current opioid analgesics that target the μ opioid receptor. A critical limitation in developing δR as an analgesic target, however, is that δR agonists show relatively low efficacy in vivo, requiring the use of high doses that often cause adverse effects, such as convulsions. Here we tested whether intracellular retention of δR in sensory neurons contributes to this low δR agonist efficacy in vivo by limiting surface δR expression. Using direct visualization of δR trafficking and localization, we define a phosphatase and tensin homolog (PTEN)-regulated checkpoint that retains δR in the Golgi and decreases surface delivery in rat and mice sensory neurons. PTEN inhibition releases δR from this checkpoint and stimulates delivery of exogenous and endogenous δR to the neuronal surface both in vitro and in vivo PTEN inhibition in vivo increases the percentage of TG neurons expressing δR on the surface and allows efficient δR-mediated antihyperalgesia in mice. Together, we define a critical role for PTEN in regulating the surface delivery and bioavailability of the δR, explain the low efficacy of δR agonists in vivo, and provide evidence that active δR relocation is a viable strategy to increase δR antinociception.SIGNIFICANCE STATEMENT Opioid analgesics, such as morphine, which target the μ opioid receptor (μR), have been the mainstay of pain management, but their use is highly limited by adverse effects and their variable efficacy in chronic pain. Identifying alternate analgesic targets is therefore of great significance. Although the δ opioid receptor (δR) is an attractive option, a critical limiting factor in developing δR as a target has been the low efficacy of δR agonists. Why δR agonists show low efficacy is still under debate. This study provides mechanistic and functional data that intracellular localization of δR in neurons is a key factor that contributes to low agonist efficacy, and presents a proof of mechanism that relocating δR improves efficacy.

Keywords: Golgi export; exocytosis; nociception; opioid; trafficking.


Figures

Figure 1.
Figure 1.
PTEN inhibition releases Golgi-retained δR and promotes surface delivery in PC12 cells. A, Example images of PC12 cells showing surface δR expression (red in merge) and intracellular accumulation of FLAG-δR (arrow) after NGF treatment (60 min at 100 ng/ml), colocalizing with TGN-38 (Golgi, green in merge). B, Quantitation showing an increase in the percentage of cells with δR Golgi localization after NGF (n >100 cells each). Data are mean ± SEM. ****p < 0.0001. C, Example image of a PC12 cell showing surface FLAG-μR as a control. NGF treatment (60 min at 100 ng/ml) causes no internal μR accumulation. D, Quantitation showing that NGF does not increase the percentage of cells showing μR retention (n >50 cells each). Data are mean ± SEM. E, NGF-treated PC12 cells, chased with cycloheximide (CHX) for 1 h in the presence and absence of NGF, to isolate the effect of NGF independent of δR biosynthesis and transport. The percentage of cells with Golgi-localized δR is shown (n >100 cells in each condition). Data are mean ± SEM. ****p < 0.0001, CHX treatments with NGF versus without NGF. F, Example images for control and NGF-treated PC12 cells with inhibition of PTEN by 10 μm of SF1670 (SF), bpV HOptic (bpV(H)), or bpV (Phen) (bpV(P)). PTEN inhibition abolishes Golgi retention of δR. G, A dose-dependent effect of SF1670-mediated loss of Golgi-localized δR in NGF-treated PC12 cells. H, Image analysis and quantification show a significant reduction in the percentage of total δR fluorescence that overlaps with the Golgi upon PTEN inhibition (n >100 cells each). Data are mean ± SEM. ***p < 0.001.
Figure 2.
Figure 2.
PTEN inhibition releases Golgi-retained δR and promotes surface delivery in TG neurons. A, Example immunofluorescence images demonstrating the localization of expressed FLAG-δR in mouse TG neurons with or without NGF (100 ng/ml for 1 h), with and without the PTEN inhibitor (SF1670, 10 μm). PTEN inhibition drives δR to the surface. B, The fraction of Golgi-localized δR in primary TG neurons decreased significantly upon PTEN inhibition (SF1670, 10 μm) (n >10 neurons each). Data are mean ± SEM. **p < 0.01. ***p < 0.001. C, Pearson's correlation coefficients show decreased colocalization between δR and the Golgi upon SF1670 addition (n >10 neurons each). Data are mean ± SEM. *p < 0.05. D, Example immunofluorescence images of expressed FLAG-μR in mouse TG neurons with or without NGF (100 ng/ml for 1 h). μR was localized to the surface with minimal intracellular fluorescence. E, Example frames from a live-cell movie of mouse TG neurons expressing GFP-δR before and after addition of PTEN inhibitor bpV(Phen) (10 μm). F, Radial profile analysis of the images (schematic) revealed a decrease in the fluorescence intensity of the center and an increase in the periphery over time following PTEN inhibition (added at t = 1 min). Time is depicted as a color gradient from red to blue. G, PTEN inhibition causes an increase in GFP-δR fluorescence on the surface and a decrease in fluorescence in Golgi regions. H, Quantitation across multiple neurons shows a decrease in the percentage of intracellular δR normalized to the total cell fluorescence (n = 10). Data are mean ± SEM. **p < 0.01. Scale bars, 5 μm.
Figure 3.
Figure 3.
The δR delivered to the surface by PTEN inhibition is competent to inhibit cAMP. A, Schematic of ratiometric analysis for cAMP measurement using the Epac sensor. The CFP, FRET, and FLAG-δR were imaged and followed live in the same PC12 cells. FRET ratio image is mapped to blue for low cAMP and red for high cAMP. B, Inhibition of Fsk-mediated increases in cAMP by DADLE was measured as an index of the activity of surface δR. In NGF-treated PC12 cells, DADLE-mediated inhibition was significantly enhanced by PTEN inhibition (SF1670, 10 μm), as seen by a lower Fsk response (n >15 each). Data are mean ± SEM. **p < 0.01. C, Schematic of experiments to isolate the functional effect of δR delivery by PTEN inhibition after surface δR is blocked by CNA (1 μm). D, The percentage of inhibition of cAMP response under the four conditions shows recovery of DADLE-mediated inhibition by PTEN inhibition after surface δR is blocked by CNA, and that the inhibition requires δR. Data are mean ± SEM. ****p < 0.0001. E–J, Example images (E, G, I) from a time lapse movie showing FRET changes and δR localization after DADLE in the three experimental conditions. The average FRET change (F, H, J) over time from multiple cells for each experimental condition is shown. Red lines indicate curve fits for the Fsk response, DADLE response, and desensitization, over time. Error bars indicate SEM. Scale bars, 5 μm.
Figure 4.
Figure 4.
PTEN inhibition increases the functional pool of endogenous δR in TG neurons. A, Example calcium current traces from a voltage-clamped rat TG neuron after PTEN inhibition, before and after SNC80, showing robust decrease in current after SNC80. B, Time course of decrease in current after SNC80 bath application to a TG neuron after PTEN inhibition. C, Live imaging of calcium transients of rat TG neurons in response to high K, detected by fura-2 AM loading. D, E, Example traces of fura-2 AM responses showing a neuron that is nonresponsive to SNC80 (D) and one that is responsive (E). F, Quantification of the fraction of neurons that respond to SNC80 with and without pretreatment with bpV(Phen). The number of cells in each condition is noted. PTEN inhibition induced a significant increase in the fraction of neurons that respond to SNC80. ****p < 0.0001.
Figure 5.
Figure 5.
PTEN inhibition increases the functional surface pool of endogenous δR in TG neurons in vivo. A, Structure of the δR-specific agonist Deltorphin II C-terminally conjugated to Cy3. The final UPLC purification spectrum is shown below and demonstrates a single pure product peak. B, Example images (of n = 3 independent experiments) are shown of cultured mouse TG neurons that were preincubated with delt-Cy3 for 10 min following 1 h control and PTEN inhibitor (bpv(Phen) 10 μm) treatment conditions. Scale bars, 5 μm. C, Quantitation across multiple cells shows that the delt-Cy3 fluorescence integrated density per cell increases following PTEN inhibition (Control, n = 10 neurons; bpV(H), n = 29 neurons). Data are mean ± SEM. *p < 0.05 (two-sided t test vs Control). D, The number of delt-Cy3-positive endosomes per neuron increased following PTEN inhibition (Control, n = 10 neurons; bpV(H), n = 29 neurons). Data are mean ± SEM. ***p < 0.001 (two-sided t test vs Control). E, Mice were injected subcutaneously with saline as a control or the PTEN inhibitor bpV(Phen) (3 mg/kg). TG neurons were isolated 2, 4, and 6 h after injection. Representative images are shown for cells labeled live with Hoechst DNA stain (blue) and Deltorphin II-Cy3 (red). Scale bars, 15 μm. F, Quantitation shows a significant increase in the fraction of delt-Cy3-positive cells 4 and 6 h after PTEN inhibition (contingency plot is shown; saline, n = 234 neurons; bpV(H) 2 h, n = 94 neurons; bpV(H) 4 h, n = 132 neurons; bpV(H) 6 h, n = 147 neurons). ****p < 0.0001. n.s., Not significant (p > 0.05, by Fisher Exact test vs saline).
Figure 6.
Figure 6.
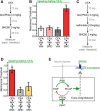
PTEN inhibition unmasks the antihyperalgesic efficacy of the δR agonist SNC80. A, The threshold for mechanical hyperalgesia was determined using a manual von Frey hair, in mice after intraplantar injection of CFA. A schematic shows the timeline and doses used in our experiments. B, Mechanical thresholds in mice show that pretreatment with PTEN inhibitor unmasked the antihyperalgesic effects of SNC80 (mean ± SEM). **p < 0.01. SNC80 or bpv (Phen) on their own did not show antihyperalgesia compared with control vehicle-injected mice. The mechanical threshold before CFA treatment was used as baseline (green dashed line). C, A schematic showing the timeline and doses used in testing whether naltrindole blocks the bpV(Phen)-mediated increase in SNC80 efficacy. D, Naltrindole abolishes the increase in SNC80-mediated antihyperalgesia caused by PTEN inhibition (mean ± SEM). **p < 0.01. E, Proposed model for how PTEN/PI3K balance provides a Golgi checkpoint to regulate δR export and surface availability. Following neuronal signals, such as NGF, δR is retained within the TGN due to disruption of the 3′ phosphoinositide balance by either inhibiting PI3K or increasing PTEN activity. By blocking PTEN activity via pharmacologic inhibition, 3′ phosphorylation of phosphoinositides is maintained and δR surface trafficking is stimulated. Increased δR surface trafficking via PTEN inhibition results in greater receptor surface localization, increased agonist-induced δR function, and unmasks the antihyperalgesic effects of SNC80.

Similar articles

Cited by

References

    1. Arévalo JC, Wu SH, Takahashi T, Zhang H, Yu T, Yano H, Milner TA, Tessarollo L, Ninan I, Arancio O, Chao MV (2010) The ARMS/Kidins220 scaffold protein modulates synaptic transmission. Mol Cell Neurosci 45:92–100. 10.1016/j.mcn.2010.06.002 - DOI - PMC - PubMed
    1. Arttamangkul S, Alvarez-Maubecin V, Thomas G, Williams JT, Grandy DK (2000) Binding and internalization of fluorescent opioid peptide conjugates in living cells. Mol Pharmacol 58:1570–1580. 10.1124/mol.58.6.1570 - DOI - PubMed
    1. Arttamangkul S, Quillinan N, Low MJ, von Zastrow M, Pintar J, Williams JT (2008) Differential activation and trafficking of micro-opioid receptors in brain slices. Mol Pharmacol 74:972–979. 10.1124/mol.108.048512 - DOI - PMC - PubMed
    1. Balla T, Wymann M, York JD (2012) Phosphoinositides I: Enzymes of synthesis and degradation. New York: Springer.
    1. Bao L, Jin SX, Zhang C, Wang LH, Xu ZZ, Zhang FX, Wang LC, Ning FS, Cai HJ, Guan JS, Xiao HS, Xu ZQ, He C, Hökfelt T, Zhou Z, Zhang X (2003) Activation of δ opioid receptors induces receptor insertion and neuropeptide secretion. Neuron 37:121–133. 10.1016/S0896-6273(02)01103-0 - DOI - PubMed

Publication types

MeSH terms

LinkOut - more resources