. 2017 Mar 29;37(13):3568-3587.
doi: 10.1523/JNEUROSCI.2841-16.2017. Epub 2017 Mar 6.

Deletion of the Fractalkine Receptor, CX3CR1, Improves Endogenous Repair, Axon Sprouting, and Synaptogenesis after Spinal Cord Injury in Mice

Affiliations

Deletion of the Fractalkine Receptor, CX3CR1, Improves Endogenous Repair, Axon Sprouting, and Synaptogenesis after Spinal Cord Injury in Mice

Camila M Freria et al. J Neurosci. .

Abstract

Impaired signaling via CX3CR1, the fractalkine receptor, promotes recovery after traumatic spinal contusion injury in mice, a benefit achieved in part by reducing macrophage-mediated injury at the lesion epicenter. Here, we tested the hypothesis that CX3CR1-dependent changes in microglia and macrophage functions also will enhance neuroplasticity, at and several segments below the injury epicenter. New data show that in the presence of inflammatory stimuli, CX3CR1-deficient (CX3CR1-/-) microglia and macrophages adopt a reparative phenotype and increase expression of genes that encode neurotrophic and gliogenic proteins. At the lesion epicenter (mid-thoracic spinal cord), the microenvironment created by CX3CR1-/- microglia/macrophages enhances NG2 cell responses, axon sparing, and sprouting of serotonergic axons. In lumbar spinal cord, inflammatory signaling is reduced in CX3CR1-/- microglia. This is associated with reduced dendritic pathology and improved axonal and synaptic plasticity on ventral horn motor neurons. Together, these data indicate that CX3CR1, a microglia-specific chemokine receptor, is a novel therapeutic target for enhancing neuroplasticity and recovery after SCI. Interventions that specifically target CX3CR1 could reduce the adverse effects of inflammation and augment activity-dependent plasticity and restoration of function. Indeed, limiting CX3CR1-dependent signaling could improve rehabilitation and spinal learning.SIGNIFICANCE STATEMENT Published data show that genetic deletion of CX3CR1, a microglia-specific chemokine receptor, promotes recovery after traumatic spinal cord injury in mice, a benefit achieved in part by reducing macrophage-mediated injury at the lesion epicenter. Data in the current manuscript indicate that CX3CR1 deletion changes microglia and macrophage function, creating a tissue microenvironment that enhances endogenous repair and indices of neuroplasticity, at and several segments below the injury epicenter. Interventions that specifically target CX3CR1 might be used in the future to reduce the adverse effects of intraspinal inflammation and augment activity-dependent plasticity (e.g., rehabilitation) and restoration of function.

Keywords: CX3CR1; inflammation; macrophages; microglia; plasticity; spinal cord injury.


Figures

Figure 1.
Figure 1.
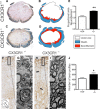
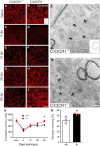
Impaired CX3CR1 signaling confers neuroprotection (myelin and axons) and enhances endogenous repair after SCI. A–D, Eriochrome cyanine (EC, blue) and neurofilament (NF200, brown) labeling in CX3CR1+/+ and CX3CR1−/− mice at 56 dpi. Light microscopic images from representative mice (A, C) and schematic maps of those images illustrate the mean differences in spared myelin (EC) and axon (NF+ immunoreactivity) area. E, Greater NF labeling was observed in CX3CR1−/− mice at 8 weeks after injury. F, H, Representative images of NF labeling in CX3CR1−/− (F) and CX3CR1+/− mice (H) ∼0.8 mm caudal to the lesion site. G, I, Electron microscopic images of sections cut from tissue blocks adjacent to those used in F, H confirm genotype-dependent differences in axon sparing (G, CX3CR1+/−; I, CX3CR1−/−). F, H, Boxed regions represent the regions of spared white matter from which images in G, I were captured. J, Numbers of NF+ axon profiles (“streamers”) were measured (arrows in H; ∼4–10 μm in length) within regions between spared myelinated axons and central gray matter in the lesion core. NF+ axon profiles were increased significantly in CX3CR1−/− spinal cord sections. Graphs are representative of single independent experiments (n = 5 +/+ and n = 6 −/− mice/group). *p < 0.05 (Student's unpaired two-tailed t test). **p < 0.01 (Student's unpaired two-tailed t test). Scale bars: H, 5 μm; I, 50 μm. Data are mean ± SEM.
Figure 2.
Figure 2.
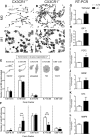
Inflammatory stimuli elicit a tissue-repair phenotype in CX3CR1−/− macrophages. A–D, Morphology (phalloidin stain for actin) of control (unstimulated) (A, B) macrophages or macrophages activated with inflammatory stimuli (IFNγ + LPS) (C, D). Inflammatory macrophages are easily distinguished by their large, flattened cell bodies with few filipodia. E, F, Genotype-specific changes in responsiveness of macrophages to inflammatory signals. Although CX3CR1 deletion has no effect on resting (unstimulated/M0) macrophage morphologies (E), only CX3CR1 WT (+/+) macrophages consistently show dramatic FF changes (indicative of activation) in response to inflammatory signaling (F). G–L, qRT-PCR analyses of inflammatory macrophages generated from +/+ or −/− mice. Graphs are mean data from one of three independent replicate experiments. Data were calculated using the ΔΔCt method (gene/18S ratio for control unstimulated macrophages). Inflammatory macrophages derived from −/− mice show higher expression of genes encoding neurotrophic and gliogenic proteins. Data are mean ± SEM obtained from n = 3 replicate wells/group. *p < 0.05 (Student's unpaired two-tailed t test). **p < 0.01 (Student's unpaired two-tailed t test).
Figure 3.
Figure 3.
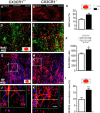
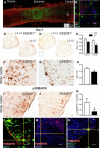
CX3CR1−/− macrophages create an environment that supports NG2 glia and the growth or stability of axons. A, B, NG2 staining of horizontal spinal cord sections from (A) CX3CR1+/+ or (B) CX3CR1−/− mice at 56 dpi. C, Graph represents area of NG2 labeling in a 302 μm2 box centered on the epicenter. Schematic indicates measurement area. D, E, Double-labeling for BrdU (red) and NG2+ cells (green) near the lesion border. F, Total number of NG2+/BrdU+ cells in a 1 mm section centered over the epicenter. Cells were quantified through the dorsoventral axis of the spinal cord in multiple planes of section as illustrated in the schematic. G–K, Double-labeling of neurofilament (blue) and NG2 (red) at the rostral interface of the lesion epicenter. I, Percentage area of NG2 and NF colocalization. Schematic of spinal cord indicates measurement area. J, K, High-power magnifications of boxes in G, H. Note NG2+ cells wrapping axons (K). Scale bars: B, 150 μm; D, E, 20 μm; G, H, 30 μm; J, K, 10 μm. Graphs are representative of a single experiment. Data are mean ± SEM; n = 5 +/+ and n = 4 −/− mice/group. *p < 0.05 (Student's unpaired two-tailed t test). **p < 0.01 (Student's unpaired two-tailed t test).
Figure 4.
Figure 4.
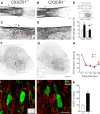
The density and distribution of serotonergic (5-HT) axons increase at and below the injury epicenter in SCI CX3CR1−/− mice. A, B, Representative horizontal sections from CX3CR1+/+ (A, C) and CX3CR1−/− (B, D) mice. Rostrocaudal orientation is left-to-right. C, D, High-magnification images of boxes in A, B. C, D, Red asterisks indicate lesion epicenter. Note the higher density of 5-HT+ axons at the rostral interface in CX3CR1−/− mice. E, Schematic illustrates the horizontal planes through the dorsoventral axis of the spinal cord where 5-HT immunoreactivity was quantified. Graph represents average 5-HT density across three horizontal sections both rostral and at the lesion epicenter. F, G, Lumbar spinal hemi-cords showing 5-HT labeling in transverse sections in CX3CR1+/+ (F) and CX3CR1−/− mice (G). H, Quantification of 5-HT density in the ventral horn as a function of time postinjury. I, J, High-power images of boxes in F, G. K, The number of 5-HT+ profiles in lumbar ventral horn. E, H, Graphs were generated from single experiments and were analyzed using two-way ANOVA with Bonferroni post tests. *p < 0.05. **p < 0.01. G, n = 5 +/+ and 5−/− mice/group. H, n = 3 mice at day 0 and n = 4/group at 4, 14, 28, and 56 dpi. K, Representative graph from two independent experiments using n = 5 +/+ and −/− mice/group each time. ***p < 0.001 (Student's unpaired two-tailed t test). Scale bars: B, 250 μm; D, 200 μm; G, 100 μm; J, 40 μm. Data are mean ± SEM.
Figure 5.
Figure 5.
Synaptic plasticity is enhanced in spinal cord lumbar ventral horn after SCI in CX3CR1−/− mice. Representative images illustrate time-dependent changes in synapsin labeling in lumbar spinal cord of CX3CR1+/+ (A, C, E, G, I) and CX3CR1−/− (B, D, F, H, J) mice. K, Quantification of synapsin-positive puncta as a function of time after SCI within ventral horn. L, M, Ultrastructural images of synapses apposed to lumbar motor neurons in CX3CR1+/− (L) and CX3CR1−/− (M) mice. Asterisks indicate motor neuron cytoplasm. Arrows indicate presynaptic receptors contacting motor neuron surfaces. N, Percentage of motor neuron circumference covered by synapses. K, N, Graphs generated from independent experiments, in (K) naive and 4 dpi, n = 3 +/+ and −/− mice/group; 14 dpi, n = 5/group; 28 and 56 dpi, n = 5/group and n = 4/group. N, n = 3 mice/group. K, Data analyzed using two-way ANOVA with Bonferroni post tests. N, Data were analyzed using Student's unpaired two-tailed t test. *p < 0.05. Scale bars: J, 20 μm; M, 0.5 μm. Data are mean ± SEM.
Figure 6.
Figure 6.
Plasticity of inhibitory synapses is enhanced in spinal cord lumbar ventral horn after SCI in CX3CR1−/− mice. GAD67 labeling in transverse sections in the lumbar (L3/L4) spinal cord of (A) naive, (B) CX3CR1+/+, and (C) CX3CR1−/− mice at 56 dpi. D, Quantification of GAD67+ synaptic puncta in the ventral horn of CX3CR1+/+ and CX3CR1−/− mice. E, H, K, VGAT (presynaptic receptor, red) and (F, I, L) gephyrin (postsynaptic receptor, green) double-labeling in naive (E–G), SCI CX3CR1+/+ (H–J), and CX3CR1−/− (K–M) mice. G, J, M, Merged images represent VGAT and gephyrin colocalization. N, Quantification of VGAT-gephyrin colocalized synaptic puncta in the ventral horn of WT (+/+) and CX3CR1-deficient (−/−) mice. Schematic of spinal cord illustrating lamina IX of lumbar spinal cord where synaptic puncta were quantified. Graphs generated from a single experiment; n = 5 +/+ and n = 4 −/− mice/group. *p < 0.05 (Student's unpaired two-tailed t test). Scale bars: C, M, 20 μm. Data are mean ± SEM.
Figure 7.
Figure 7.
Plasticity of excitatory synapses is enhanced in spinal cord lumbar ventral horn after SCI in CX3CR1−/− mice. Immunolabeling for presynaptic VGlut1 (A, B, E, F) and VGlut2 (J, K, N, O) and (C, G, L, P) postsynaptic Homer-1 receptors at 56 dpi in CX3CR1+/+ and CX3CR1−/− mice. Merged image of double-labeling for VGlut1 or VGlut 2 and Homer-1 in lamina VII (D, H) and IX (M, Q), respectively. I, R, Schema indicate gray matter laminae where puncta were quantified. The number of excitatory synaptic puncta in CX3CR1−/− mice is increased in ventral horn lamina VII (I) and IX (R), respectively, relative to +/+ mice. Graphs are representative of a single experiment; n = 5 +/+ and n = 4 −/− mice/group. *p < 0.05 (Student's unpaired two-tailed t test). **p < 0.01 (Student's unpaired two-tailed t test). Scale bars: H, Q, 20 μm. Data are mean ± SEM.
Figure 8.
Figure 8.
Microglia activation is reduced in lumbar spinal cord of CX3CR1−/− mice after thoracic SCI. A, GFAP labeling (red) defines lesion margins, and activated microglia (GFP; green) are found within and several segments above and below the injury epicenter at 56 dpi (horizontal section centered on the injury site). B, Triple labeling for 5-HT (red), GFP (green), and ChAT (blue) shows microglia (GFP+) contacting motor neurons and 5-HT terminals in lumbar spinal cord. C, D, F, G, Activated microglia in lumbar spinal cord labeled with Iba-1 in CX3CR1+/+ (C, F) and CX3CR1−/− (D, G) mice. E, IBA-1 proportional area measurement at (L2-L3) and (L4-L5) spinal levels. F–H, High-power images of Iba-1+ microglia in white matter show genotype specific differences in morphology in lumbar ventral horn (shown in L2-L4). I–K, Genotype-specific differences exist for p38MAPK immunolabeling in lumbar spinal cords of CX3CR1+/+ (I) and CX3CR1−/− (J) mice. L–N, Double-labeling for p38MAPK (red, L–N), Iba-1 (green, L), MAC-1 (green, N), and GFAP (blue, M, N) reveals that p38MAPK is predominantly expressed by microglia (Iba1 and Mac1+ cells). E–K, Data were generated from a single experiment using n = 5 +/+ and n = 4 −/− mice/group. E, Data were analyzed using two-way ANOVA with Bonferroni post tests. H, K, Data were analyzed using Student's unpaired two-tailed t test. *p < 0.05. Scale bars: B, G, J, L–N, 20 μm. Data are mean ± SEM.
Figure 9.
Figure 9.
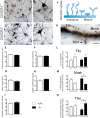
Dendritic spine plasticity is enhanced in motor neurons of CX3CR1−/− mice. Golgi-Cox stain in lumbar spinal cord of CX3CR1+/+ (A, B) and CX3CR1−/− (C, D) mice at 56 dpi. B, Arrows indicate the presence of beaded dendrites (see also Fig. 10). E–I, Motor neuron perimeter, dendrite number, mean dendrite length, length of dendritic spines, and number of dendritic spines. J, Schematic showing morphology of mature and immature dendritic spines. K, High-power image showing filopodial (filo), mushroom (mush), and thin of dendritic spine morphologies. L–N, Quantification of the geometric characteristics of dendritic spines at L2-L3 and L4-L5 spinal levels. L, Immature (Filo) spines. M, Mature (Mush) spines width > 0.6 μm. N, Thin spines with a ratio of length/width >2 μm (immature). A significant switch of mature synapses to immature synapses occurs only in CX3CR1−/− mice. E–N, Data were generated from a single experiment using n = 5 +/+ and n = 4 −/− mice/group. L–N, Data were analyzed using two-way ANOVA with Bonferroni post tests. E–I, Data were analyzed using Student's unpaired two-tailed t test. *p < 0.05. Scale bars: A, C, 100 μm; B, D, 50 μm; K, 1 μm. Data are mean ± SEM.
Figure 10.
Figure 10.
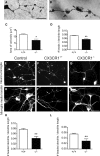
Microglia-dependent CX3CR1 signaling causes dendrite pathology after SCI. A, B, Dendritic varicosities form on a subset of ventral horn lumbar motor neurons (lamina IX) after SCI. C, D, Greater numbers and larger varicosities are found on motor neurons in CX3CR1+/+ compared with CX3CR1−/− mice. Representative images of neurons in neuron-microglia cocultures (E–G) or neurons exposed to microglia-conditioned media (H–J). K, L, CX3CR1−/− microglia cause less dendrite pathology than CX3CR1+/+ microglia; the ratio of dendrite beads/axon length is decreased on neurons from both coculture (K) and media transfer experiments (L). Graphs are representative mean data from one of three independent replicate experiments. C, D, n = 5 +/+ and n = 4 −/− mice/group. *p < 0.05 (Student's unpaired two-tailed t test). **p < 0.01 (Student's unpaired two-tailed t test). K, L, Student's unpaired two-tailed t test. **p < 0.01. Scale bars: A, 10 μm; G, J, 50 μm. Data are mean ± SEM.

Similar articles

Cited by

References

    1. Alvarez FJ, Villalba RM, Zerda R, Schneider SP (2004) Vesicular glutamate transporters in the spinal cord, with special reference to sensory primary afferent synapses. J Comp Neurol 472:257–280. 10.1002/cne.20012 - DOI - PubMed
    1. Baalman K, Marin MA, Ho TS, Godoy M, Cherian L, Robertson C, Rasband MN (2015) Axon initial segment-associated microglia. J Neurosci 35:2283–2292. 10.1523/JNEUROSCI.3751-14.2015 - DOI - PMC - PubMed
    1. Bakal C, Aach J, Church G, Perrimon N (2007) Quantitative morphological signatures define local signaling networks regulating cell morphology. Science 316:1753–1756. 10.1126/science.1140324 - DOI - PubMed
    1. Bandaru SP, Liu S, Waxman SG, Tan AM (2015) Dendritic spine dysgenesis contributes to hyperreflexia after spinal cord injury. J Neurophysiol 113:1598–1615. 10.1152/jn.00566.2014 - DOI - PMC - PubMed
    1. Bareyre FM, Kerschensteiner M, Raineteau O, Mettenleiter TC, Weinmann O, Schwab ME (2004) The injured spinal cord spontaneously forms a new intraspinal circuit in adult rats. Nat Neurosci 7:269–277. 10.1038/nn1195 - DOI - PubMed

Publication types