. 2017 Mar 29;37(13):3704-3720.
doi: 10.1523/JNEUROSCI.0117-17.2017. Epub 2017 Mar 6.

Dopamine Inhibition Differentially Controls Excitability of Substantia Nigra Dopamine Neuron Subpopulations through T-Type Calcium Channels

Affiliations

Dopamine Inhibition Differentially Controls Excitability of Substantia Nigra Dopamine Neuron Subpopulations through T-Type Calcium Channels

Rebekah C Evans et al. J Neurosci. .

Abstract

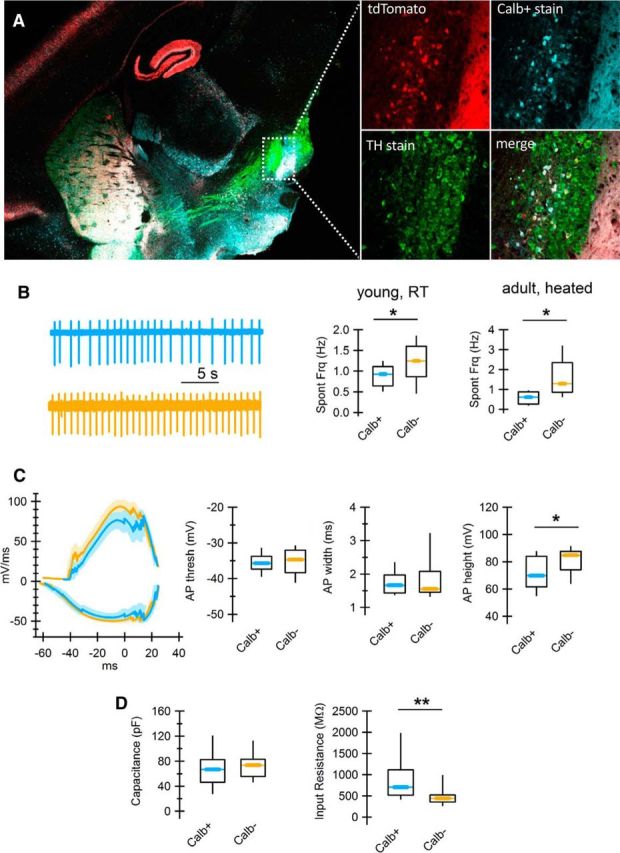
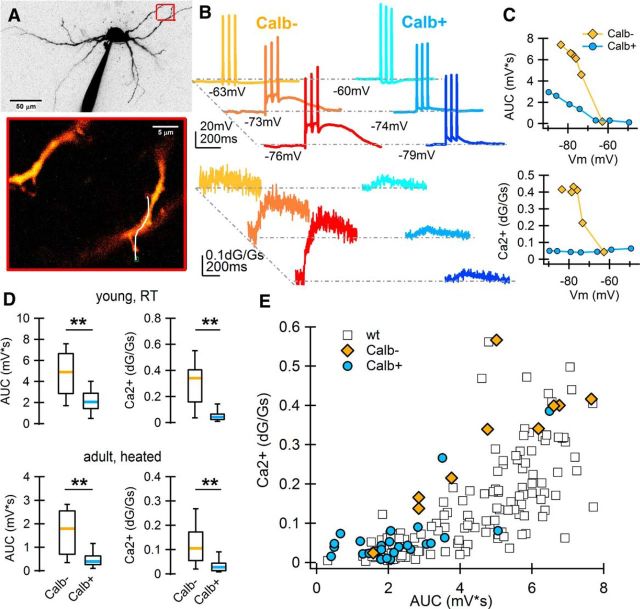
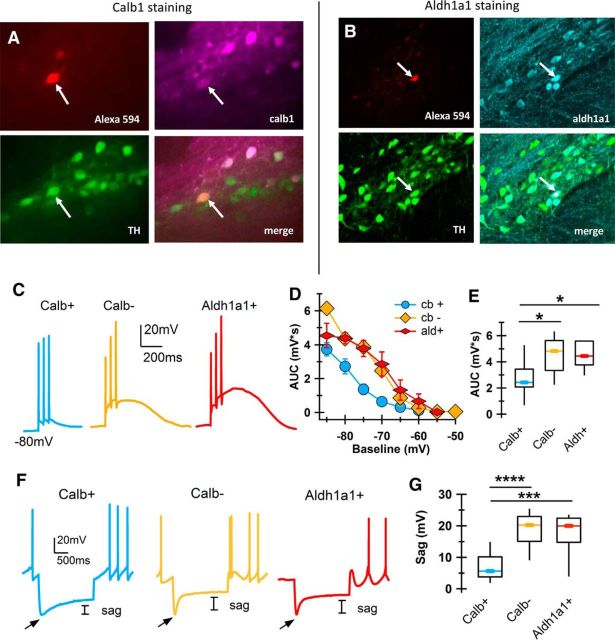
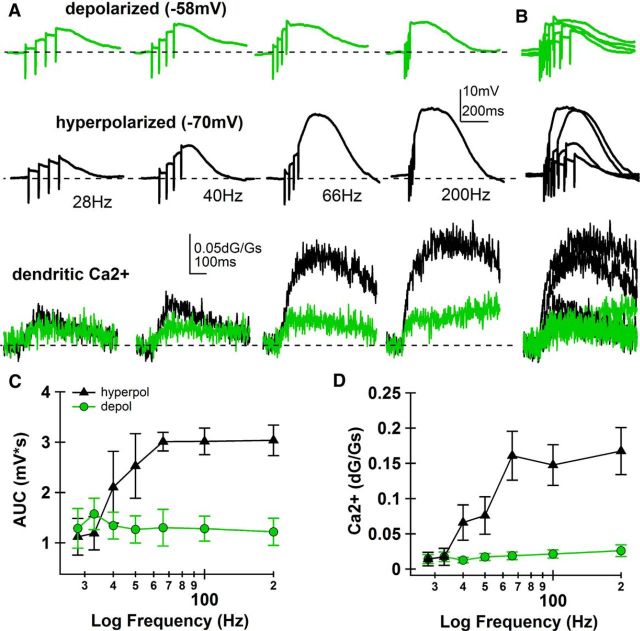
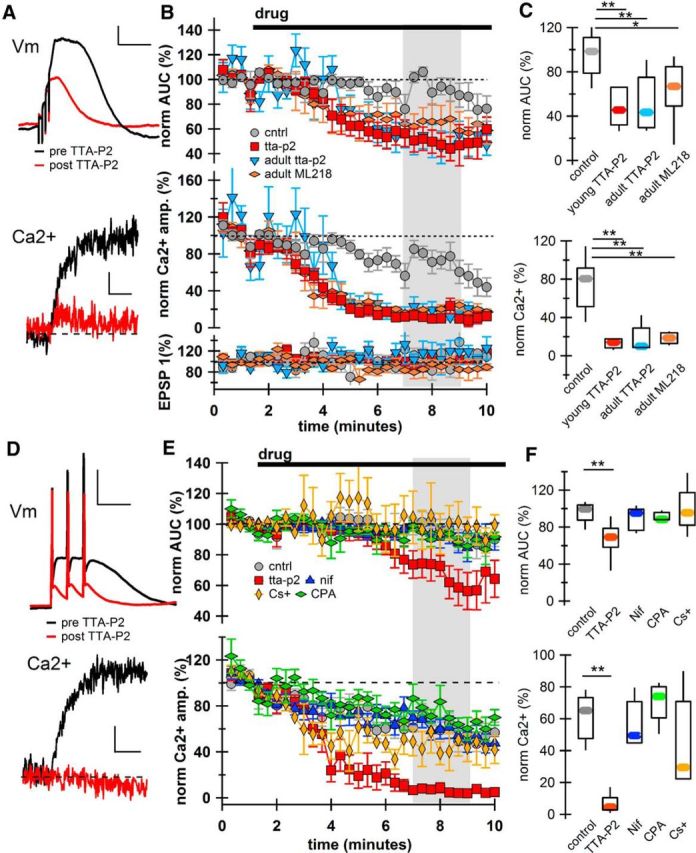
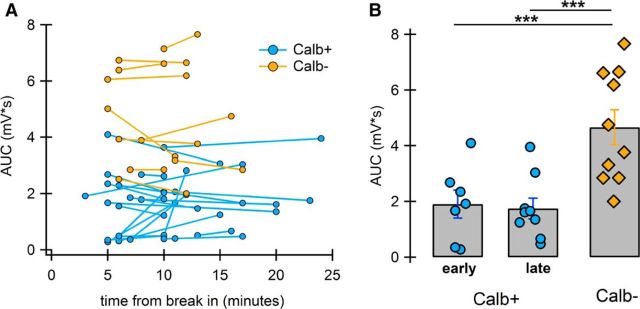
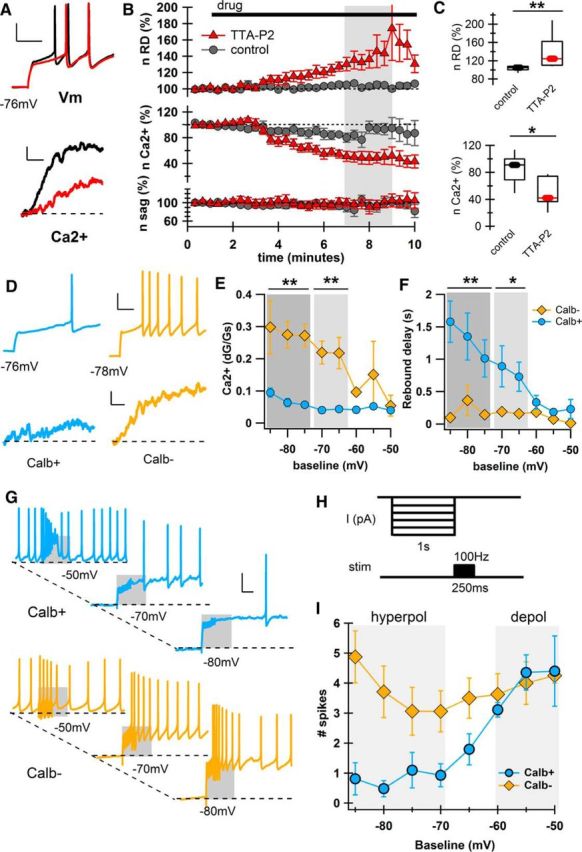
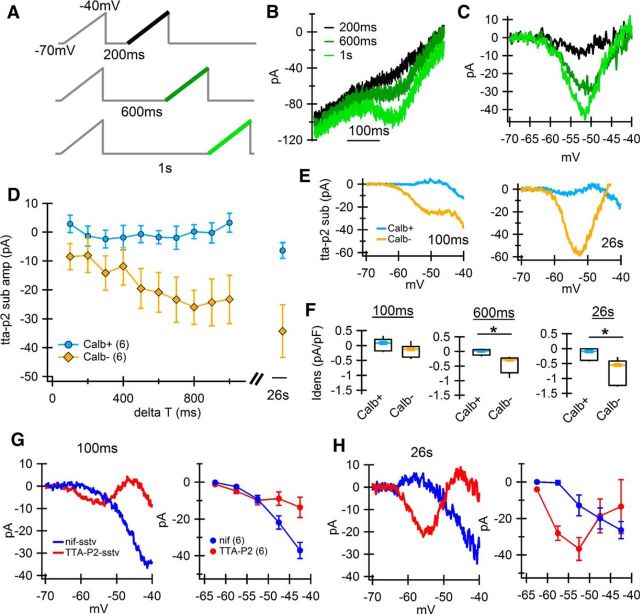
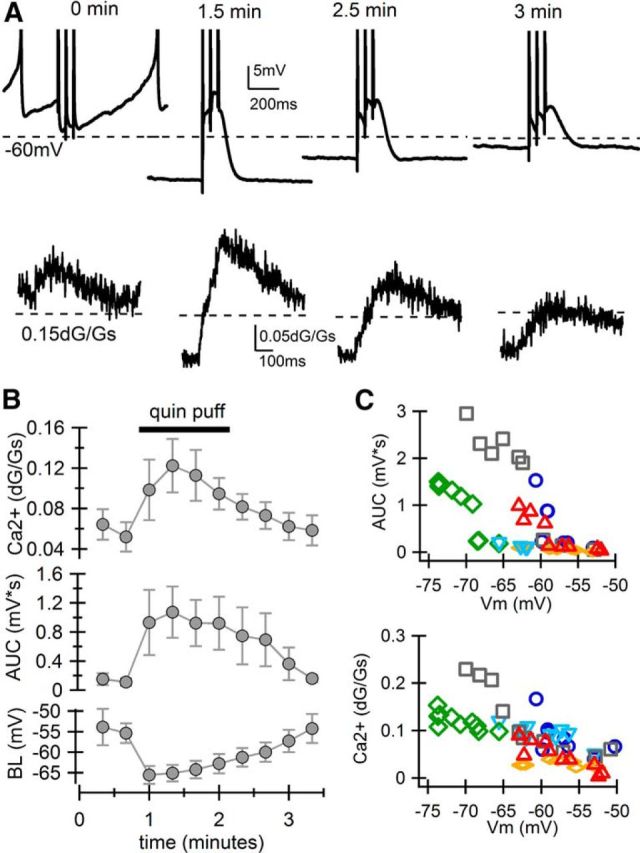
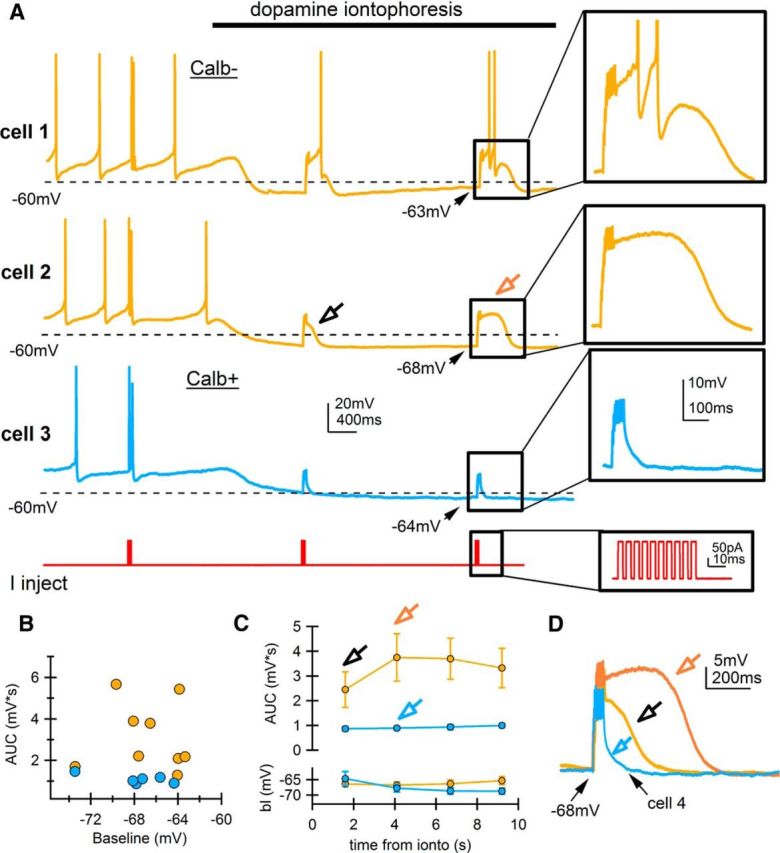
While there is growing appreciation for diversity among ventral tegmental area dopamine neurons, much less is known regarding functional heterogeneity among the substantia nigra pars compacta (SNc) neurons. Here, we show that calbindin-positive dorsal tier and calbindin-negative ventral tier SNc dopaminergic neurons in mice comprise functionally distinct subpopulations distinguished by their dendritic calcium signaling, rebound excitation, and physiological responses to dopamine D2-receptor (D2) autoinhibition. While dopamine is known to inhibit action potential backpropagation, our experiments revealed an unexpected enhancement of excitatory responses and dendritic calcium signals in the presence of D2-receptor inhibition. Specifically, dopamine inhibition and direct hyperpolarization enabled the generation of low-threshold depolarizations that occurred in an all-or-none or graded manner, due to recruitment of T-type calcium channels. Interestingly, these effects occurred selectively in calbindin-negative dopaminergic neurons within the SNc. Thus, calbindin-positive and calbindin-negative SNc neurons differ substantially in their calcium channel composition and efficacy of excitatory inputs in the presence of dopamine inhibition.SIGNIFICANCE STATEMENT Substantia nigra dopaminergic neurons can be divided into two populations: the calbindin-negative ventral tier, which is vulnerable to neurodegeneration in Parkinson's disease, and the calbindin-positive dorsal tier, which is relatively resilient. Although tonic firing is similar in these subpopulations, we find that their responses to dopamine-mediated inhibition are strikingly different. During inhibition, calbindin-negative neurons exhibit increased sensitivity to excitatory inputs, which can then trigger large dendritic calcium transients due to strong expression of T-type calcium channels. Therefore, SNc neurons differ substantially in their calcium channel composition, which may contribute to their differential vulnerability. Furthermore, T-currents increase excitation efficacy onto calbindin-negative cells during dopamine inhibition, suggesting that shared inputs are differentially processed in subpopulations resulting in distinct downstream dopamine signals.

Keywords: calbindin; dendrites; dopamine; substantia nigra; t-type calcium channels; two-photon imaging.


Figures

Figure 1.
Figure 1.
AP characteristics of Calb+ and Calb− neurons. A, Calbindin-cre/Td-tomato mouse (red) stained for calbindin (cyan) and TH (green). B, Example cell-attached spontaneous firing recordings for a young Calb+ (blue) and Calb− (yellow) cell. Thirty seconds of spontaneous firing was recorded in young Calb− (n = 12) and Calb+ (n = 17) neurons at room temperature (RT; left) and in adult Calb− (n = 9) and Calb+ (n = 4) heated to 30–32°C (right). *p = 0.018, young RT; *p = 0.034, adult heated. C, Overlaid averaged phase plot of AP waveform during tonic pacemaking in adult mice heated to 30–32°C for Calb− (yellow) and Calb+ (blue) subpopulations (left). Shading represents ±SEM. AP activation threshold (AP thresh) and width at half-height (AP width) did not differ between subpopulations (n = 13 for each group). AP height differed slightly, *p = 0.034. D, Capacitance and resistance measurements from adult Calb+ (n = 18) and Calb− (n = 27) neurons at 30–32°C. **p = 0.00032.
Figure 2.
Figure 2.
Hyperpolarization reveals differences between Calb+ and Calb− SNc neurons. A, Two-photon image SNc dopamine neuron with patch pipette. Inset, Higher-magnification image of region in red box. Scan path through a spine and dendrite indicated by white line. B, Low-threshold afterdepolarizations in response to a 20 Hz AP triplet occurs with hyperpolarization in Calb− neurons (left traces), but not Calb+ neurons (right traces). Differences are reflected in membrane potential (above) and dendritic calcium (Ca2+) amplitudes (below) in young mice. C, AUC (above) and Ca2+ (below) amplitude plotted by baseline Vm for the example neurons. D, Comparison between Calb− and Calb+ AUC and Ca2+ amplitude from membrane potential closest to −80 mV in each cell in neurons from young (Calb− n = 10; Calb+ n = 27) and adult (Calb− n = 26, Calb+ n = 18) mice. **p < 0.001. E, Ca2+ amplitude plotted by AUC measured at membrane potential closest to −80 mV for Calb+ and Calb− cells. Unlabeled neurons from wild-type mice (wt; open squares) span a wide range of values, demonstrating heterogeneity in unlabeled SNc neurons.
Figure 3.
Figure 3.
Calb− and Aldh1a1+ SNc dopaminergic neurons display similar characteristics. A, Sagittal section of the substantia nigra. Genetically labeled TH-positive dopamine neurons (green neurons) were filled with Alexa594 (red) and stained for calbindin (magenta). B, Sagittal section of the substantia nigra immunostained for aldehyde dehydrogenase (cyan). C, Example traces of low-threshold depolarization in TH-positive neurons that were identified as Calb+ (blue), Calb− (yellow), and Aldh1a1+ (red) using post hoc immunostaining. D, AUC as a function of membrane potential in post hoc stained neurons. cb+, Calb+ neurons; cb-, Calb- neurons; ald+, Aldh1a1+ neurons. E, AUC measured from membrane voltage closest to −80 mV for each cell in Calb+, Calb−, and Aldh1a1+ neurons. *p < 0.01. F, Example traces from Calb+, Calb−, and Aldh1a1+ neurons showing voltage sag measurement. Black arrow indicates minimum Vm. G, Both Aldh1a1+ (n = 10) and Calb− (n = 31) neurons have significantly larger voltage sags than Calb+ (n = 34) neurons when measured from the minimum Vm closest to −100 mV for each cell. ***p < 0.0001 ****p < 1e-9.
Figure 4.
Figure 4.
Synaptically generated low-threshold depolarizations depend on input frequency. A, Example traces from an SNc neuron given four excitatory synaptic stimulation pulses at different frequencies from depolarized (top) and hyperpolarized (middle) potentials. Bottom, Corresponding calcium traces. B, Overlay of responses for all frequencies in A. C, Size of low-threshold depolarizations (AUC) versus stimulation frequency. Note, AUC increases nonlinearly with input frequency at hyperpolarized (black) but not depolarized (green) potentials. D, Same as C, but for Ca2+ amplitude. Data are presented as mean ± SEM.
Figure 5.
Figure 5.
T-type Ca2+ channels are necessary for low-threshold depolarizations. A, Example traces showing synaptically evoked low-threshold depolarizations (top; scale bars: 5 mV, 100 ms) and dendritic Ca2+ signals (bottom; scale bars: 0.025 dG/Gs, 100 ms) before (black) and after (red) TTA-P2 application. B, Time course for drug application on AUC, Ca2+, and first EPSP amplitude compared with no-drug control (n = 8, 5 young, 3 adult). C, Summarized data from shaded area in B. **p < 0.01 *p < 0.05. D, Example low-threshold depolarization (top; scale bars: 20 mV, 100 ms) and dendritic Ca2+ signal (bottom; scale bars: 0.05 dG/Gs, 100 ms) before drug application (black) and after TTA-P2 application (red) in young mice. E, Time course for drug effect on low-threshold depolarization (AUC, top) and dendritic Ca2+ signal (bottom), compared with no-drug control. cntrl, Control; nif, Nifedipine; CPA, Cyclopiazonic acid; Cs+, Cesium. F, Summarized data from shaded area in E. **p < 0.01 *p < 0.05.
Figure 6.
Figure 6.
Calbindin washout does not affect low-threshold depolarization. A, AUC in response to 20 Hz triplet measured in young mice at membrane voltage closest to −80 mV at two different time points measured from the time whole-cell configuration was achieved (break in). Time from break in did not alter the AUC for either Calb− or Calb+ neurons. B, AUC from Calb+ neurons measured early (<5 min from break in) and late (>15 min from break in) differ from Calb− (average time from break in, 12.6 ± 0.7 min). *p < 0.01. Bar graph shows mean ± SEM.
Figure 7.
Figure 7.
T-type Ca2+ channels contribute to rebound spike timing. A, Rebound spikes (top) and rebound Ca2+ (bottom) before (black) and after (red) TTA-P2 application. Scale bars: top, 20 mV, 100 ms; bottom, 0.05 dG/Gs, 100 ms. B, Time course of TTA-P2 application for rebound delay (top), rebound Ca2+ (middle), and sag amplitude (bottom). n RD, Normalized rebound delay; n Ca2+, normalized Ca2+ amplitude; n sag, normalized sag amplitude. C, Summarized data from shaded areas in B. **p < 0.01 *p < 0.05. D, Example rebound spikes (top) and rebound Ca2+ (bottom) from membrane potentials close to −80 mV for a Calb+ and a Calb− neuron. Scale bars: top, 20 mV, 100 ms; bottom, 0.05 dG/Gs, 100 ms. E, Amplitude of Ca2+ signal versus baseline voltage in Calb− (yellow symbols) and Calb+ (blue symbols) neurons. **p < 0.01. F, Rebound delay versus baseline voltage for Calb+, but not Calb−, neurons. Statistics reported in the text are from shaded areas. *p < 0.05, **p < 0.01. G, Example traces showing rebound burst responses to stimulation at different levels of hyperpolarization for Calb+ and Calb− neurons. Shaded area represents rebound time period (500 ms). Scale bars: 20 mV, 200 ms. H, Rebound burst protocol. I, Average number of rebound spikes versus baseline voltage. Statistics reported in text compare hyperpolarized potentials (hyperpol) to depolarized potentials (depol). Data are presented as mean ± SEM.
Figure 8.
Figure 8.
T-type Ca2+ channels are activated by voltage ramps. A, Voltage-clamp ramp protocol. Four hundred millisecond ramps from −70 to −40 mV were run after varying the duration of the recovery step (−70 mV). B, Raw current traces from times shown in A. C, Same currents as in B, but leak subtracted and plotted by voltage. D, Amplitude of TTA-P2-subtracted current plotted by duration of recovery step. Maximal holding duration was the intersweep interval of 26 s. Data presented as mean ± SEM. E, Example TTA-P2-subtracted traces from Calb+ and Calb− neurons after 100 ms (left) and 26 s (right) durations of −70 mV holding potential. F, Summary of current density (Idens; pA/pF) amplitude from TTA-P2-sensitive currents. *p < 0.01. G, Example trace from a TH-GFP mouse showing the nifedipine-sensitive (nif-sstv; 10 μm) and TTA-P2-sensitive (TTAP2-sstv; 1 μm) ramp currents from the same cell (left). Current traces from six TH-positive neurons, which displayed low-threshold depolarizations, binned by voltage and averaged. Ramp currents were evoked after 100 ms recovery step. H, Same as G, but with ramp currents evoked after 26 s recovery step. Data are from adult mice and are presented as mean ± SEM.
Figure 9.
Figure 9.
D2-receptor activation recruits T-type channels in a graded manner. A, Example voltage (top) and Ca2+ (bottom) traces from quinpirole puff experiment. Quinpirole is applied at the 1 min mark. Note that both the voltage membrane potential and the baseline Ca2+ decrease in amplitude with quinpirole application. APs are truncated. B, Time course for effect of quinpirole puff on Ca2+, AUC, and baseline membrane potential (BL). Data presented as mean ± SEM. C, All data points from each cell plotted against membrane voltage for Ca2+ amplitude (bottom) and AUC (top). Each cell is represented by a different color and symbol. AUC and Ca2+ increase with increased hyperpolarization in a graded manner.
Figure 10.
Figure 10.
Dopamine differentially modulates Calb+ and Calb− neurons. A, Example traces of activity in two Calb− (yellow) and one Calb+ (blue) SNc dopamine neurons during dopamine iontophoresis. Depolarizing input trains (10 pulses, 200 pA) were applied periodically to cells (I inject). B, AUC for all Calb+ (blue) and Calb− (yellow) neurons during dopamine iontophoresis plotted by baseline membrane potential (Baseline). C, AUC and baseline voltage (bl) for Calb+ (blue) and Calb− (yellow) neurons measured at different time points from start of iontophoresis. Data are presented as means ± SEM. Error bars fall within symbols. D, Example traces from cell 2 at an early (yellow) and a later time point (orange). Blue trace is from a Calb+ cell. Open arrows correspond to time points indicated in C.

Similar articles

Cited by

References

    1. Aizenman CD, Linden DJ (1999) Regulation of the rebound depolarization and spontaneous firing patterns of deep nuclear neurons in slices of rat cerebellum. J Neurophysiol 82:1697–1709. - PubMed
    1. Alviña K, Walter JT, Kohn A, Ellis-Davies G, Khodakhah K (2008) Questioning the role of rebound firing in the cerebellum. Nat Neurosci 11:1256–1258. 10.1038/nn.2195 - DOI - PMC - PubMed
    1. Amendola J, Woodhouse A, Martin-Eauclaire MF, Goaillard JM (2012) Ca2+/cAMP-sensitive covariation of IA and IH voltage dependences tunes rebound firing in dopaminergic neurons. J Neurosci 32:2166–2181. 10.1523/JNEUROSCI.5297-11.2012 - DOI - PMC - PubMed
    1. Anderegg A, Poulin JF, Awatramani R (2015) Molecular heterogeneity of midbrain dopaminergic neurons—moving toward single cell resolution. FEBS Lett 589:3714–3726. 10.1016/j.febslet.2015.10.022 - DOI - PMC - PubMed
    1. Aransay A, Rodríguez-López C, García-Amado M, Clascá F, Prensa L (2015) Long-range projection neurons of the mouse ventral tegmental area: a single–cell axon tracing analysis. Front Neuroanat 9:59. 10.3389/fnana.2015.00059 - DOI - PMC - PubMed

Publication types

MeSH terms

LinkOut - more resources