

Nuclear retention of the lncRNA SNHG1 by doxorubicin attenuates hnRNPC-p53 protein interactions
- PMID: 28264987
- PMCID: PMC5376760
- DOI: 10.15252/embr.201643139
Nuclear retention of the lncRNA SNHG1 by doxorubicin attenuates hnRNPC-p53 protein interactions
Abstract
The protein p53 plays a crucial role in the regulation of cellular responses to diverse stresses. Thus, a major priority in cell biology is to define the mechanisms that regulate p53 activity in response to stresses or maintain it at basal levels under normal conditions. Moreover, further investigation is required to establish whether RNA participates in regulating p53's interaction with other proteins. Here, by conducting systematic experiments, we discovered a p53 interactor-hnRNPC-that directly binds to p53, destabilizes it, and prevents its activation under normal conditions. Upon doxorubicin treatment, the lncRNA SNHG1 is retained in the nucleus through its binding with nucleolin and it competes with p53 for hnRNPC binding, which upregulates p53 levels and promotes p53-dependent apoptosis by impairing hnRNPC regulation of p53 activity. Our results indicate that a balance between lncRNA SNHG1 and hnRNPC regulates p53 activity and p53-dependent apoptosis upon doxorubicin treatment, and further indicate that a change in lncRNA subcellular localization under specific circumstances is biologically significant.
Keywords: SNHG1; doxorubicin; hnRNPC; lncRNA; p53.
© 2017 The Authors.
Figures
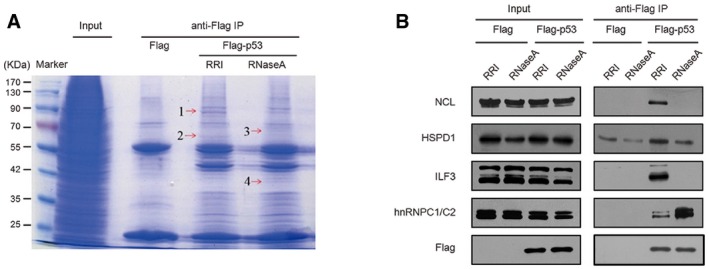
Identification of p53‐interacting proteins in the presence and absence of RNA. Lysates of HEK293 cells transfected with the Flag‐p53‐overexpression plasmid and Flag control plasmid were used to isolate p53‐interacting proteins after treatment with RNase A (10 μg/μl) or RRI (0.5 U/μl), and the captured proteins were resolved using SDS–PAGE and visualized through Coomassie Blue staining. Four differentially detected bands (arrows) were selected for the identification of component proteins by means of LC‐LTQ‐MS. RRI, RNase inhibitor; IP, immunoprecipitation.
Identification of p53‐binding proteins in HEK293 cells treated with RNase A or RRI. Flag‐p53‐overexpression plasmid and Flag control plasmid were transfected into cells, and then cell lysates were immunoprecipitated with anti‐Flag antibodies and analyzed using SDS–PAGE.
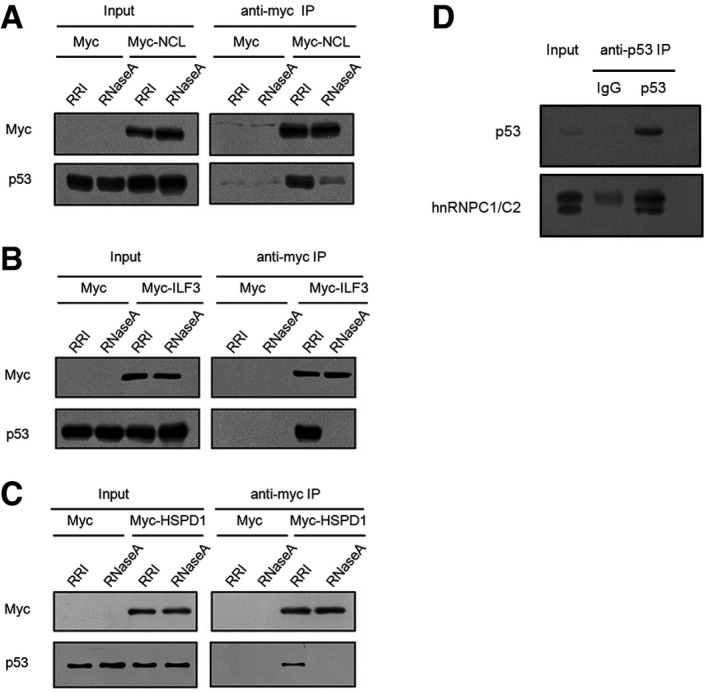
Interaction between NCL and p53 in HCT116+/+ cells. The overexpression plasmids pCMV6‐Myc and pCMV6‐Myc‐NCL were transfected into cells, and cell lysates were immunoprecipitated with anti‐Myc antibody and analyzed using SDS–PAGE.
Interaction between ILF3 and p53 in HCT116+/+ cells. Cells were transfected with pCMV6‐Myc‐ILF3 and pCMV6‐Myc, and then cell lysates were immunoprecipitated with anti‐Myc antibody and analyzed using SDS–PAGE.
Interaction between HSPD1 and p53 in HCT116+/+ cells. Cells were transfected with pCMV6‐Myc‐HSPD1 and pCMV6‐Myc, and cell lysates were immunoprecipitated with anti‐Myc antibody and analyzed using SDS–PAGE.
Endogenous p53 was immunoprecipitated with IgG (control) or anti‐p53 antibodies from HCT116+/+ cell lysates, and then the obtained samples were immunoblotted with specific antibodies against p53 and hnRNPC.
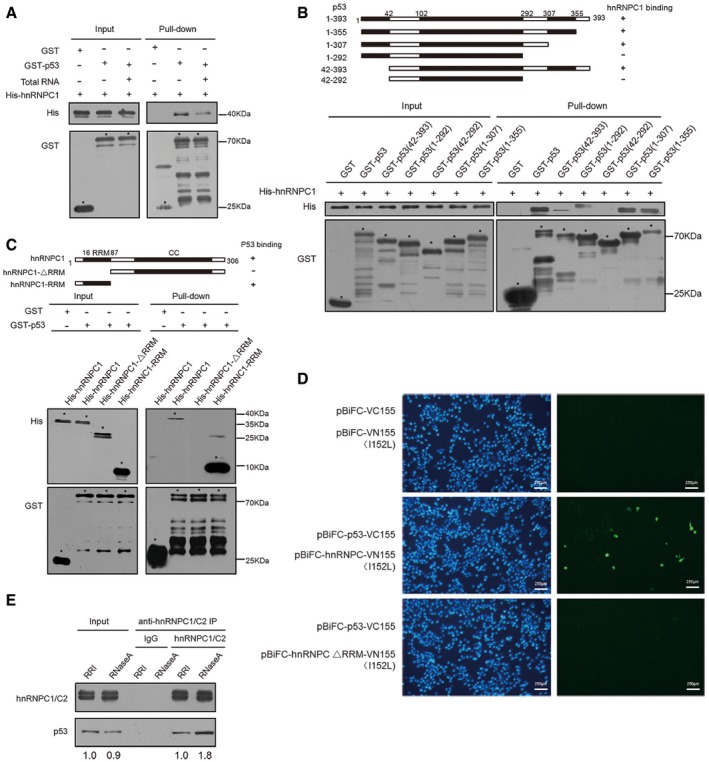
Direct interaction between hnRNPC1 and p53 shown using GST pull‐down assays. GST and GST‐p53 fusion protein were purified from Escherichia coli BL21 transformed with pGEX‐4T‐2‐(p53), immobilized on glutathione beads in the absence or presence of total cellular RNA, and then mixed with His‐hnRNPC1, washed and eluted, and analyzed using SDS–PAGE and Western blotting. Target bands are indicated by asterisks.
Interaction between hnRNPC1 and various p53 forms shown using GST pull‐down assays. GST and truncated GST‐p53 proteins were purified from E. coli transformed with pGEX‐4T‐2‐(p53), immobilized on glutathione beads in the absence or presence of total cellular RNA, mixed with His‐hnRNPC1, washed/eluted, and analyzed using SDS–PAGE and Western blotting. Target bands are indicated by asterisks.
Interaction between truncated hnRNPC1 and p53 demonstrated using GST pull‐down assays. GST and GST‐p53 were purified from E. coli transformed with pGEX‐4T‐2‐(p53), immobilized on glutathione beads in the absence or presence of total cellular RNA, mixed with full‐length and truncated His‐hnRNPC1, washed/eluted, and analyzed using SDS–PAGE and Western blotting. Target bands are indicated by asterisks.
Interaction between p53 and hnRNPC in HCT116+/+ cells. HCT116 cells cotransfected with various combinations of BiFC expression plasmids were analyzed for fluorescence after incubation at 37°C for 24 h.
Endogenous hnRNPC1/C2 was immunoprecipitated from cell lysates by using IgG or anti‐hnRNPC1/C2 antibodies after treatment of cells with RNase A (10 μg/μl) or RRI (0.5 U/μl); captured proteins were analyzed using SDS–PAGE. Below each panel, relative quantification values are shown with respect to control samples set to a value of one.
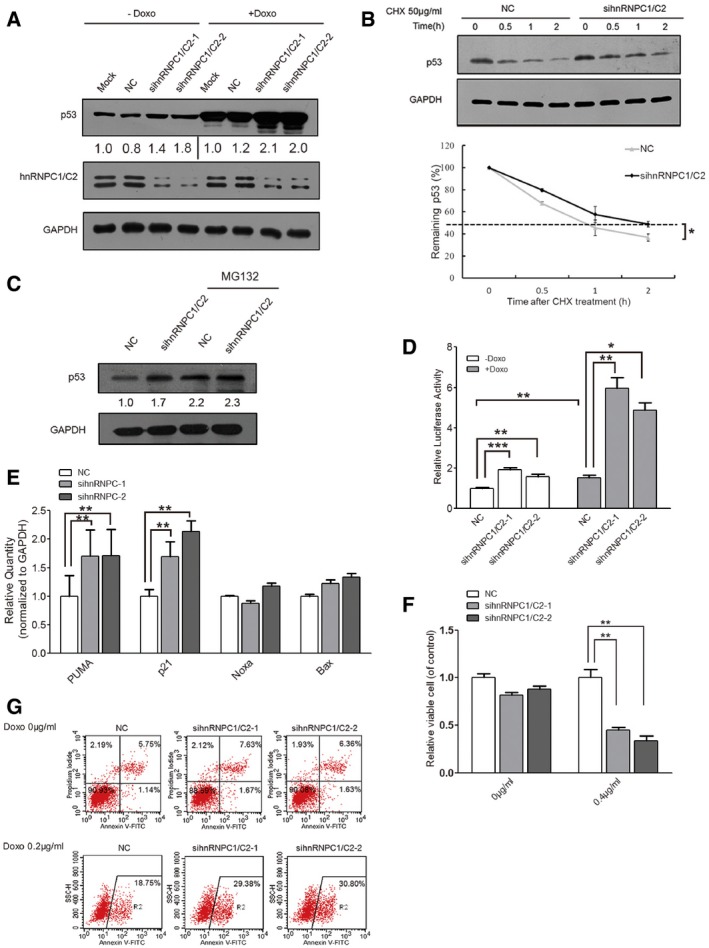
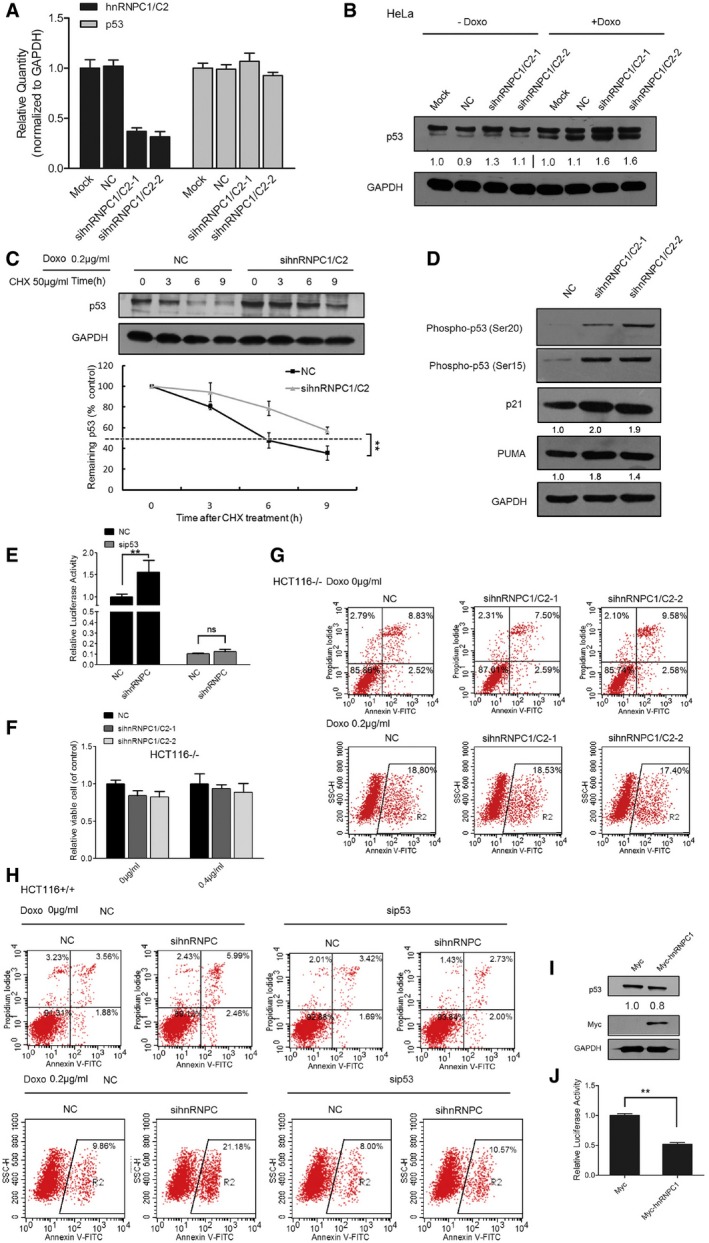
HCT116+/+ cells were transfected with NC and hnRNPC siRNAs, treated with doxorubicin (0.2 μg/ml, 24 h), and subjected to Western blotting. GAPDH was used as the control, and below each panel, relative quantifications derived from at least three independent experiments are indicated with respect to control samples set to a value of one.
HCT116+/+ cells were transfected with NC or hnRNPC1/C2 siRNA, treated with CHX (50 μg/ml) for different periods, and harvested for Western blotting. The p53 and GAPDH signals in the immunoblots were quantified using densitometry, and the ratios of p53/GAPDH were normalized to time zero and plotted against time; the values shown are means ± SD (n = 3), and single star represents a P‐value ≤ 0.05 (two‐tailed unpaired Student's t‐test), respectively.
HCT116+/+ cells were transfected with NC or hnRNPC1/C2 siRNA, treated with MG132 (20 μM) for 2 h, and then harvested and subjected to Western blotting.
Promoter fragments of 13 p53 target genes were cloned into pGL3‐enhancer luciferase‐reporter vector for detecting p53 transcriptional activity. HCT116+/+ cells were transfected with the luciferase reporter together with NC and hnRNPC1 siRNAs, and were treated with or without doxorubicin for 24 h; subsequently, the cells were cultured and reporter activity was measured and plotted after normalizing against Renilla luciferase activity at 24 h; the values shown are means ± SD (n = 3), and triple stars, double stars and single star represent P‐values ≤ 0.001, 0.01 and 0.05 (two‐tailed unpaired Student's t‐test), respectively.
HCT116+/+ cells were transfected with NC or hnRNPC1/C2 siRNA, and the mRNA levels of the p53 targets p21, PUMA, Noxa, and Bax were determined by performing qRT–PCR, the values shown are means ± SE (n = 3), and double stars represent P‐values ≤ 0.01 (two‐tailed unpaired Student's t‐test).
NC and hnRNPC siRNA‐transfected HCT116+/+ cells were treated with or without doxorubicin (0.4 μg/ml, 24 h), after which cell viability was assessed, the values shown are means ± SD (n = 3), and double stars represent P‐values ≤ 0.01 (two‐tailed unpaired Student's t‐test).
The siRNA‐transfected HCT116+/+ cells were treated without or with doxorubicin (0.2 μg/ml, 24 h) and then apoptosis was analyzed using flow cytometry. A representative figure from three independent experiments is shown.
HCT116+/+ cells were transfected with NC and hnRNPC1/C2 siRNAs, and after 48 h, RNA was extracted for qRT–PCR analysis to measure hnRNPC and p53 mRNAs. Error bars represent SD (n = 3).
HeLa cells were transfected with NC and hnRNPC siRNAs, treated with 0.2 μg/ml doxorubicin for 24 h, and then subjected to Western blotting. Below each panel, relative quantifications are indicated with respect to control samples set to a value of one.
HCT116+/+ cells were transfected with NC or hnRNPC1/C2 siRNA, after which they were treated with 50 μg/ml CHX for different times and then with 0.2 μg/ml doxorubicin for 24 h. The cells were harvested and subjected to Western blotting. The p53 and GAPDH signals in the immunoblots were quantified using densitometry, and the p53/GAPDH ratios were normalized relative to time zero and plotted against time; error bars represent SD (n = 3), and double stars represent P‐values ≤ 0.01 (two‐tailed unpaired Student's t‐test).
HCT116+/+ cells were transfected with NC or hnRNPC1/C2 siRNA and then subjected to Western blotting to measure the levels of phospho‐p53 Ser15, p‐p53 Ser20, PUMA, p21, and GAPDH. Below each panel, relative quantifications are indicated with respect to control samples set to a value of one.
Promoter fragments of 13 p53‐targeted genes were cloned into pGL3‐enhancer luciferase‐reporter vector for detecting p53 transcriptional activity. HCT116+/+ cells were transfected with the luciferase reporter together with NC or hnRNPC1/C2 siRNA grouped with NC or p53 siRNA, and 48 h later, cells were cultured and reporter activity was measured and plotted after normalizing against Renilla luciferase activity; error bars represent SD (n = 3), and double stars represent P‐values ≤ 0.01 (two‐tailed unpaired Student's t‐test).
HCT116−/− cells were transfected with NC and hnRNPC1/C2 siRNAs and then treated with or without 0.4 μg/ml doxorubicin for 24 h, after which cell viability was assessed. Error bars represent SD (n = 5).
NC and hnRNPC siRNAs were transfected into HCT116−/− cells and the cells were then either treated or not treated with 0.2 μg/ml doxorubicin for 24 h before being subjected to FACS apoptosis analysis. A representative figure from three independent experiments is shown.
NC or hnRNPC siRNAs grouped with NC or p53 siRNA were transfected into HCT116+/+ cells, and the cells were then either treated or not treated with 0.2 μg/ml doxorubicin for 24 h before being subjected to FACS apoptosis analysis. A representative figure from three independent experiments is shown.
Cells were transfected with pCMV6‐Myc‐hnRNPC1 and pCMV6‐Myc plasmids for 48 h, and then total cellular proteins were extracted and subjected to Western blotting. Below each panel, relative quantifications are indicated with respect to control samples set to a value of one.
Promoter fragments of 13 p53‐targeted genes were cloned into pGL3‐enhancer vector for detecting p53 transcriptional activity by using the luciferase‐reporter assay. HCT116+/+ cells were transfected with the luciferase reporter together with pCMV6‐Myc‐hnRNPC1 and pCMV6‐Myc plasmids, and 48 h later, cells were cultured and reporter activity was measured and plotted after normalizing against Renilla luciferase activity; error bars represent SD (n = 3), and double stars represent P‐values ≤ 0.01 (two‐tailed unpaired Student's t‐test).
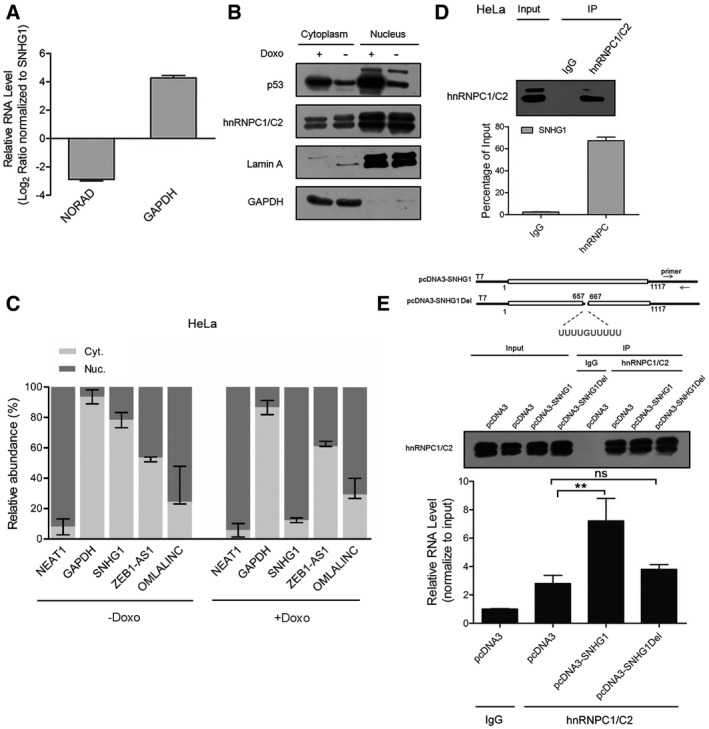
RNAs were extracted from HCT116 cells and subjected to qPCR analysis, and specific primers were used to examine SNHG1, NORAD, and GAPDH. Values are means ± SD (n = 3).
HCT116+/+ cells were treated with or without 0.2 μg/ml doxorubicin for 24 h. Nuclear and cytoplasmic proteins were extracted from equal numbers of cells and subjected to Western blotting. Cytoplasm‐localized GAPDH and nucleus‐retained lamin A were used as protein controls.
HeLa cells were treated with or without 0.2 μg/ml doxorubicin for 24 h. Nuclear and cytoplasmic RNAs were extracted from equal numbers of HeLa cells and assayed using qRT–PCR. Cytoplasm‐localized GAPDH RNA and nucleus‐retained endogenous NEAT1 RNA were used as RNA markers. Values are means ± SD (n = 3).
RNA immunoprecipitation (RIP) of endogenous hnRNPC1/C2 was performed using IgG or anti‐hnRNPC1/C2 antibodies from HeLa cell lysates, and then specific primers were used to assay SNHG1 and GAPDH levels. Values are means ± SD (n = 3).
Construction of pcDNA3‐SNHG1 and pcDNA3‐SNHG1Del lacking nt 657–667, a potential binding site of hnRNPC. RIP enrichment was evaluated in terms of RNA associated with hnRNPC relative to that associated with IgG after transfection of cells with pcDNA3, pcDNA3‐SNHG1, and pcDNA3‐SNHG1Del. Primers were used to amplify pcDNA3 overexpression products and GAPDH. Values are means ± SD (n = 3), and double stars represent P‐values ≤ 0.01 (two‐tailed unpaired Student's t‐test).
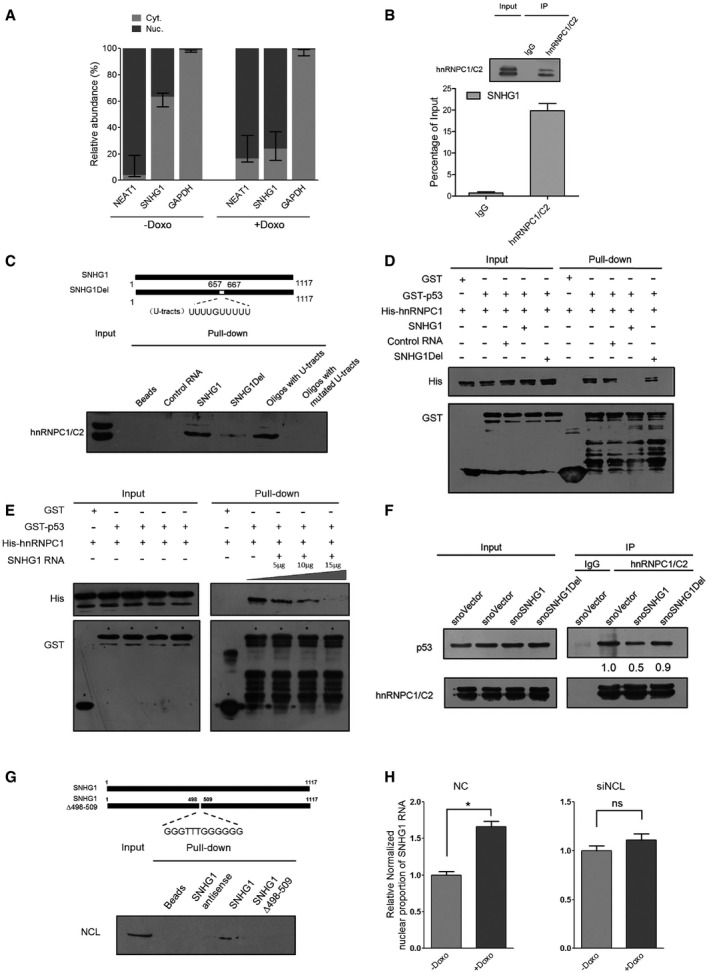
HCT116+/+ cells were treated with or without 0.2 μg/ml doxorubicin for 24 h. Nuclear and cytoplasmic RNAs were extracted from equal numbers of HCT116+/+ cells and subjected to qRT–PCR analysis. Cytoplasm‐localized GAPDH and nucleus‐retained endogenous NEAT1 RNAs were used as RNA markers; values shown are means ± SD (n = 3).
RNA immunoprecipitation (RIP) of endogenous hnRNPC1/C2 was performed using IgG or anti‐hnRNPC1/C2 antibodies from HCT116+/+ cell lysates, and specific primers were used to examine SNHG1 and GAPDH.
RNA pull‐down assay was performed using biotin‐labeled RNA SNHG1, U‐tract‐deleted SNHG1, control RNA, biotin‐labeled RNA oligos CCUGCCCUUUUGUUUUUUAGA and CCUGCCCUUacGUUagUUAGA, and total extracts of cells treated with doxorubicin for 24 h.
Direct interaction between hnRNPC1 and p53 shown using GST pull‐down assay. RNA SNHG1, U‐tract‐deleted SNHG1, and control RNA (20 μg) were selectively included in one group.
GST pull‐down assay performed using purified GST‐p53 and His‐hnRNPC with or without SNHG1. Glutathione–Sepharose 4B resin conjugated with GST‐p53 and GST was incubated with purified His‐hnRNPC in the absence or presence of various doses of SNHG1 RNA (5, 10, 20 μg). Western blotting was performed using anti‐GST and anti‐His antibodies.
Immunoprecipitation of hnRNPC and p53 protein. HCT116+/+ cells were transfected with snoVector, snoSNHG1, or snoSNHG1Del. The cells were lysed at 48 h after transfection, and then Western blotting was used to determine p53 levels. Below each panel, relative quantifications are indicated with respect to control samples set to a value of one.
RNA pull‐down assay was performed using biotin‐labeled RNA SNHG1, G‐rich‐region‐deleted SNHG1, control RNA, and total cell extracts.
HCT116+/+ cells were transfected with NC or NCL siRNA and treated with or without 0.2 μg/ml doxorubicin for 24 h. Nuclear and cytoplasmic RNAs were extracted from equal numbers of HCT116+/+ cells and subjected to qRT–PCR analysis. The nuclear fractions of SNHG1 in various samples were calculated and normalized relative to the control nuclear proportion of SNHG1, the values shown are means ± SE (n = 3), and single star represents a P‐value ≤ 0.05 (two‐tailed unpaired Student's t‐test).
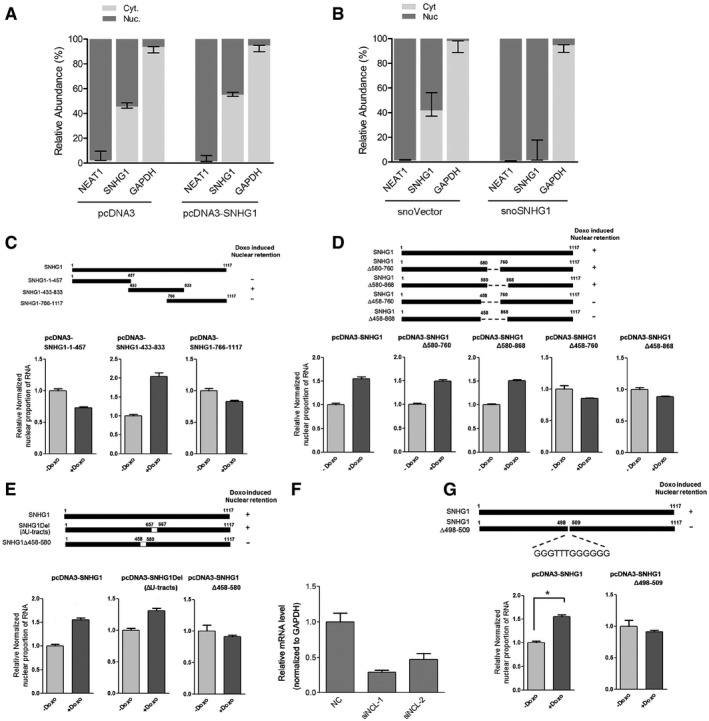
The vector pcDNA3 overexpresses RNA only in the cytoplasm. SNHG1 was overexpressed using pcDNA3, and nuclear and cytoplasmic RNAs extracted from equal numbers of HCT116+/+ cells were assayed using qRT–PCR; GAPDH and NEAT1 RNAs were used as RNA markers. Values are means ± SD (n = 3).
SnoVector can overexpress RNA in the nucleus. SNHG1 was overexpressed using snoVector, and nuclear and cytoplasmic RNAs extracted from equal numbers of HCT116+/+ cells were assayed using qRT–PCR; error bars represent SD (n = 3).
Construction of pcDNA3‐based SNHG1 truncated forms pcDNA3‐SNHG1‐1‐457, pcDNA3‐SNHG1‐433‐833, and pcDNA3‐SNHG1‐766‐1117. Truncated SNHG1 constructs were overexpressed in cells, and nuclear and cytoplasmic RNAs extracted from equal numbers of HCT116+/+ cells were assayed by performing qRT–PCR with primers specific for pcDNA3 products. Normalized proportion of nuclear pcDNA3‐expressed RNA was calculated. Values are means ± SE (n = 3).
Construction of pcDNA3‐based region‐deleted forms of SNHG1: pcDNA3‐SNHG1Δ580‐760, pcDNA3‐SNHG1Δ580‐868, pcDNA3‐SNHG1Δ450‐760, and pcDNA3‐SNHG1Δ458‐868. The mutants were overexpressed, and nuclear and cytoplasmic RNAs extracted from equal numbers of HCT116+/+ cells were assayed using qRT–PCR. Normalized proportion of nuclear pcDNA3‐expressed RNA was calculated. Values are means ± SE (n = 3).
Construction of pcDNA3‐based SNHG1 truncated forms pcDNA3‐SNHG1‐Δ458‐580 and pcDNA3‐SNHG1Del. The mutants were overexpressed, and nuclear and cytoplasmic RNAs extracted from equal numbers of HCT116+/+ cells were assayed using qRT–PCR. Normalized proportion of nuclear pcDNA3‐expressed RNA was calculated. Values are means ± SE (n = 3).
HCT116+/+ cells were transfected with NC and NCL siRNAs, and after 48 h, RNA was extracted for qRT–PCR analysis to measure NCL. Values are means ± SE (n = 3).
HCT116+/+ cells were transfected with pcDNA3‐based SNHG1 vector and Δ498–509 G‐rich‐region‐deleted SNHG1 vector and were treated with or without 0.2 μg/ml doxorubicin for 24 h. Nuclear and cytoplasmic RNAs were extracted from equal numbers of HCT116+/+ cells and subjected to qRT–PCR analysis. The normalized nuclear proportions of SNHG1 and SNHG1Δ498‐509 were calculated and normalized relative to the control nuclear proportion of SNHG1. Values are means ± SE (n = 3), and single star represents a P‐value ≤ 0.05 (two‐tailed unpaired Student's t‐test).
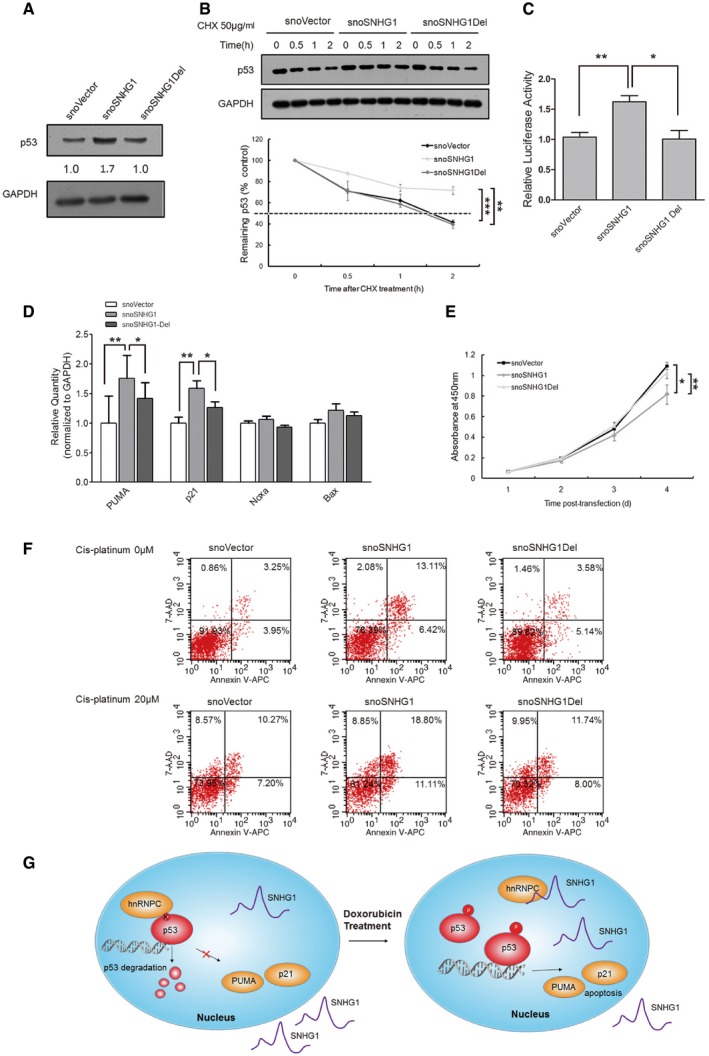
HCT116+/+ cells were transfected with snoVector, snoSNHG1, and snoSNHG1Del, and at 48 h after transfection, cell lysates were analyzed by means of Western blotting. GAPDH was used as a control, and below each panel, relative quantifications are shown with respect to control samples set to a value of one.
HCT116+/+ cells were transfected with snoVector, snoSNHG1, and snoSNHG1Del, cultured with CHX (50 μg/ml) for different times, and then harvested for Western blotting. The p53 and GAPDH signals in the immunoblots were quantified using densitometry, and the p53/GAPDH ratios were normalized relative to time zero and plotted against time. Values are means ± SD (n = 3), and triple stars and double stars represent P‐values ≤ 0.001 and 0.01 (two‐tailed unpaired Student's t‐test), respectively.
Promoter fragments of 13 p53 target genes were cloned into pGL3‐enhancer luciferase‐reporter vector for detecting p53 transcriptional activity. HCT116+/+ cells were transfected with the luciferase reporter together with snoVector, snoSNHG1, and snoSNHG1Del, and 48 h later, cells were cultured and reporter activity was measured and plotted after normalizing against Renilla luciferase activity. Values are means ± SD (n = 3), and double stars and single star represent P‐values ≤ 0.01 and 0.05 (two‐tailed unpaired Student's t‐test), respectively.
HCT116+/+ cells were transfected with snoVector, snoSNHG1, and snoSNHG1Del, and 48 h later, mRNA levels of the p53 targets p21, PUMA, Noxa, and Bax were determined by performing qRT–PCR. Values are means ± SE (n = 3), and double stars and single star represent P‐values ≤ 0.01 and 0.05 (two‐tailed unpaired Student's t‐test), respectively.
Proliferation rate of transfected cells. HCT116+/+ cells were transfected with snoVector, snoSNHG1, and snoSNHG1Del and then cultured in 96‐well plates, and the number of viable cells was evaluated daily using a CCK‐8 kit. Values are means ± SD (n = 3), and double stars and single star represent P‐values ≤ 0.01 and 0.05 (two‐tailed unpaired Student's t‐test), respectively.
HCT116+/+ cells were transfected with snoVector, snoSNHG1, and snoSNHG1Del, and then treated or not treated with 20 μM cisplatin. At 48 h after transfection, the apoptosis ratio was measured using flow cytometry. A representative figure from three independent experiments is shown.
A model depicting SNHG1 regulation of the interaction between hnRNPC and p53 under distinct conditions (left, normal condition; right, under doxorubicin treatment).
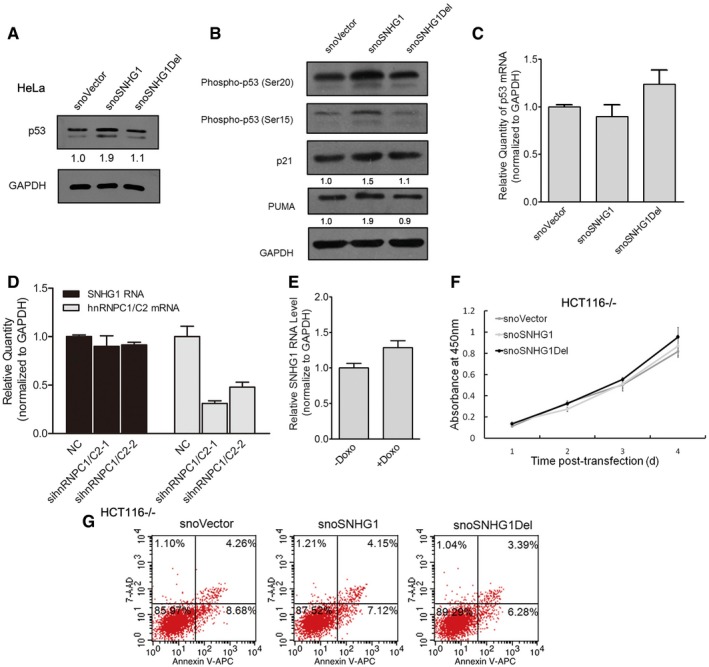
snoVector, snoSNHG1, and snoSNHG1Del were transfected into HeLa cells, and 48 h later, cell lysates were analyzed by means of Western blotting for p53 and GAPDH. Below each panel, relative quantifications are indicated with respect to control samples set to a value of one.
snoVector, snoSNHG1, and snoSNHG1Del were transfected into HCT116+/+ cells, and 48 h later, cell lysates were analyzed by means of Western blotting for phospho‐p53 Ser15, p‐p53 Ser20, PUMA, p21, and GAPDH. Below each panel, relative quantifications are indicated with respect to control samples set to a value of one.
HCT116+/+ cells were transfected with NC and hnRNPC1/C2 siRNAs, and 48 h later, RNA was extracted for qRT–PCR analysis to test for p53 mRNA. Values are means ± SD (n = 3).
HCT116+/+ cells were transfected with hnRNPC1/C2 siRNAs, and 48 h later, RNA was extracted for qRT–PCR analysis to test for SNHG1 and hnRNPC mRNAs. Values are means ± SD (n = 3).
HCT116+/+ cells were treated with 0.2 μg/ml doxorubicin for 24 h, and then RNA was extracted for qRT–PCR analysis to measure SNHG1 expression levels; error bars represent SD (n = 3).
Proliferation rates of HCT116−/− cells transfected with snoVector, snoSNHG1, and snoSNHG1Del. Cells were cultured in 96‐well plates and the number of viable cells was evaluated daily using a CCK‐8 kit. Error bars represent SD (n = 3).
HCT116−/− cells were transfected with snoVector, snoSNHG1, and snoSNHG1Del and then cultured for 48 h and analyzed using flow cytometry. A representative figure from three independent experiments is shown.
Similar articles
-
LncRNA DANCR counteracts premature ovarian insufficiency by regulating the senescence process of granulosa cells through stabilizing the interaction between p53 and hNRNPC.J Ovarian Res. 2023 Feb 18;16(1):41. doi: 10.1186/s13048-023-01115-3. J Ovarian Res. 2023. PMID: 36805799 Free PMC article.
-
Long noncoding RNA SNHG1 predicts a poor prognosis and promotes hepatocellular carcinoma tumorigenesis.Biomed Pharmacother. 2016 May;80:73-79. doi: 10.1016/j.biopha.2016.02.036. Epub 2016 Mar 15. Biomed Pharmacother. 2016. PMID: 27133041
-
LncRNA SNHG1 promotes liver cancer development through inhibiting p53 expression via binding to DNMT1.Eur Rev Med Pharmacol Sci. 2019 Apr;23(7):2768-2776. doi: 10.26355/eurrev_201904_17550. Eur Rev Med Pharmacol Sci. 2019. PMID: 31002127
-
Mechanisms of Long Noncoding RNA Nuclear Retention.Trends Biochem Sci. 2020 Nov;45(11):947-960. doi: 10.1016/j.tibs.2020.07.001. Epub 2020 Aug 13. Trends Biochem Sci. 2020. PMID: 32800670 Review.
-
Mitochondrial and nuclear p53 localization in cardiomyocytes: redox modulation by doxorubicin (Adriamycin)?Antioxid Redox Signal. 2007 Jul;9(7):1001-8. doi: 10.1089/ars.2007.1632. Antioxid Redox Signal. 2007. PMID: 17508921 Review.
Cited by
-
Knockdown of LINC00662 represses AK4 and attenuates radioresistance of oral squamous cell carcinoma.Cancer Cell Int. 2020 Jun 16;20:244. doi: 10.1186/s12935-020-01286-9. eCollection 2020. Cancer Cell Int. 2020. PMID: 32549791 Free PMC article.
-
The long noncoding RNA SNHG1 regulates colorectal cancer cell growth through interactions with EZH2 and miR-154-5p.Mol Cancer. 2018 Sep 28;17(1):141. doi: 10.1186/s12943-018-0894-x. Mol Cancer. 2018. PMID: 30266084 Free PMC article.
-
MicroRNA Profiling in Oesophageal Adenocarcinoma Cell Lines and Patient Serum Samples Reveals a Role for miR-451a in Radiation Resistance.Int J Mol Sci. 2020 Nov 24;21(23):8898. doi: 10.3390/ijms21238898. Int J Mol Sci. 2020. PMID: 33255413 Free PMC article.
-
Suppression of Heterogeneous Nuclear Ribonucleoprotein C Inhibit Hepatocellular Carcinoma Proliferation, Migration, and Invasion via Ras/MAPK Signaling Pathway.Front Oncol. 2021 Apr 16;11:659676. doi: 10.3389/fonc.2021.659676. eCollection 2021. Front Oncol. 2021. PMID: 33937074 Free PMC article.
-
Knockdown of spliceosome U2AF1 significantly inhibits the development of human erythroid cells.J Cell Mol Med. 2019 Aug;23(8):5076-5086. doi: 10.1111/jcmm.14370. Epub 2019 May 29. J Cell Mol Med. 2019. PMID: 31144421 Free PMC article.
References
-
- Vousden KH, Prives C (2009) Blinded by the light: the growing complexity of p53. Cell 137: 413–431 - PubMed
-
- Haupt Y, Maya R, Kazaz A, Oren M (1997) Mdm2 promotes the rapid degradation of p53. Nature 387: 296–299 - PubMed
-
- Honda R, Tanaka H, Yasuda H (1997) Oncoprotein MDM2 is a ubiquitin ligase E3 for tumor suppressor p53. FEBS Lett 420: 25–27 - PubMed
Publication types
MeSH terms
Substances
LinkOut - more resources
Full Text Sources
Other Literature Sources
Research Materials
Miscellaneous
