

Metabolic constraints on the evolution of antibiotic resistance
- PMID: 28265005
- PMCID: PMC5371735
- DOI: 10.15252/msb.20167028
Metabolic constraints on the evolution of antibiotic resistance
Abstract
Despite our continuous improvement in understanding antibiotic resistance, the interplay between natural selection of resistance mutations and the environment remains unclear. To investigate the role of bacterial metabolism in constraining the evolution of antibiotic resistance, we evolved Escherichia coli growing on glycolytic or gluconeogenic carbon sources to the selective pressure of three different antibiotics. Profiling more than 500 intracellular and extracellular putative metabolites in 190 evolved populations revealed that carbon and energy metabolism strongly constrained the evolutionary trajectories, both in terms of speed and mode of resistance acquisition. To interpret and explore the space of metabolome changes, we developed a novel constraint-based modeling approach using the concept of shadow prices. This analysis, together with genome resequencing of resistant populations, identified condition-dependent compensatory mechanisms of antibiotic resistance, such as the shift from respiratory to fermentative metabolism of glucose upon overexpression of efflux pumps. Moreover, metabolome-based predictions revealed emerging weaknesses in resistant strains, such as the hypersensitivity to fosfomycin of ampicillin-resistant strains. Overall, resolving metabolic adaptation throughout antibiotic-driven evolutionary trajectories opens new perspectives in the fight against emerging antibiotic resistance.
Keywords: antibiotic resistance; constraint‐based modeling; efflux pump; evolution; metabolism.
© 2017 The Authors. Published under the terms of the CC BY 4.0 license.
Figures
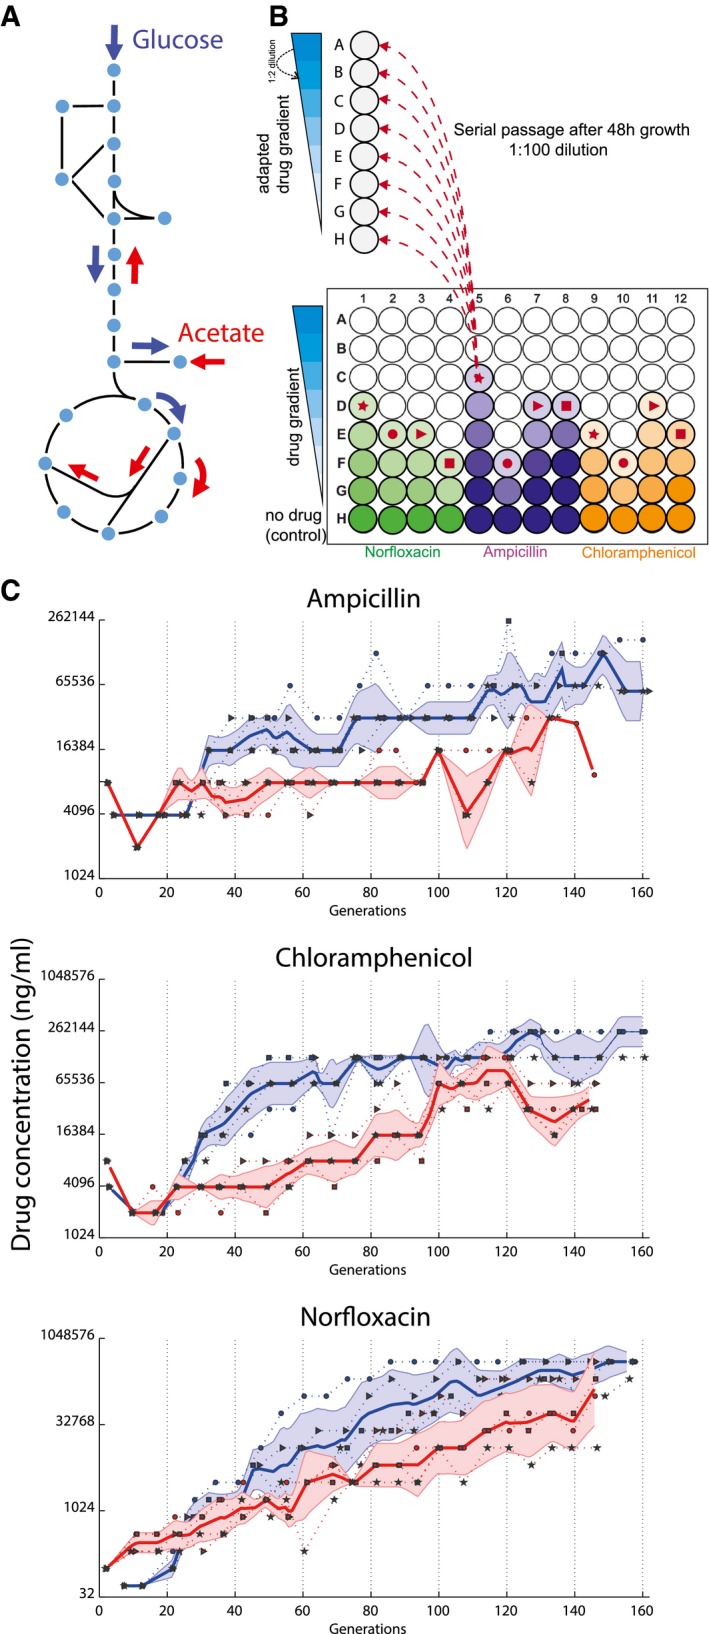
Metabolism on glucose and acetate. Glucose is catabolized by glycolysis and can be fermented and/or oxidized via secretion of acetate or tricarboxylic acid cycle (TCA) (blue arrows), respectively. Acetate forces a complete different distribution of internal fluxes and bacterial growth is strictly respiratory (red arrows).
Schematic representation of the evolutionary experiment. Each well in a column corresponds to a different dilution of the same antibiotic. Every 48 h, out of the cultures that grew to an OD600 ≥ 0.5, the one that survived the highest antibiotic concentration is selected. Selected population for the next passaging step are indicated by the symbols: ●, ►, ■, ★ indicating the four lineages evolved under the same selective pressure. Selected evolved populations are diluted into eight different antibiotic concentrations, such that at every passaging step 12 populations on glucose and 12 populations on acetate are propagated. At each inoculation step, the highest drug concentration tested was adjusted to be at least double of the concentration where bacterial growth was detected in the previous passaging step.
Evolution of resistance. Each dot (●, ►, ■, ★) corresponds to one evolved population selected during the serial passage experiment. Y‐axis indicates the antibiotic concentration at which evolved populations were selected during serial passages (blue, glucose; red, acetate). Solid line: median of the four lineages, dotted line: single lineages, shaded region is median ± standard deviation across the four lineages.
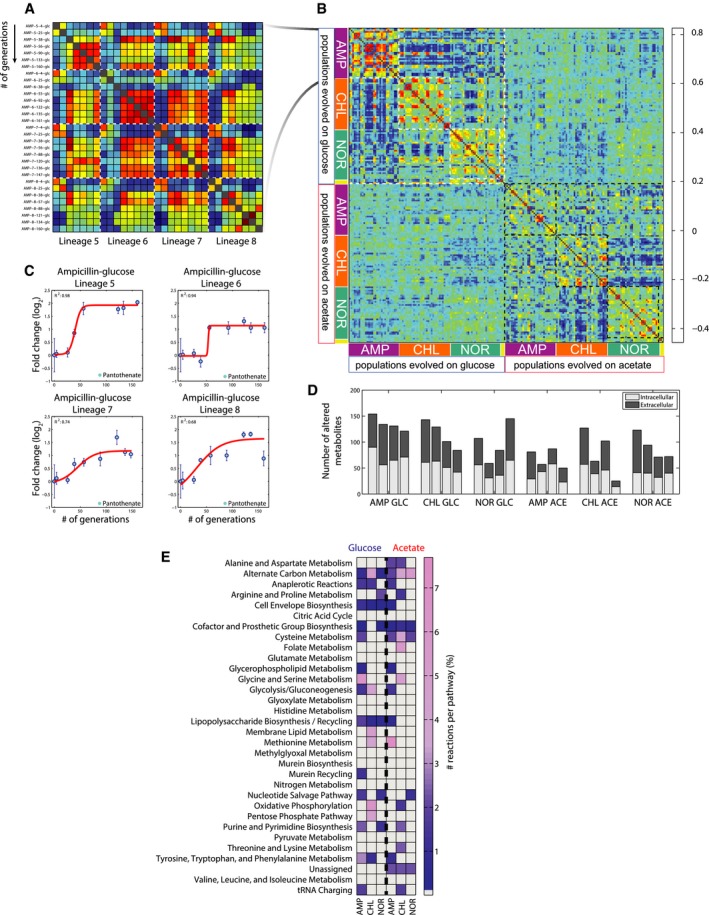
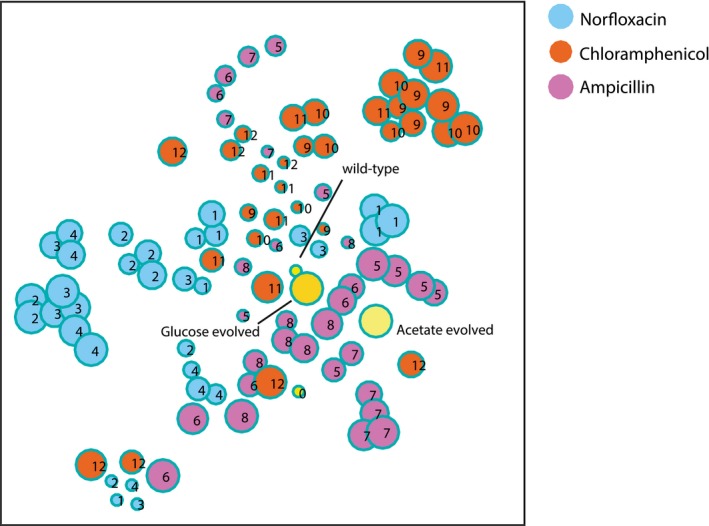
Pairwise similarity between metabolite profiles of populations that evolved resistance to ampicillin on glucose. Spearman correlation (Fieller et al, 1957) is used to assess the pairwise similarity between Z‐score normalized metabolite changes. Selected populations are indicated by (i) three letters indicating the selective pressure, in this case ampicillin (AMP), (ii) followed by evolutionary lineages, referred to as lineage 1–12, where 5–8 evolved resistance to ampicillin, and (iii) number of generations (Dataset EV2).
Pairwise similarity between metabolome profiles of evolved populations. Spearman correlation (Fieller et al, 1957) is used to assess the pairwise similarity between Z‐score normalized metabolite changes in the 193 selected mutants. Yellow bars on the side indicate the wild‐type ancestor and the two populations evolved in glucose and acetate antibiotic‐free media. For a given drug, all selected populations of one lineage from the evolutionary experiment are in consecutive order and all four lineages are displayed one after another.
Intracellular pantothenate levels in ampicillin‐resistant Escherichia coli populations. Values are normalized to the wild‐type ancestor. For the populations belonging to each of the four independently evolved lineages, a sigmoidal curve is fitted and the resulting adjusted sum of squared errors (R 2) is reported. Data are the mean ± standard deviation across biological replicates.
Metabolic rearrangements. For each independently evolved lineage, the number of metabolites with an adjusted R 2 from the fitting analysis greater or equal to an arbitrary stringent threshold of 0.6 is reported for intracellular and extracellular metabolites.
Distribution of predicted EMC across metabolic pathways. For each pathway, the relative percentage of EMCs is reported.
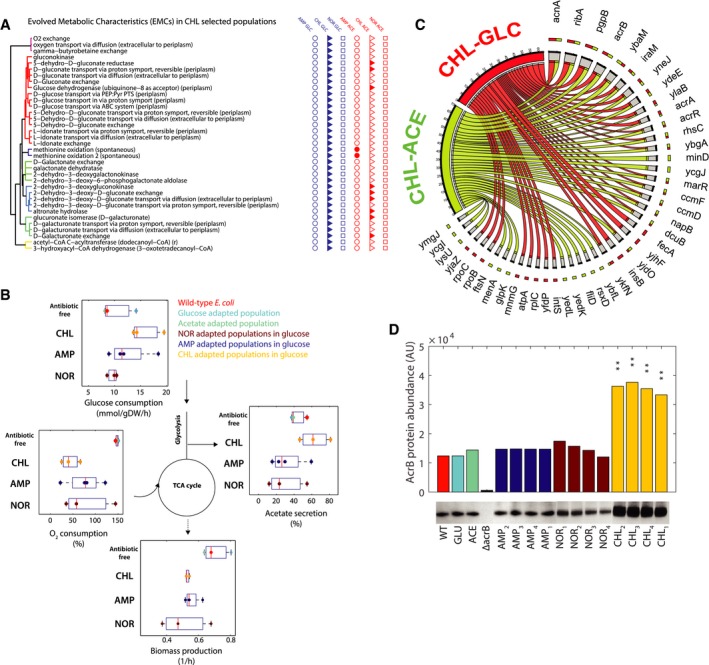
List of EMCs predicted in chloramphenicol‐glucose‐evolved mutants. Reactions are grouped on the basis of their topological distance, by means of the minimum number of connecting reactions on the metabolic network. For EMCs predicted in chloramphenicol‐glucose, filled marks on the right‐hand side highlight whether the same EMC was found also in the other evolved populations.
Experimentally measured fluxes exclusively in evolved populations grown in glucose minimal medium. Absolute glucose consumption is reported in mmol/gDW/h, growth rate in h−1. Acetate secretion and oxygen consumption rates are reported as a percentage relative to glucose uptake. Data have been grouped according to the selective pressure and for each group. The tops and bottoms of each box are the 25th and 75th percentiles of the samples, respectively, while the red line in the middle of each box is the sample median (Dataset EV5 contains mean ± SD of three biological replicates).
Genetic changes identified by whole‐genome sequencing. Genetic changes identified in at least two out of the four lineages evolved under the same selective pressure are retained. The bipartite graph links selective pressures (i.e. chloramphenicol‐glucose and chloramphenicol‐acetate) to mutated genes. Arrow size represents the number of lineages with at least one sequence change in the corresponding gene or its upstream regulatory sequence.
Western blot analysis monitoring the AcrB protein abundance across antibiotic‐resistant populations evolved in glucose, wild type and populations evolved in glucose and acetate without antibiotics. Asterisks indicate statistically significant difference from wild type E. coli (**P < 0.01 from t‐test analysis). Data are the mean ± SD of two replicates. One of the Western blots is shown.
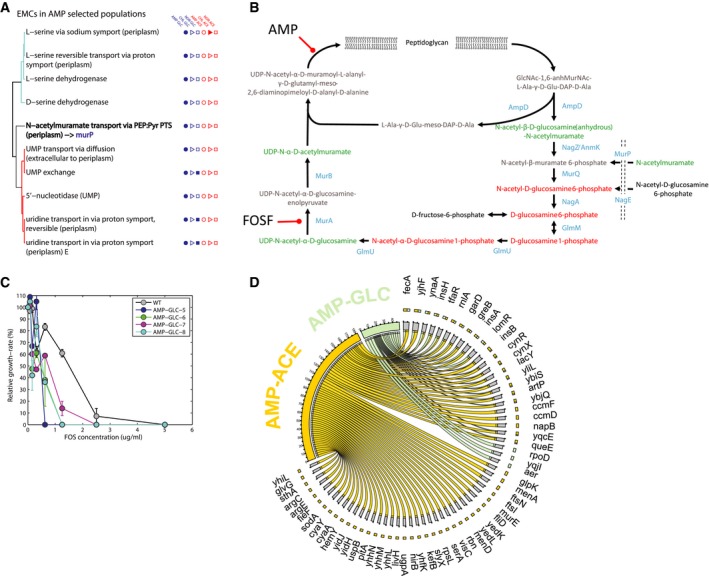
List of EMCs predicted in ampicillin‐glucose‐evolved populations. Reactions are grouped on the basis of their topological distance, by means of the minimum number of connecting reactions on the metabolic network. EMCs detected in other evolved populations are highlighted by filled marks on the right‐hand side.
Schematic representation of cell wall recycling pathway in Escherichia coli, adapted from Gisin et al (2013). Detected metabolites are highlighted in red or green according to a significant accumulation or depletion in AMP‐evolved populations.
Sensitivity analysis of ampicillin‐glucose to fosfomycin (FOSF). The relative growth rate inhibition of different FOSF concentrations relative to antibiotic‐free growth is reported for wild‐type (WT) and the populations evolved in the presence of ampicillin and glucose. Data are the mean ± SD of three biological replicates.
Genetic changes identified by whole‐genome sequencing. Genetic changes identified in at least three out of the four lineages evolved under the same selective pressure are retained. The bipartite graph links selective pressures (i.e. ampicillin‐glucose and ampicillin‐acetate) to mutated genes. Arrow size represents the number of lineages with at least a mutation (e.g. SNP) in the corresponding gene.
References
-
- Björkman J, Nagaev I, Berg OG, Hughes D, Andersson DI (2000) Effects of environment on compensatory mutations to ameliorate costs of antibiotic resistance. Science 287: 1479–1482 - PubMed
-
- Blair JMA, Bavro VN, Ricci V, Modi N, Cacciotto P, Kleinekathöfer U, Ruggerone P, Vargiu AV, Baylay AJ, Smith HE, Brandon Y, Galloway D, Piddock LJV (2015a) AcrB drug‐binding pocket substitution confers clinically relevant resistance and altered substrate specificity. Proc Natl Acad Sci USA 112: 3511–3516 - PMC - PubMed
-
- Blair JMA, Webber MA, Baylay AJ, Ogbolu DO, Piddock LJV (2015b) Molecular mechanisms of antibiotic resistance. Nat Rev Microbiol 13: 42–51 - PubMed
MeSH terms
Substances
LinkOut - more resources
Full Text Sources
Other Literature Sources
Medical
