. 2017 Mar 21;114(12):E2466-E2475.
doi: 10.1073/pnas.1614462114. Epub 2017 Mar 6.

Amyotrophic lateral sclerosis-linked mutations increase the viscosity of liquid-like TDP-43 RNP granules in neurons

Affiliations

Amyotrophic lateral sclerosis-linked mutations increase the viscosity of liquid-like TDP-43 RNP granules in neurons

Pallavi P Gopal et al. Proc Natl Acad Sci U S A. .

Abstract

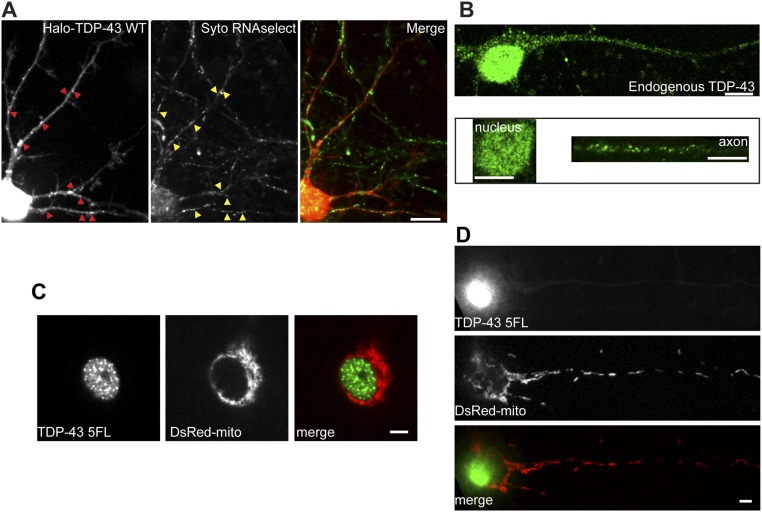
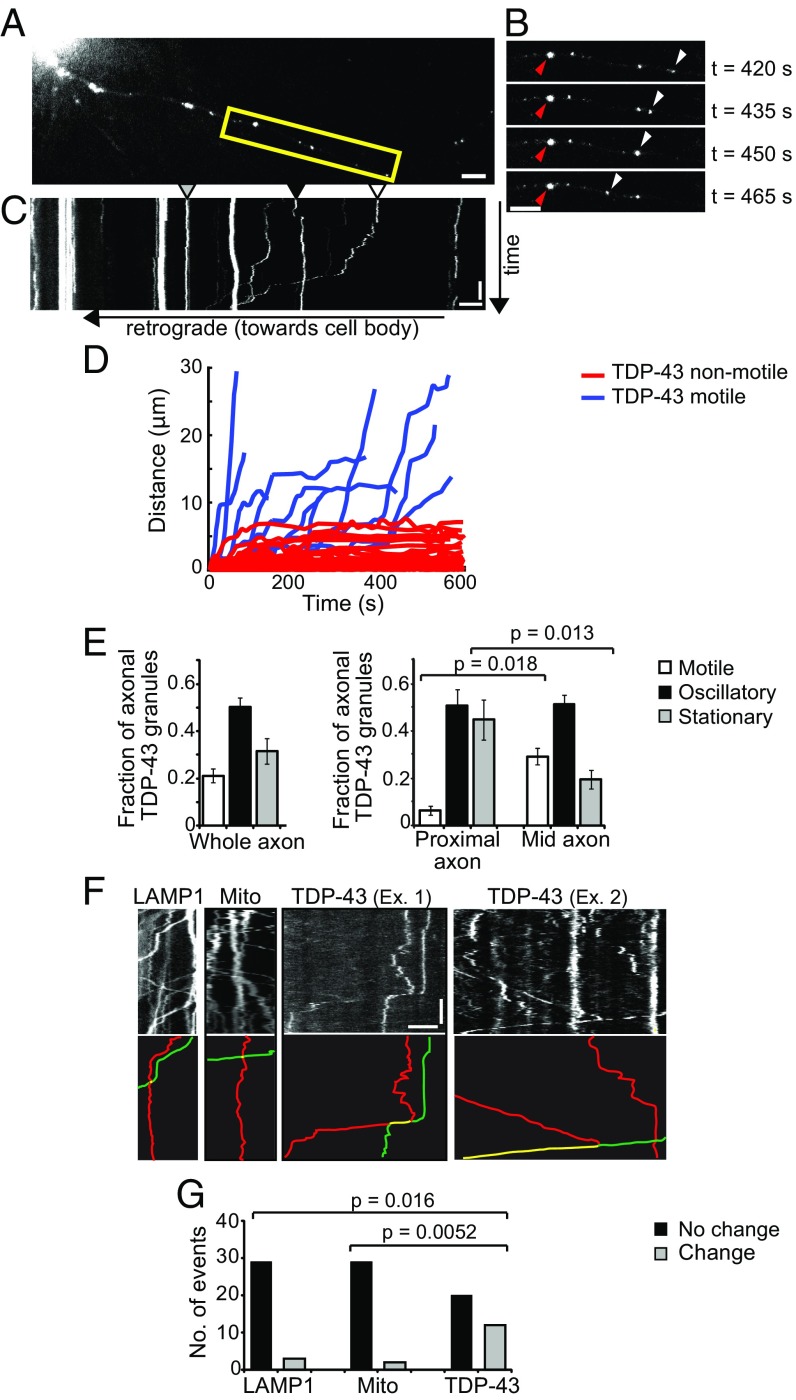
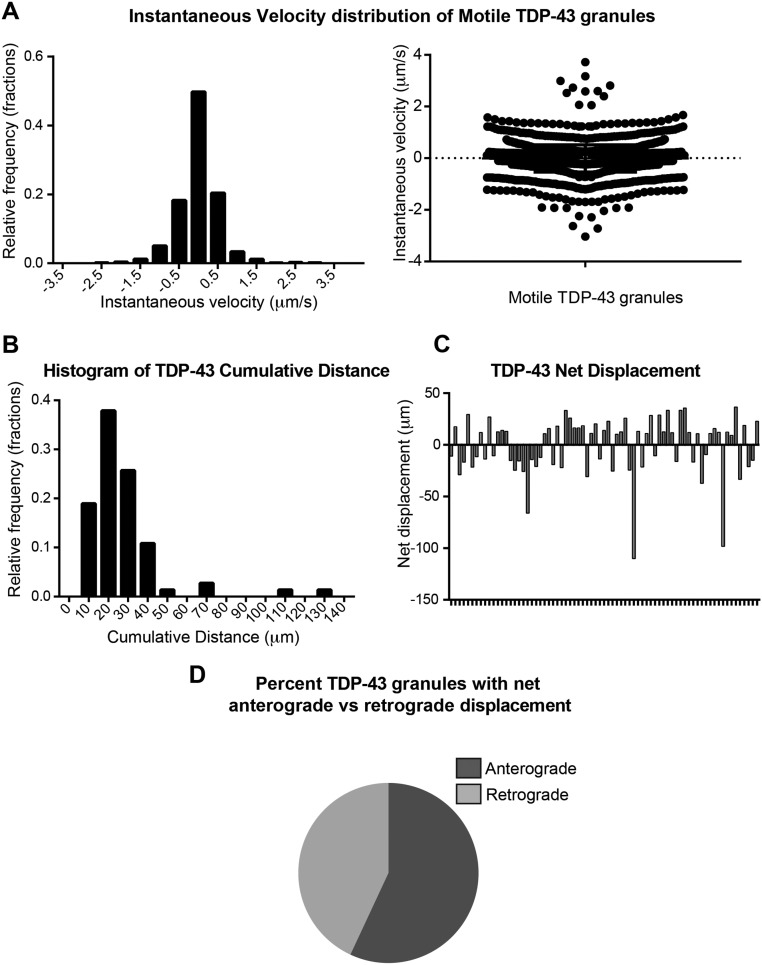
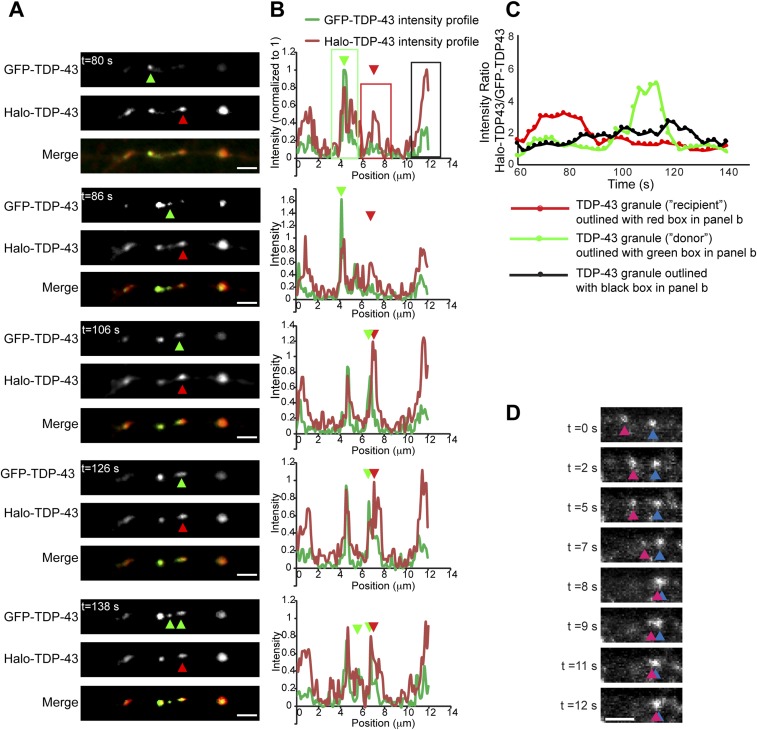
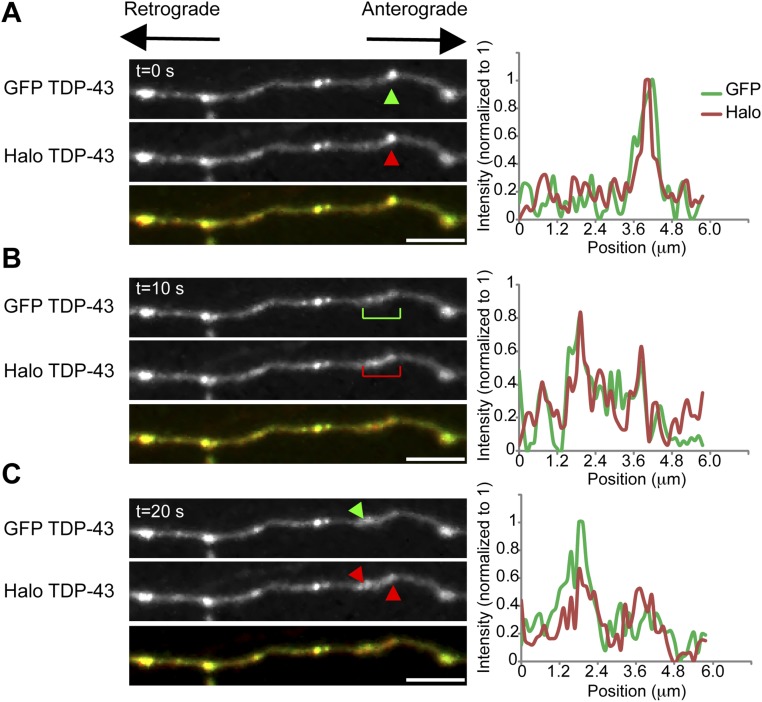
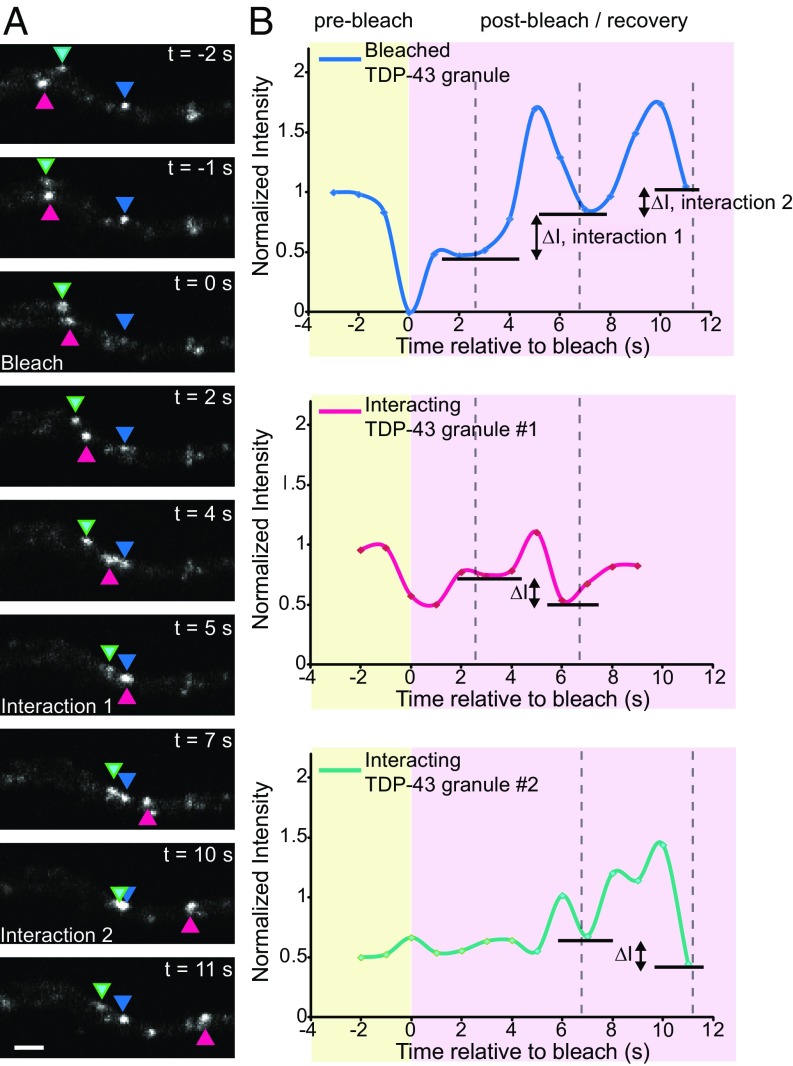
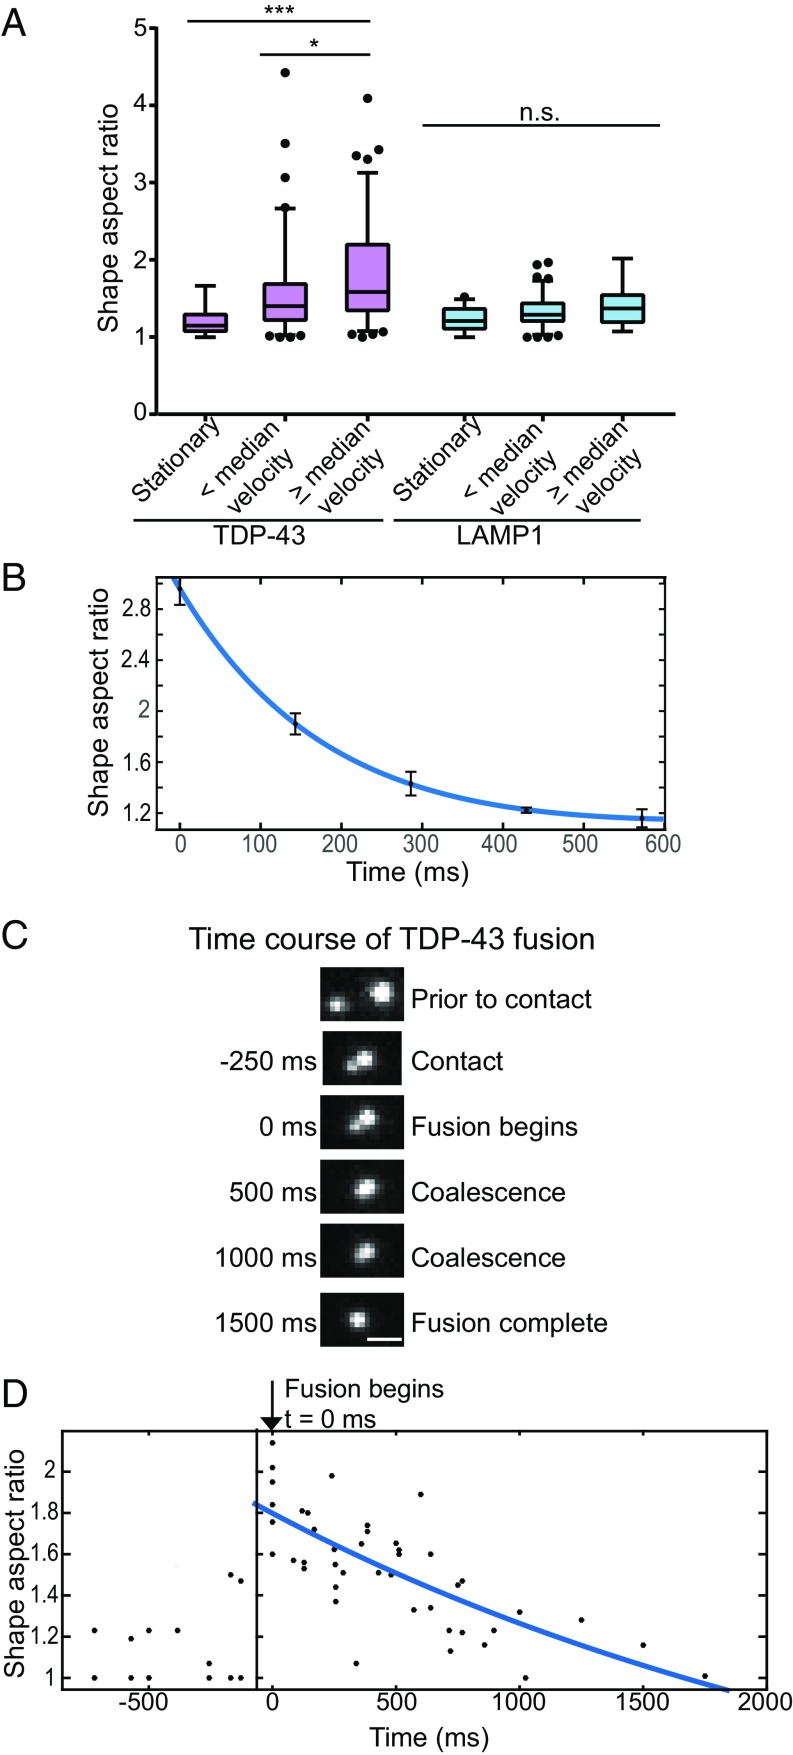
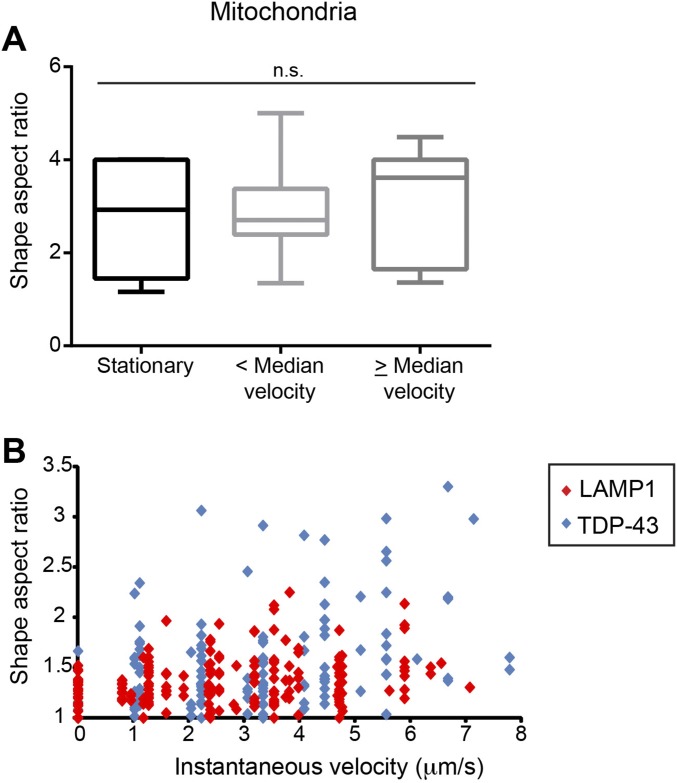
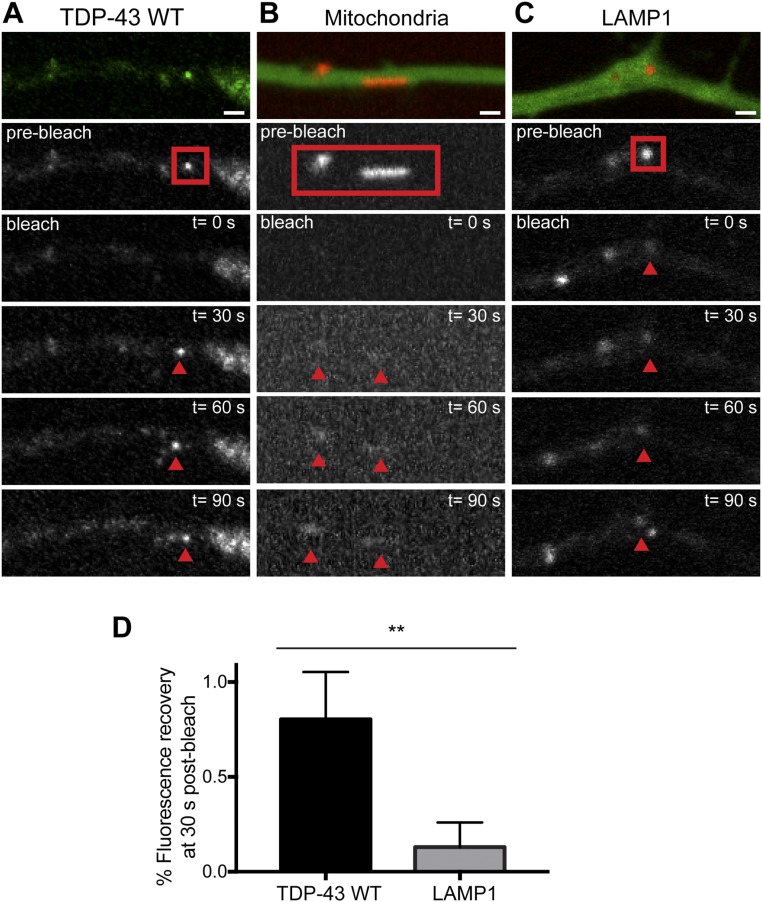
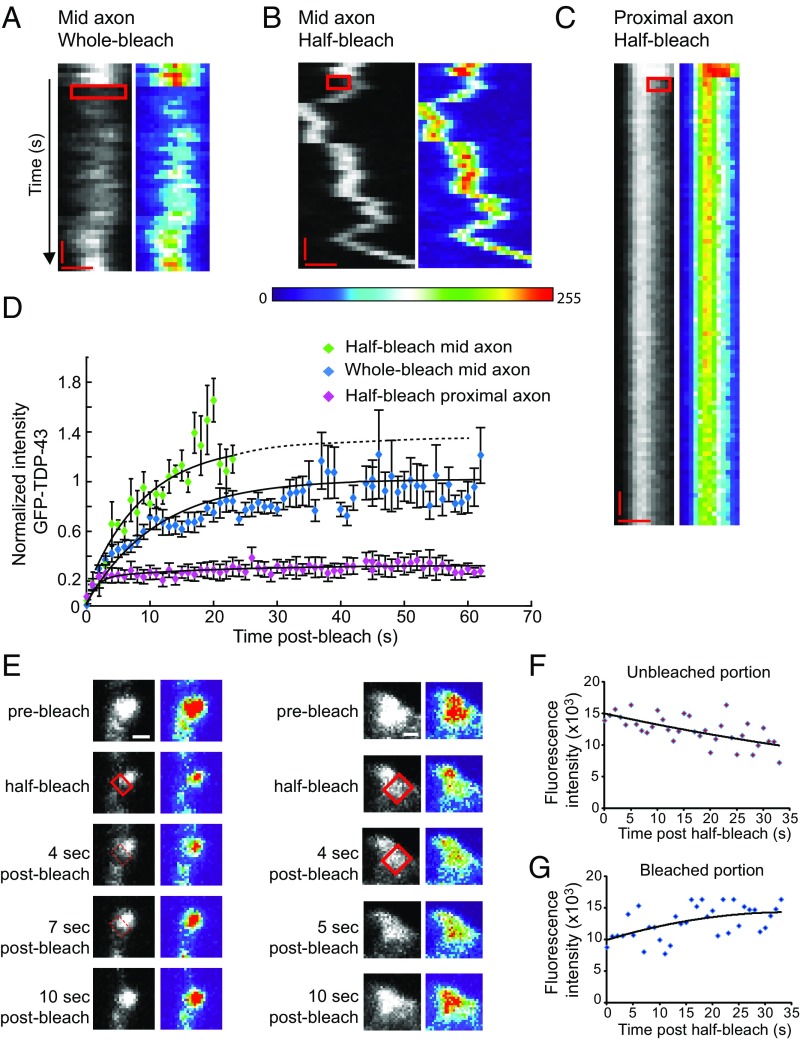
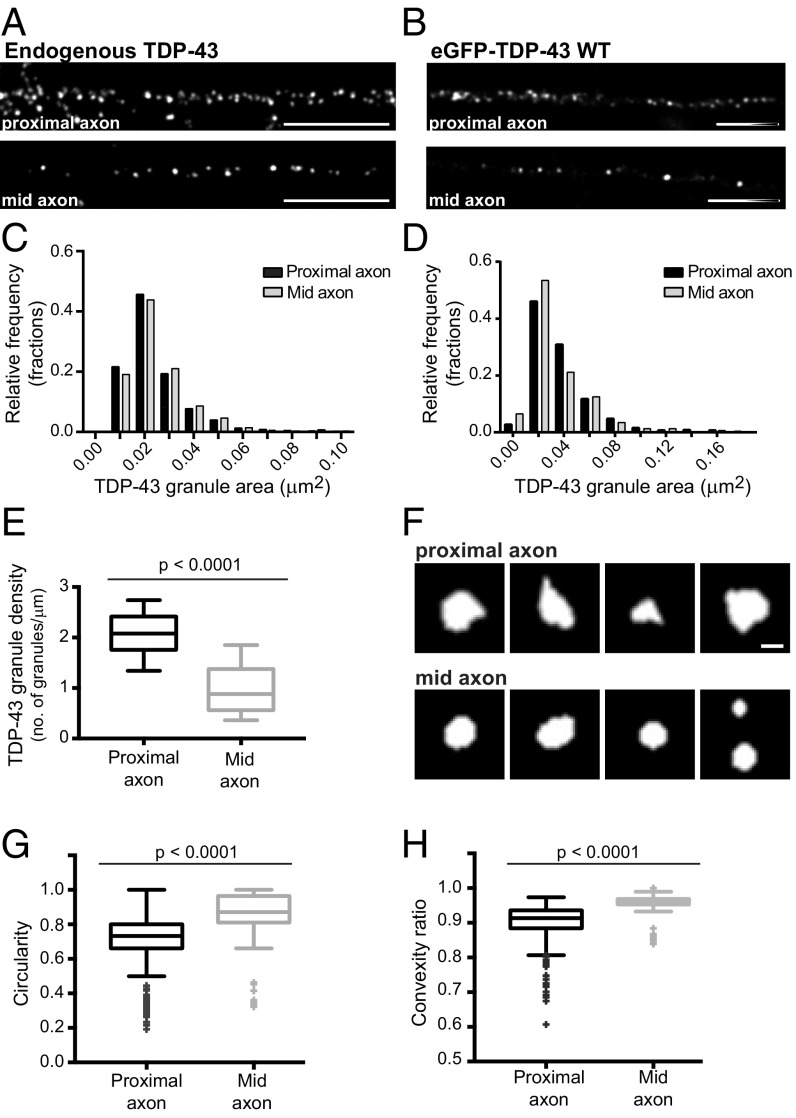
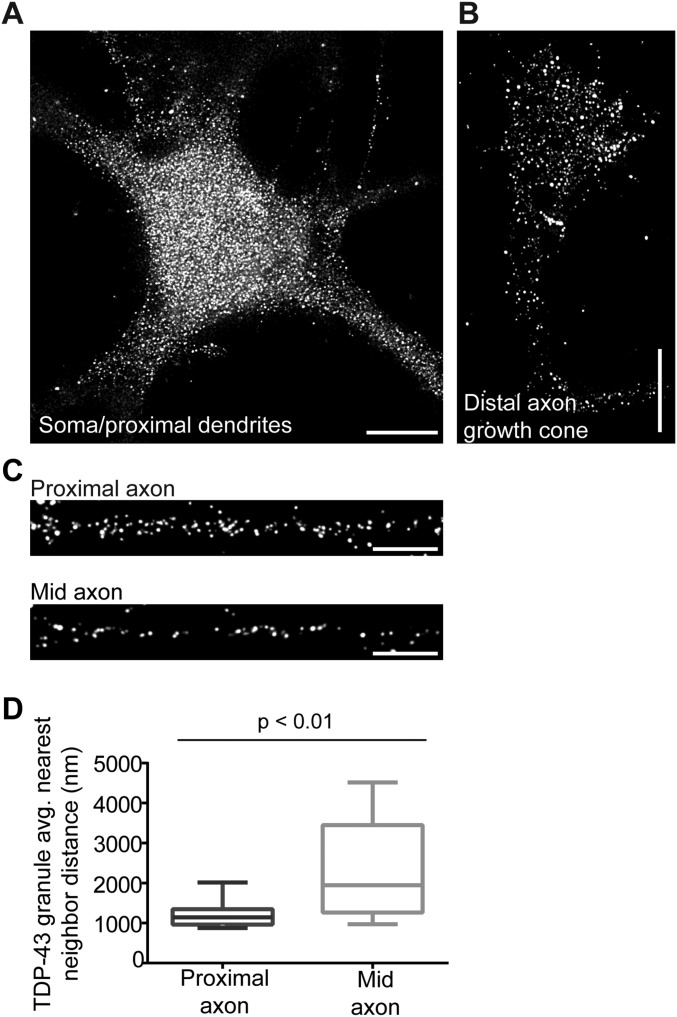
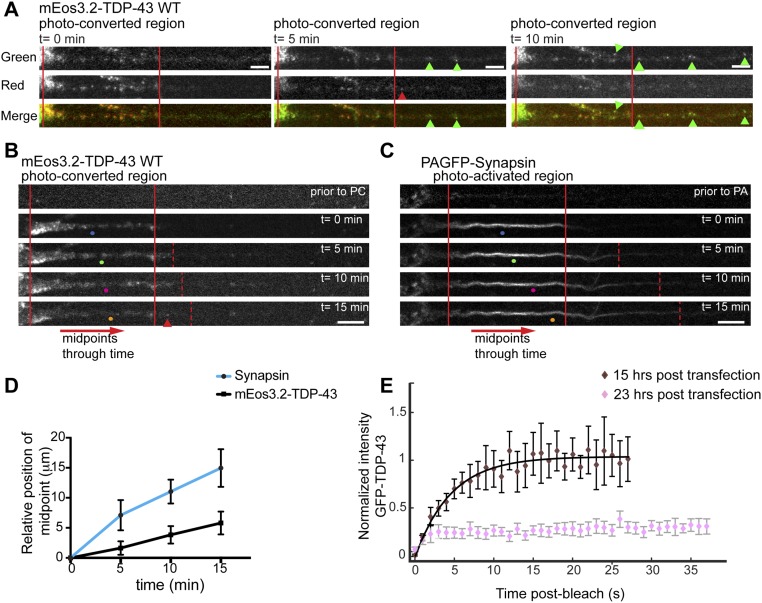
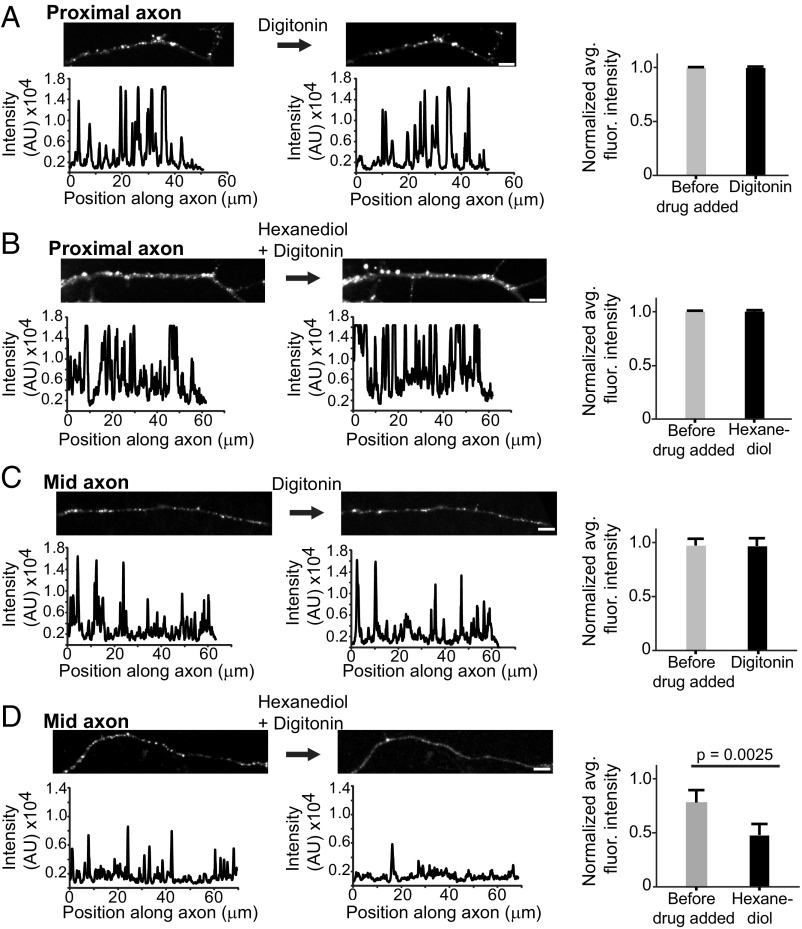
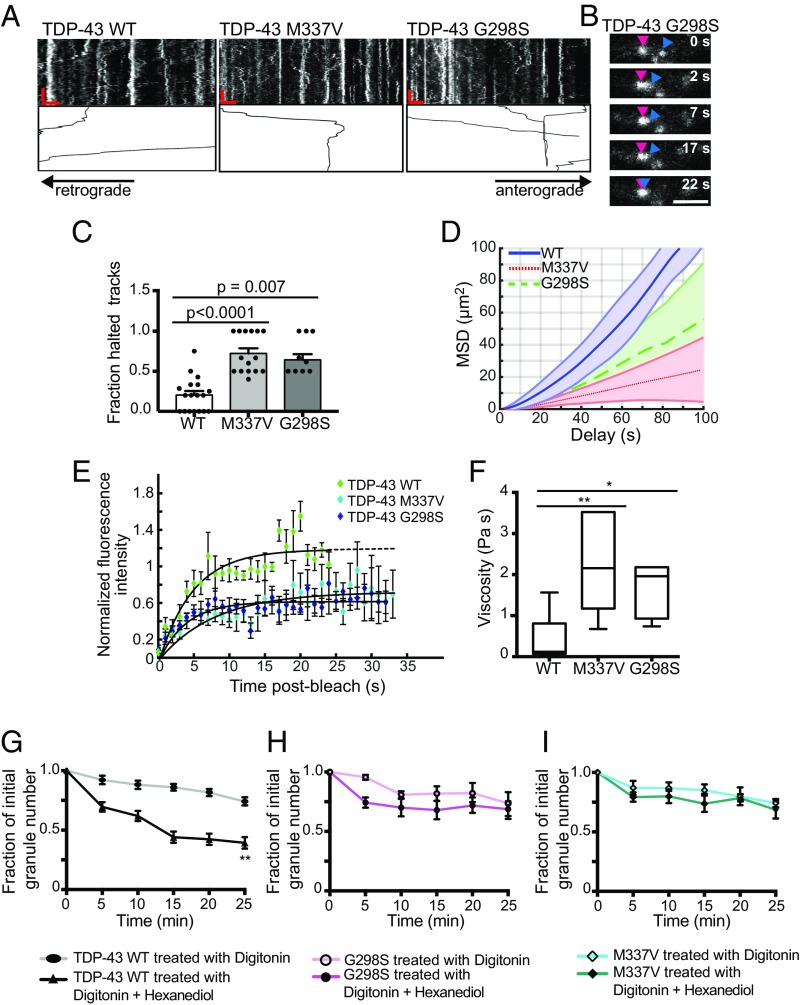
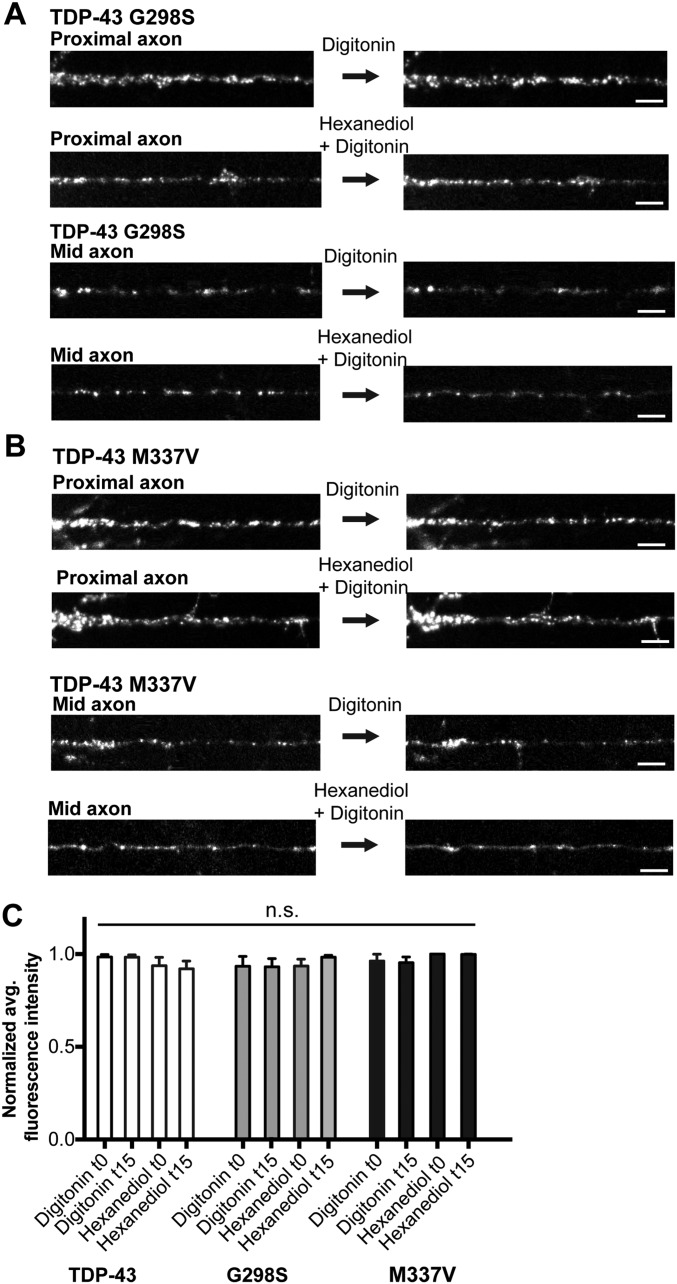
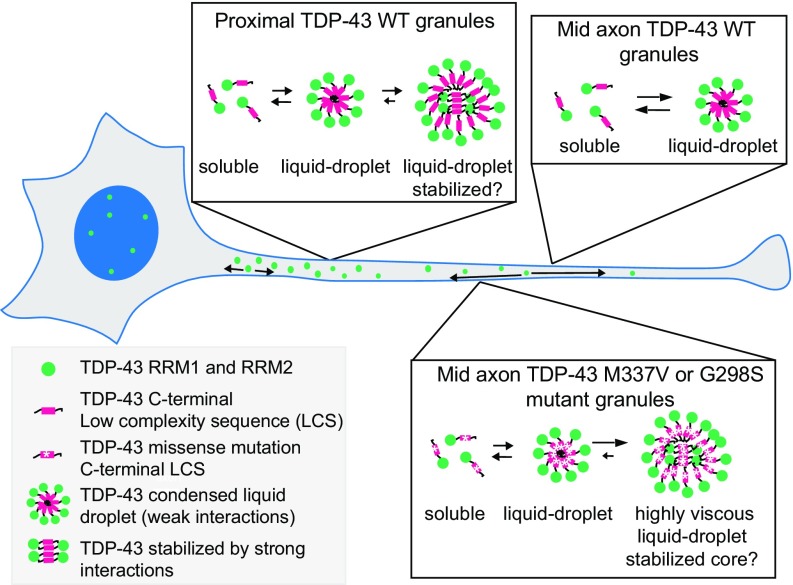
Ribonucleoprotein (RNP) granules are enriched in specific RNAs and RNA-binding proteins (RBPs) and mediate critical cellular processes. Purified RBPs form liquid droplets in vitro through liquid-liquid phase separation and liquid-like non-membrane-bound structures in cells. Mutations in the human RBPs TAR-DNA binding protein 43 (TDP-43) and RNA-binding protein FUS cause amyotrophic lateral sclerosis (ALS), but the biophysical properties of these proteins have not yet been studied in neurons. Here, we show that TDP-43 RNP granules in axons of rodent primary cortical neurons display liquid-like properties, including fusion with rapid relaxation to circular shape, shear stress-induced deformation, and rapid fluorescence recovery after photobleaching. RNP granules formed from wild-type TDP-43 show distinct biophysical properties depending on axonal location, suggesting maturation to a more stabilized structure is dependent on subcellular context, including local density and aging. Superresolution microscopy demonstrates that the stabilized population of TDP-43 RNP granules in the proximal axon is less circular and shows spiculated edges, whereas more distal granules are both more spherical and more dynamic. RNP granules formed by ALS-linked mutant TDP-43 are more viscous and exhibit disrupted transport dynamics. We propose these altered properties may confer toxic gain of function and reflect differential propensity for pathological transformation.

Keywords: TDP-43; amyotrophic lateral sclerosis; liquid droplets; neurons; ribonucleoprotein granules.


Conflict of interest statement

The authors declare no conflict of interest.

Figures

Fig. S1.
Fig. S1.
WT TDP-43 granules incorporate RNA, whereas TDP-43 RNA binding mutant does not form axonal granules. (A, Left) Cortical neurons (DIV7–9) expressing Halo– or EGFP–TDP-43 WT yields strong nuclear TDP-43 expression and TDP-43 puncta in the neurites. SYTO RNASelect, a cell-permeant RNA dye, allows for live visualization of RNA associated with Halo–TDP-43 (A, Center) and shows that most TDP-43 granules are associated with RNA (A, Right, merge). (Scale bar: 10 μm.) (B) Immunofluorescence for endogenous TDP-43 in DIV8–10 cortical neurons shows strong nuclear expression and axonal puncta, similar to the exogenous expression pattern seen in A. (Upper) Contrast is adjusted to maximize visualization of nuclear and axonal TDP-43. (Lower) Contrast is linearly scaled to optimize visualization of nuclear TDP-43 (Left) and axonal TDP-43 granules (Right), respectively. (Scale bars: 5 μm.) (C) Specific aromatic residues in the RRMs are necessary for TDP-43 RNA binding; five point mutations that convert Phe to Leu (F to L) abolish the ability of TDP-43 to bind RNA (EGFP–TDP-43 5FL). (Scale bar: 5 μm.) Primary cortical neurons expressing EGFP–TDP-43 5FL maintain nuclear expression of mutant TDP-43. (D) Unlike WT TDP-43, TDP-43 5FL does not form axonal TDP-43 granules (compare A, Left with D, Upper). Fluorescently tagged mitochondria (DsRed-mito) allow for visualization of the soma and axonal cytoplasm. (Scale bar: 5 μm.)
Fig. 1.
Fig. 1.
Axonal TDP-43 RNP granule interactions often result in trajectory changes. (A) TDP-43 granules are observed along the axon of a primary cortical neuron (days in vitro 7–10) expressing EGFP–TDP-43 WT. The boxed area is enlarged in B. (B) Time-lapse images of a stationary TDP-43 granule (red arrowhead) and a motile TDP-43 granule (white arrowhead) at 15-s intervals. (Scale bars: A and B, 5 μm.) (C) Kymograph shows representative stationary (gray arrowhead), oscillatory (black arrowhead), and motile (white arrowhead) TDP-43 granules. (Scale bars: 5 μm and 100 s.) (D) Distance vs. time plot of representative motile TDP-43 granules; motile puncta show ≥10 μm net displacement in 10 min. (E) Fraction of axonal TDP-43 granules that are stationary, oscillatory, or motile (Left), binned according to location in the proximal or mid axon (Right) (mean ± SEM). ANOVA was performed, with a Tukey posttest (n = 17 neurons, four independent experiments). (F) Kymographs showing representative interactions between LAMP1 vesicles (Left), mitochondria (Center), and TDP-43 granules (Right). Intersecting tracks are highlighted in red and green below each kymograph, and interactions between tracks are highlighted in yellow. (Scale bars: 5 μm and 60 s.) (G) Interactions between LAMP1 vesicles (n = 32 interactions from 16 kymographs), mitochondria (n = 31 interactions from 16 kymographs), or TDP-43 granules (n = 32 interactions from 16 kymographs) that result in a change (gray bars) or no change (black bars) in trajectory following the interaction (χ2 test, P = 0.0017). A Fisher exact test with Bonferroni correction for multiple comparisons was performed, where P = 0.025 was used as the significance threshold.
Fig. S2.
Fig. S2.
Motility characteristics of axonal TDP-43 RNP transport granules (related to Fig. 1). (A) Frequency distribution and histogram of instantaneous velocities of motile TDP-43 granules. Motile granules are defined as those granules with ≥10 μm net displacement. Frequency distribution of cumulative distance (B) and representative net displacements of motile TDP-43 granules (C). (D) Fifty-four percent of motile TDP-43 granules undergo net anterograde transport, whereas 46% undergo net retrograde transport. Our transport analysis finds fewer motile TDP-43 RNP granules than a prior study characterizing TDP-43 motility in the axon (26); however, these differences can be accounted for by the more stringent criteria used here to define motile TDP-43 granules, as well as the subcategorization of oscillatory and stationary granules.
Fig. S3.
Fig. S3.
Interacting TDP-43 granules undergo fusion events that result in changes in composition (related to Fig. 2 and Movie S1).Time-lapse imaging of axonal TDP-43 RNP granules in neurons coexpressing EGFP–TDP-43 and Halo–TDP-43 demonstrates sporadic fusion events that result in an altered ratio of Halo–TDP-43/EGFP–TDP-43. (A and B) At 80 s, one TDP-43 granule (“donor,” green arrowhead, outlined with a green box on intensity profile) is composed of both EGFP–TDP-43 and Halo–TDP-43, based on signal intensities normalized to 0–1 for each channel (intensity plot profiles for each panel), whereas another TDP43 granule (“recipient,” red arrowhead, outlined with a red box on intensity profile) is composed of predominantly Halo–TDP-43. At 86 s, the EGFP–TDP-43 donor granule appears to split and moves toward the recipient Halo–TDP-43+ granule. Between t = 106 s and t = 126 s, mixing (“fusion”) occurs between the two granules, wherein the formerly Halo-predominant TDP-43 granule acquires EGFP–TDP-43 signal. At 138 s, a portion of the EGFP–TDP-43 signal remains with the recipient TDP-43 granule and a portion of EGFP–TDP-43 signal returns to the donor granule (also Movie S1). (Scale bars: 3 μm.). (C) Plot of rolling average of the Halo–TDP-43/EGFP–TDP-43 intensity ratio over time in the recipient (red circles), donor (green circles), and a noninteracting (black circles) TDP-43 granule. The Halo/GFP ratio shows a stepwise reduction in the recipient granule after fusion, whereas the donor granule shows a corresponding increase in the Halo/GFP ratio. In contrast, a distinct TDP-43 granule (outlined with a black box in B) that does not undergo any fusion event maintains a relatively constant ratio of Halo–TDP-43/EGFP–TDP-43. (D) Time-lapse imaging of proximal axonal TDP-43 granules demonstrates sporadic fusion events (related to Figs. 2 and 3). Similar to mid axonal granules, TDP-43 RNP granules in the proximal axon also undergo fusion. (Scale bar: 2 μm.)
Fig. S4.
Fig. S4.
Time-lapse imaging of axonal TDP-43 granules demonstrates sporadic fission events (related to Fig. 2). (A) Cortical neurons coexpressing EGFP–TDP-43 and Halo–TDP-43 were tracked to identify fission events that alter the ratio of EGFP–TDP-43/Halo–TDP-43. At t = 0 s, a TDP-43 granule (marked by arrowheads) is composed of both EGFP–TDP-43 and Halo–TDP-43 (EGFP/Halo ratio = 1:1, based on signal intensities normalized to 0–1 for each channel). At t = 10 s, the TDP-43 granule deforms (brackets) (B), and it splits into two granules at t = 20 s (C). The resulting “daughter” TDP-43 granules contain different ratios of EGFP/Halo (ratio of EGFP/Halo = 1.5:1 in the left daughter granule; ratio of EGFP/Halo = 1:1.5 in the right daughter granule.) (Scale bars: 5 μm.)
Fig. 2.
Fig. 2.
Interactions between TDP-43 granules facilitate transfer of material between granules. (A) Photobleaching experiments demonstrate transference of fluorescence intensity from nonbleached TDP-43 RNP granules to a bleached granule. A single axonal TDP-43 granule was photobleached (blue arrowhead) at time (t) = 0 s in a cortical neuron transfected with EGFP–TDP-43. Two distinct nonbleached TDP-43 granules interact with the bleached granule at t = 5 s (pink arrowhead) and at t = 10 s (green arrowhead) (also Movie S2). (Scale bar: 2 μm.). (B) Normalized intensities of the bleached TDP-43 granule (blue line), nonbleached interacting granule 1 (pink), and nonbleached interacting granule 2 (green) are plotted as a function of time. With each interaction, the bleached granule gains intensity (ΔI), and there is a corresponding loss of intensity from each of the “donating” nonbleached granules. The solid lines represent spline fits of the data.
Fig. 3.
Fig. 3.
TDP-43 RNP granules show liquid-like behaviors. (A) TDP-43 granules (purple bars) deform with increasing instantaneous velocity, as assessed by AR (maximum diameter/minimum diameter). TDP-43 granules moving at speeds above the median instantaneous velocity show statistically significant deformation compared with stationary TDP-43 granules (***P < 0.001, ANOVA with Tukey posttest). In contrast, LAMP1 vesicles (blue bars) do not significantly change shape regardless of instantaneous velocity. n.s., not significant. AR was measured from nine representative TDP-43 granules from five neurons over four independent near-TIRF live-imaging experiments, including at stationary time points (n = 12) and at below (n = 84) and above (n = 90) the median instantaneous velocity. LAMP1 AR measurements were obtained from nine representative vesicles from eight neurons over three independent experiments, including stationary vesicles (n = 34) and vesicles transported below (n = 87) and above (n = 87) the median velocity. (B) Deformed TDP-43 granules undergo characteristic relaxation to a circular shape upon slowing of transport (defined as t = 0 s), with fast (τ1relax = 0.19 s) and slower (τ2relax = 3.4 s) relaxation phases. Plotted data represent mean ± SEM (n = 5 deformation events; Table S1). (C and D) Near-TIRF microscopy was used to observe fusion events between TDP-43 granules and to capture the relaxation of two TDP-43 granules into a single circular granule (also Movie S3). (Scale bar: 0.5 μm.) Shape AR was plotted as a function of time, where t = 0 ms was the point of contact between the two fusing TDP-43 granules (n = 6 fusion events from four neurons); negative values for time refer to time points before contact between fusing TDP-43 granules (τrelax = 2.7 s; Table S1).
Fig. S5.
Fig. S5.
Comparison of mitochondria, LAMP1, and TDP-43 deformation with increasing instantaneous velocity (related to Fig. 3 ). (A) Mitochondria do not show significant shape changes with transport, regardless of instantaneous velocity. Data are represented in box plots, with whiskers extending from fifth to 95th percentile. n.s., not significant. (B) Shape AR is plotted as a function of instantaneous velocity. With increasing instantaneous velocity, shear stress increases and TDP-43 granules tend to undergo more dramatic deformation than LAMP1 vesicles. LAMP1-positive endosomes are transported at similar instantaneous velocities as TDP-43 granules. Median instantaneous velocity: LAMP1 = 2.8 μm⋅s−1 and TDP-43 = 3.1 μm⋅s−1 (Mann–Whitney two-tailed t test, P = 0.09).
Fig. S6.
Fig. S6.
Photobleaching experiments of TDP-43, mitochondria, and LAMP1-positive endosomes in axons of primary cortical neurons (related to Fig. 4). TDP-43 granules in the axon display robust fluorescent recovery after photobleaching (A), whereas mitochondria (B) and LAMP1 endosomes (C) show very little recovery over a similar time course. Red boxes represent the bleached region in AC. (Scale bars: 1 μm.) In B, brightness was linearly enhanced to show that the bleached mitochondria are still present. (D) Percentage of fluorescence recovery at 30 s postbleach for TDP-43 WT (n = 13 granules from five independent experiments) and LAMP1 vesicles (n = 4 vesicles from three independent experiments) (**P = 0.0015, Mann–Whitney test).
Fig. 4.
Fig. 4.
FRAP identifies distinct populations of axonal TDP43 granules. TDP-43 granules in the mid axon display rapid recovery after whole-bleach (A) and half-bleach (B) experiments, suggesting that both reorganization within TDP-43 granules and dynamic exchange between granules and the soluble pool of TDP-43 occur. (C) Proximal axon TDP-43 granules show incomplete recovery after half-bleach. In AC, rectangular boxes highlight the bleached area. (Scale bars: 0.5 μm and 5 s.) (D) Fluorescence recovery curves for proximal TDP-43 granules (n = 10) and for mid axon whole-bleach (n = 16) and half-bleach (n = 4) experiments. The normalized intensity values for each condition represent mean ± SEM. Solid lines represent best-fit exponential curves for each condition. Data were obtained from at least four independent experiments. (E, Left) Half-bleach of a representative mid axonal TDP-43 granule demonstrates rapid internal mobility and recovery of fluorescence intensity; however, the size of the granule limits the ability to visualize this redistribution of fluorescence within the granule. (E, Right) Therefore, a larger half-bleached TDP-43 granule is also shown, which demonstrates loss of fluorescence intensity in the unbleached region as the bleached region recovers. In the heat maps, red denotes high intensity and blue represents background intensity. (Scale bars: 0.5 μm.) There is loss of fluorescence intensity in the unbleached area shown in E (F), whereas the bleached area recovers intensity (G). Solid lines represent best-fit curves.
Fig. 5.
Fig. 5.
Superresolution STED microscopy reveals proximal TDP-43 granules are less round, possess more irregular contours, and are distributed at a higher density compared with mid axonal granules. (A) Immunofluorescence for endogenous TDP-43 shows a higher density of TDP-43 granules in the proximal axon compared with the mid axon. (Scale bars: 2.2 μm.) (B) EGFP–TDP-43 in the proximal axon shows a higher density than in the mid axon. (Scale bars: 3 μm.) Images are maximum projections of deconvolved STED Z-stacks. (C) Size distribution of endogenous TDP-43 granules [proximal granule area: 0.024 ± 0.003 μm2, mid axon granule area: 0.025 ± 0.003 μm2 (mean ± SEM); n = 3,085 proximal granules and n = 776 mid axonal granules; Mann–Whitney test]. (D) Size distribution of EGFP–TDP-43 granules [proximal granule area: 0.036 ± 0.006 μm2, mid axon granule area: 0.033 ± 0.007 μm2 (mean ± SEM); n = 589 proximal granules and n = 232 mid axonal granules; Mann–Whitney test.] (E) EGFP–TDP-43 granule density was calculated for each axon segment imaged (n = 18 proximal axon, n = 13 mid axon). TDP-43 granule density in the proximal axon is significantly greater than in the mid axon (Student’s t test, P < 0.001). (F) Proximal axon TDP-43 granules often display irregular contours and sharp projections, whereas mid axonal granules are usually round, with smooth borders. (Scale bar: 250 nm.) Images are segmented masks of TDP-43 granules. Mid axonal TDP-43 granules are significantly more circular (perfect circle, circularity = 1) (G) and have a significantly higher convexity ratio than proximal TDP-43 granules (H). Convexity is defined as the ratio of the object perimeter of the convex hull to the perimeter of the object (i.e., a convexity of a perfectly circular object is 1). Wilcoxon rank sum tests with a Bonferroni correction for multiple comparisons (P ≤ 0.001) were performed to assess for significant differences in morphological features between proximal (n = 589) and mid (n = 232) axonal granules from 18 proximal axon and 13 mid axon images, respectively.
Fig. S7.
Fig. S7.
(AC) Immunofluorescence for endogenous TDP-43 shows localization of TDP-43 puncta to the soma, dendrites, and axon in DIV7–10 primary cortical neurons. (D) NND analysis of EGFP–TDP-43 WT in the proximal and mid axon (related to Fig. 5). (A) STED superresolution microscopy reveals punctate endogenous TDP-43 expression in the soma and proximal dendrites. Note that this maximum projection of a deconvolved STED Z-stack highlights cytoplasmic TDP-43; the nucleus is not visualized well in this image. (Scale bar: 5 μm.) (B) Endogenous TDP-43 is highly expressed in the axon terminal/growth cone. (Scale bar: 5 μm.) (C) Immunofluorescence for endogenous TDP-43 shows a higher density of TDP-43 granules in the proximal axon compared with the mid axon. (Scale bars: 2.25 μm.) In AC, images are maximum projections of deconvolved STED Z-stacks. (D) NND calculations were performed to determine the distance from each EGFP–TDP-43 granule to its five nearest neighbors. Then, for each axon, all NNDs were averaged (avg.) to obtain the mean NND per axon, where n = 13 mid axon images and n = 18 proximal axon images (P < 0.001, Student’s t test).
Fig. S8.
Fig. S8.
Biophysical differences in proximal and mid axonal TDP-43 granules may reflect different maturational states (related to Fig. 5). (A) TDP-43 WT was tagged with mEos3.2, a green-to-red photoconvertible fluorophore (41, 42), and expressed in cortical neurons DIV7–10. Neurons expressing mEos3.2–TDP-43 at low levels, with mEos3.2 green-positive granules confined to the proximal axon were pulsed with a 405-nm laser to activate red signal at t = 0 min. The photoactivated granule pool (green and red signal present) was imaged at 5-min intervals. The time series shows that very few red granules (photoconverted pool, proximal axon) escape into the more distal axon (red arrowhead points to an example), suggesting that most of the photoconverted granules mature in place in the proximal axon. In contrast, at t = 5 and t = 10 min after photoconversion, several green granules that lack red signal are observed in the axon, distal to the photoconverted region (green arrowheads). (Scale bars: 5 μm.) (B) Photoconversion of mEos3.2–TDP-43 (red signal shown) in the proximal axon at t = 0 min results in a modest distal shift of the midpoint of the photoconverted pool at t = 5 min, t = 10 min, and t = 15 min. (Scale bar: 10 μm.) (C) Photoactivation of PAGFP-Synapsin (43) (control) in the proximal axon (t = 0 min) results in a robust anterograde shift of the midpoint. (Scale bar: 10 μm.) A midpoint calculation in the photoactivated region was performed at each time point as described. (D) Mean midpoint shift over time (58) for mEos3.2–TDP-43 (n = 10 neurons from four independent experiments) and PAGFP-Synapsin (n = 5 neurons from four independent experiments). Error bars represent SEM. (E) Fluorescence recovery curve for half-bleached proximal TDP-43 granules (n = 9) at 15 h posttransfection. The fluorescence recovery curve for half-bleached proximal TDP-43 granules at 22–24 h posttransfection (from Fig. 4D) is superimposed for comparison. Note that time after transfection is being used as a surrogate for the average “age” of exogenously expressed TDP-43. The normalized intensity values represent mean ± SEM. The solid line represents the best-fit exponential curve. Data were obtained from three independent experiments.
Fig. 6.
Fig. 6.
Disruption of weak hydrophobic interactions dissolves TDP-43 granules in the mid axon but not in the proximal axon. Cortical neurons expressing EGFP–TDP-43 were treated with 5 μg/mL digitonin alone (control) or 5 μg/mL digitonin with 4% 1,6-hexanediol and then imaged at 5-min intervals. (A and C) Application of digitonin does not affect proximal or mid axonal TDP-43 granules. (B and D) Digitonin with 1,6-hexanediol dissolves TDP-43 granules in the mid axon but does not affect TDP-43 granule integrity in the proximal axon, as shown with representative images and intensity plot profiles (Left) and quantification of fluorescence (fluor.) intensity along the axon (Right) (n = 15 neurons per condition). (D) There is a significant reduction in fluorescence intensity in the mid axon with the addition of 1,6-hexanediol (Student’s t test, P = 0.0025). (Scale bars: 5 μm.) AU, arbitrary units; avg., averaged.
Fig. 7.
Fig. 7.
ALS-linked mutant TDP-43 RNP transport granules show subprocessive motility and increased granule viscosity. (A) Representative TDP-43 WT, M337V, and G298S kymographs with motile, processive tracks traced. (Scale bars: 5 μm, 60 s.) (B) Time series of a TDP-43 G298S granule (blue arrowhead) that encounters a stationary granule (magenta arrowhead) and stops moving. (Scale bar: 2 μm.) (C) Significantly higher fraction of TDP-43 M337V and G298S motile, processive tracks show halting behavior compared with TDP-43 WT [Kruskal–Wallis test with Dunn’s correction: TDP-43 WT (n = 20 neurons) and M337V (n = 15 neurons) from six independent experiments, G298S (n = 9 neurons) from three independent experiments]. (D) Mean squared displacement (MSD) analysis of the top 95th percentile of motile TDP-43 WT [diffusion coefficient (D) = 3.38 μm2⋅s−1, 95% confidence interval (CI): 3.2–3.6], M337V (D = 0.955 μm2⋅s−1, 95% CI: 0.93–0.98), and G298S (D = 1.52 μm2⋅s−1, 95% CI: 1.4–1.6) granules. Thicker lines represent mean MSD, and shaded areas represent SEM. Goodness of fit: TDP-43 WT, R2 = 0.94; M337V, R2 = 0.98; G298S, R2 = 0.92; WT: n = 8 neurons; M337V: n = 7 neurons; G298S: n = 8 neurons; three independent experiments each. (E) Fluorescence recovery after half-bleach of mid axonal TDP-43 WT granules (n = 7), M337V (n = 6), and G298S (n = 6) from three or more independent experiments. Normalized intensity values represent mean ± SEM, and solid lines represent best-fit exponentials. (F) Mid axonal TDP-43 WT RNP granules are significantly less viscous (median = 0.099 Pa⋅s−1) than either TDP-43 M337V granules (median = 2.2 Pa⋅s−1; **P = 0.006, Kruskal–Wallis test with Dunn’s correction) or G298S granules (median = 2.0 Pa⋅s−1; *P = 0.014, Kruskal–Wallis test with Dunn’s correction). TDP-43 WT (n = 7), M337V (n = 6), and G298S (n = 6) from three or more independent experiments. TDP-43 WT (G), G298S (H), and M337V (I) TDP-43 granule number in the mid axon after 1,6-hexanediol treatment, compared with control conditions. Digitonin alone: WT (n = 15 neurons), G298S (n = 7 neurons), M337V (n = 10 neurons) from four independent experiments. Digitonin with hexanediol: WT (n = 17 neurons), G298S (n = 7 neurons), M337V (n = 10 neurons) from four independent experiments. ANOVA with a Tukey posttest was used for end-point analysis statistics (**P < 0.0001). Error bars represent SEM.
Fig. S9.
Fig. S9.
RNP granules containing G298S and M337V TDP-43 are resistant to 1,6-hexanediol. Cortical neurons expressing EGFP–TDP-43 G298S (A) or EGFP–TDP-43 M337V (B) were treated with 5 μg/mL digitonin alone (control) or 5 μg/mL digitonin with 4% 1,6-hexanediol and then imaged at 5-min intervals. Application of 1,6-hexanediol to a mutant TDP-43 granule does not disrupt granule integrity in the proximal or mid axon, as shown with representative images. (Scale bars: 5 μm.) (C) Quantification of fluorescence intensity along the proximal axon before digitonin ± 1,6-hexanediol is added (t0) and after 15 min of digitonin ± 1,6-hexanediol treatment (t15) reveals no significant changes in fluorescence intensity (n = 7–15 neurons per condition from four independent experiments).
Fig. 8.
Fig. 8.
Summary schematic: Mid axonal TDP-43 granules comprise a dynamic population of RNP granules that are distinct from proximal TDP-43 granules. Mid axonal TDP-43 RNP granules show rapid exchange with the soluble pool of TDP-43, display rapid internal rearrangement, and readily dissolve when weak hydrophobic interactions are disrupted, consistent with liquid-like behavior. In contrast, proximal TDP-43 granules show incomplete FRAP and are less sensitive to disruption of weak hydrophobic interactions, suggesting that these granules have a complex structure composed of more viscous and/or stabilized regions with limited molecular mobility. In addition, TDP-43 RNP granules are more densely arranged in the proximal axon and are less motile than mid axonal TDP-43 granules. These distinct populations of TDP-43 WT granules in the axon may reflect different maturational states, and possibly different functional roles. Mutant TDP-43 RNP granules in the mid axon also show liquid droplet formation but display slower recovery after photobleaching, indicating these liquid droplets are more viscous than TDP-43 WT granules. Increased viscosity observed in TDP-43 mutant granules may confer toxic gain of function, possibly enhancing the propensity for aggregation.

Similar articles

Cited by

References

    1. Brangwynne CP, et al. Germline P granules are liquid droplets that localize by controlled dissolution/condensation. Science. 2009;324(5935):1729–1732. - PubMed
    1. Brangwynne CP, Mitchison TJ, Hyman AA. Active liquid-like behavior of nucleoli determines their size and shape in Xenopus laevis oocytes. Proc Natl Acad Sci USA. 2011;108(11):4334–4339. - PMC - PubMed
    1. Kroschwald S, et al. Promiscuous interactions and protein disaggregases determine the material state of stress-inducible RNP granules. eLife. 2015;4:e06807. - PMC - PubMed
    1. Zhu L, Brangwynne CP. Nuclear bodies: The emerging biophysics of nucleoplasmic phases. Curr Opin Cell Biol. 2015;34:23–30. - PMC - PubMed
    1. Hyman AA, Weber CA, Jülicher F. Liquid-liquid phase separation in biology. Annu Rev Cell Dev Biol. 2014;30:39–58. - PubMed

Publication types

MeSH terms