. 2017 Mar 21;114(12):E2293-E2302.
doi: 10.1073/pnas.1612906114. Epub 2017 Mar 6.

Multisensor-integrated organs-on-chips platform for automated and continual in situ monitoring of organoid behaviors

Affiliations

Multisensor-integrated organs-on-chips platform for automated and continual in situ monitoring of organoid behaviors

Yu Shrike Zhang et al. Proc Natl Acad Sci U S A. .

Abstract

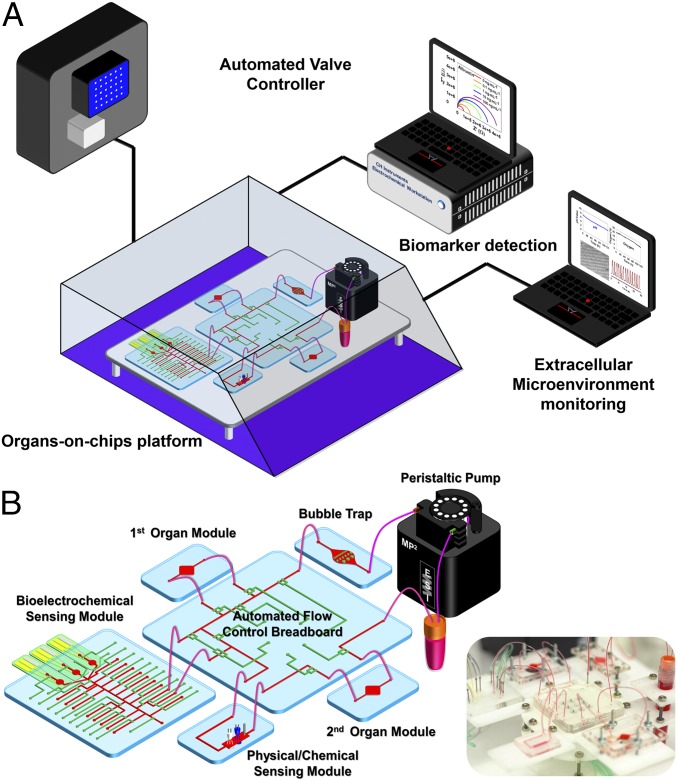
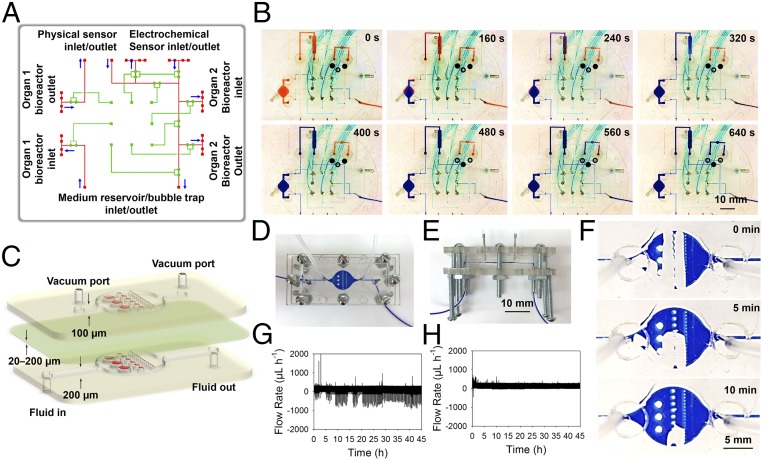
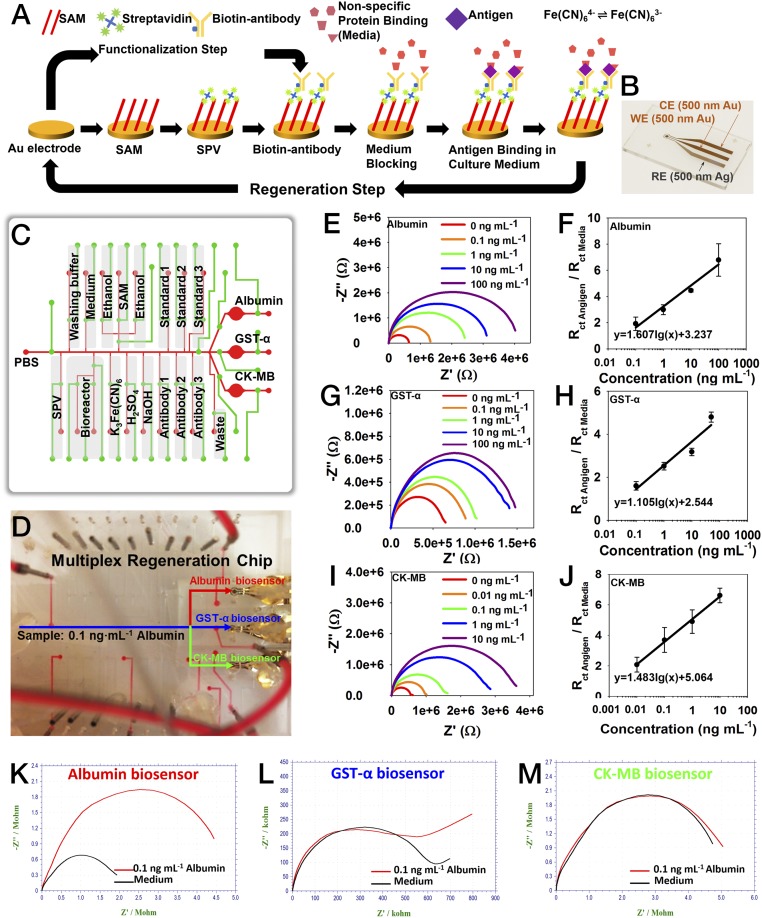
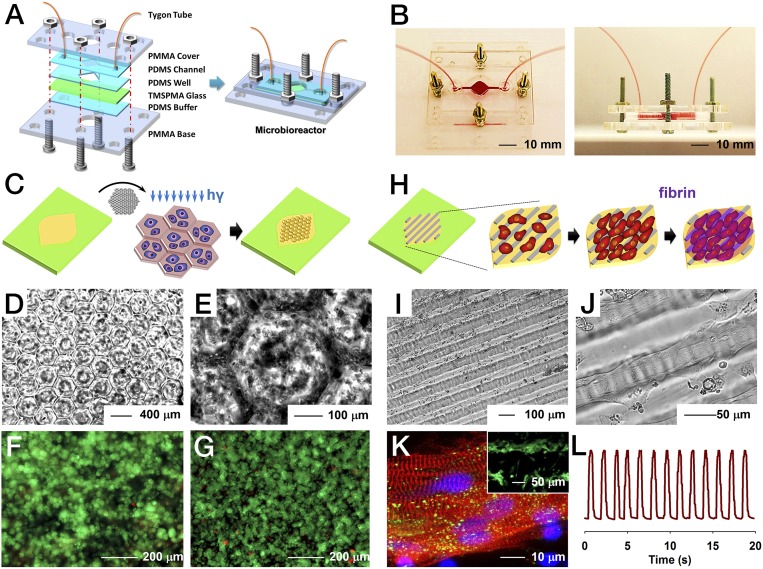
Organ-on-a-chip systems are miniaturized microfluidic 3D human tissue and organ models designed to recapitulate the important biological and physiological parameters of their in vivo counterparts. They have recently emerged as a viable platform for personalized medicine and drug screening. These in vitro models, featuring biomimetic compositions, architectures, and functions, are expected to replace the conventional planar, static cell cultures and bridge the gap between the currently used preclinical animal models and the human body. Multiple organoid models may be further connected together through the microfluidics in a similar manner in which they are arranged in vivo, providing the capability to analyze multiorgan interactions. Although a wide variety of human organ-on-a-chip models have been created, there are limited efforts on the integration of multisensor systems. However, in situ continual measuring is critical in precise assessment of the microenvironment parameters and the dynamic responses of the organs to pharmaceutical compounds over extended periods of time. In addition, automated and noninvasive capability is strongly desired for long-term monitoring. Here, we report a fully integrated modular physical, biochemical, and optical sensing platform through a fluidics-routing breadboard, which operates organ-on-a-chip units in a continual, dynamic, and automated manner. We believe that this platform technology has paved a potential avenue to promote the performance of current organ-on-a-chip models in drug screening by integrating a multitude of real-time sensors to achieve automated in situ monitoring of biophysical and biochemical parameters.

Keywords: drug screening; electrochemical biosensor; microbioreactor; organ-on-a-chip; physical sensor.


Conflict of interest statement

The authors declare no conflict of interest.

Figures

Fig. 1.
Fig. 1.
Integrated automated multiorgan-on-a-chip and sensing platform. (A) Schematic of a full system where the multiorgan-on-a-chip platform was encased in an in-house designed benchtop incubator, and of automated pneumatic valve controller, electronics for operating physical sensors, potentiostat for measuring electrochemical signals, and computer for central programmed integration of all of the commands. (B) Schematic of the integrated microfluidic device consisting of modular components including microbioreactors, breadboard, reservoir, bubble trap, physical sensors, and electrochemical biosensors. Inset shows the photograph of an integrated platform.
Fig. 2.
Fig. 2.
Microfluidic-based fluid routing and operations. (A) Schematic diagram showing design of the breadboard module consisting of a microfluidic layer (red) and a pneumatic valve controlling layer (green) for microfluidic routing of different modules. (B) Photographs showing the constant routing (e.g., the microbioreactor and mimic physical sensing unit) and timed routing (e.g., the mimic electrochemical sensing unit) via controlled valve operations. For the constant routing, the two valves of the channels connecting to the mimic electrochemical sensing unit were closed (see signs in the panels), whereas that for the constant routing was open, resulting in the red dye gradually being washed out from the microbioreactor, the mimic physical sensing unit, and the breadboard by the infused blue dye (0–400 s); for the timed routing, the two valves of the mimic electrochemical sensing unit were released, whereas that for the constant routing was closed, and therefore the blue dye was forced to flow into this unit to exchange the red dye (400–640 s). (C) Schematic diagrams showing design of the bubble trap, which is composed of three layers: (i) a fluidic layer at the bottom with a thickness of 200 µm composed of arrays of micropillars with different sizes (1,000, 500, and 250 µm); (ii) a thin PDMS membrane in the middle with a thickness of ∼20–200 µm; and (iii) a vacuum layer at the top with a thickness of 100 µm composed of the same arrangement of micropillars. (D and E) Photographs showing the assembly of the bubble trap. (F) Time-lapse images showing trapping and removal of a large air bubble with a volume of around 10 µL. (G and H) Plots showing flow rate data obtained from a flow rate sensor in the (G) absence and (H) presence of an upstream bubble trap.
Fig. 3.
Fig. 3.
Integration of microfluidic electrochemical and physical sensors. (A) Schematic diagram showing the functionalization and regeneration process of the electrode for measurement of soluble antigens. (B) Photograph showing a fabricated microelectrode set containing an Au WE, an Au CE, and an Ag RE. (C) Schematic showing the design of the multiplexed microfluidic chip for precisely timed injections of the chemicals for electrochemical detection. (D) Photograph of automated multiplexed regeneration microfluidic chip. (E and F) EIS plot of the calibration impedance measurements obtained from 0 to 100 ng⋅mL−1 albumin and the corresponding calibration curve for albumin. (G and H) EIS plot of the calibration impedance measurements obtained from 0 to 100 ng⋅mL−1 GST-α and the corresponding calibration curve for GST-α. (I and J) EIS plot of the calibration impedance measurements obtained from 0 to 100 ng⋅mL−1 CK-MB and the corresponding calibration curve for CK-MB. Three measurements on three individual electrodes were used to plot each data point on each calibration curve. (K) The response of albumin biosensor to albumin (0.1 ng⋅mL−1). (L) The response of albumin biosensor to GST-α (0.1 ng⋅mL−1). (M) The response of albumin biosensor to CK-MB (0.1 ng⋅mL−1).
Fig. 4.
Fig. 4.
Construction of the microbioreactor and hepatic/cardiac organoids. (A) Schematic diagrams showing the fabrication of resealable microfluidic microbioreactor. (B) Photographs showing top view and side view of the microbioreactor. (C) Schematics indicating the construction of the hepatic organoid via direct photopatterning of hepatocytes encapsulated inside GelMA. (D and E) Optical micrographs showing the lobule-like patterns generated for the hepatic organoid in the microbioreactor. (F and G) Live/dead analysis showing the viability of the patterned human primary hepatocytes at day 1 and day 5 of culture, respectively. (H) Schematics indicating the construction of the cardiac organoid, where iPSC-CMs were first seeded on top of aligned GelMA patterns followed by coverage by a layer of fibrin to protect the cells from shear stress. (I and J) Optical micrographs showing the generated cardiac organoid featuring highly aligned human iPSC-CMs. (K) Sarcomeric α-actinin (red), connexin-43 (green), and nuclei (blue) staining of the iPSC-CMs at day 3 of culture indicating the alignment of the cells and well-developed contractile phenotype and intercellular junctions. The Inset is live/dead analysis showing high viability of the iPSC-CMs. (L) Beating analysis of the cardiac organoid inside the microbioreactor.
Fig. 5.
Fig. 5.
Automated in-line sensing of APAP-induced organoid toxicity from normal human heart-liver-on-chips. (A) Schematic diagram of biomimetic human heart-liver-on-chips. (B–D) Continual measurements of temperature, pH, and O2 concentration within the integrated heart-liver-on-chips. (E–I) Integrated primary hepatic and iPSC-cardiac dual-organoid platform: (E) live/dead staining of the hepatic organoids post treatment with 0, 5, and 10 mM APAP, at the end of 120 h. The drugs were introduced into the system at 72 h. (F) Normalized cell viability in the presence of APAP from day 1 to day 5. (G–I) In-line automated electrochemical measurements of albumin and GST-α secreted from the hepatic organoids as well as CK-MB from the cardiac organoids. (J) Beating analysis of the cardiac organoids. Red arrows indicate the time of drug addition (72 h).
Fig. 6.
Fig. 6.
Automated in-line sensing of DOX-induced organoid toxicity from heart-liver-cancer-on-chips. (A) Schematic diagram of biomimetic human heart-liver-cancer-on-chips. (B) Live/dead staining of the liver cancer organoids post treatment with 0, 5, and 25 µM DOX, at the end of 24 h. The drugs were introduced into the system from time 0. (C) Normalized cell viability in the presence of DOX from 6 to 24 h. (D and E) In-line automated electrochemical measurements of albumin and GST-α secreted from the liver cancer organoids. (F) Live/dead staining of the cardiac organoids at the end of 24 h. (G) In-line automated electrochemical measurements of CK-MB from the cardiac organoids. (H) Beating analysis of the cardiac organoids.

References

    1. Paul SM, et al. How to improve R&D productivity: The pharmaceutical industry’s grand challenge. Nat Rev Drug Discov. 2010;9(3):203–214. - PubMed
    1. US Food and Drug Administration 2015 Drug-Induced Liver Toxicity. Available at www.fda.gov/Drugs/ScienceResearch/ResearchAreas/ucm071471.htm. Accessed March 30, 2016.
    1. Hay M, Thomas DW, Craighead JL, Economides C, Rosenthal J. Clinical development success rates for investigational drugs. Nat Biotechnol. 2014;32(1):40–51. - PubMed
    1. Arrowsmith J, Miller P. Trial watch: Phase II and phase III attrition rates 2011–2012. Nat Rev Drug Discov. 2013;12(8):569. - PubMed
    1. Ferri N, et al. Drug attrition during pre-clinical and clinical development: Understanding and managing drug-induced cardiotoxicity. Pharmacol Ther. 2013;138(3):470–484. - PubMed

Publication types