. 2017 Mar 14;114(11):2952-2957.
doi: 10.1073/pnas.1615601114. Epub 2017 Mar 6.

BET N-terminal bromodomain inhibition selectively blocks Th17 cell differentiation and ameliorates colitis in mice

Affiliations

BET N-terminal bromodomain inhibition selectively blocks Th17 cell differentiation and ameliorates colitis in mice

Kalung Cheung et al. Proc Natl Acad Sci U S A. .

Abstract

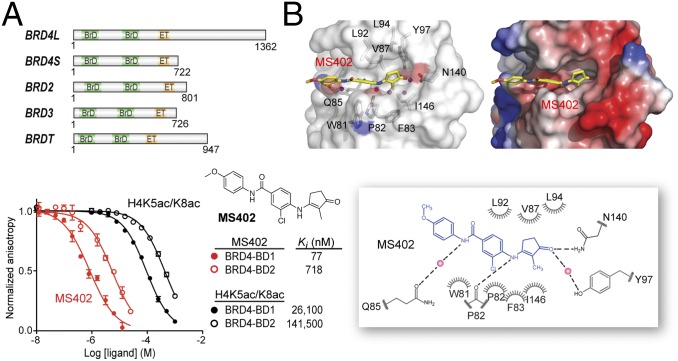
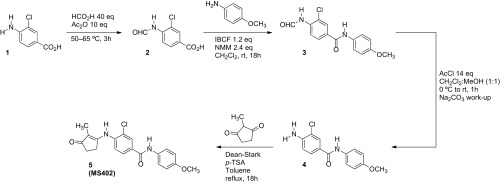
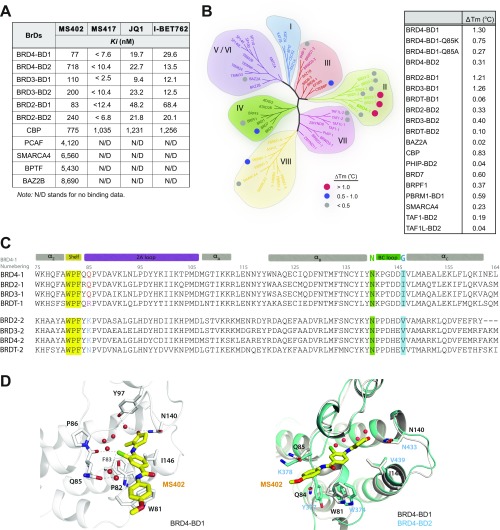
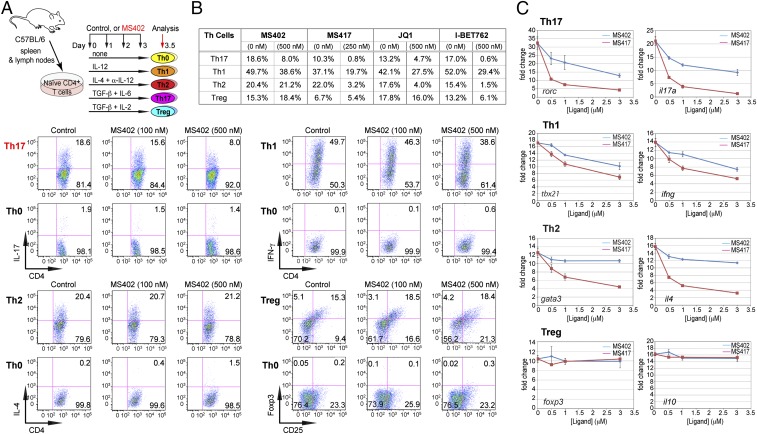
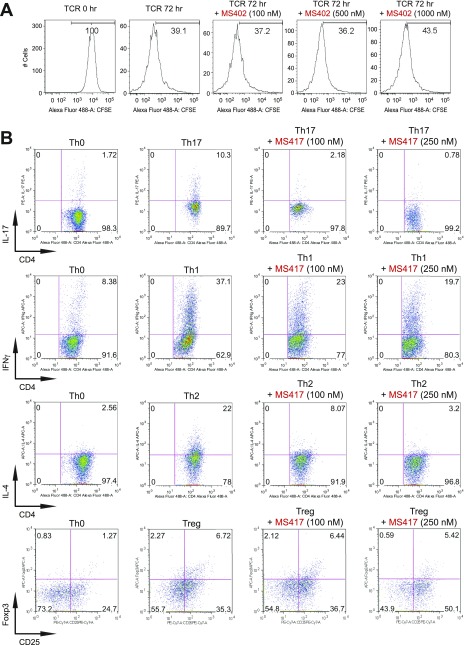
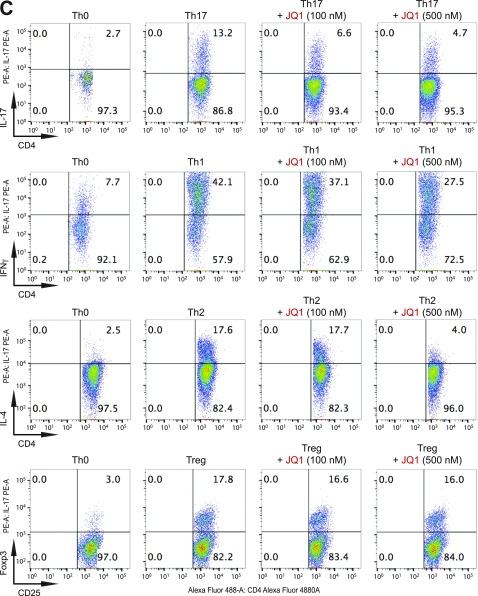
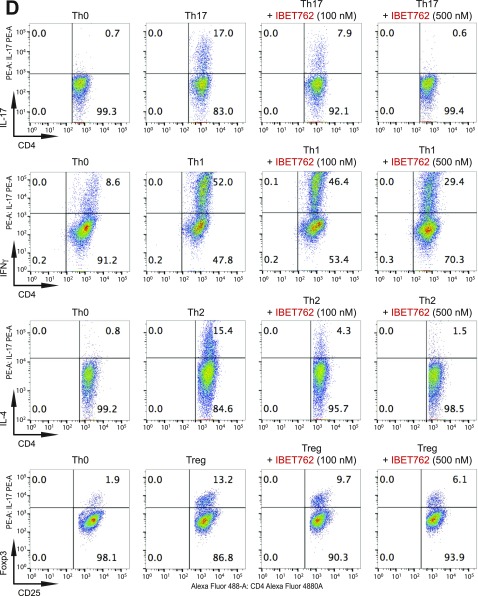
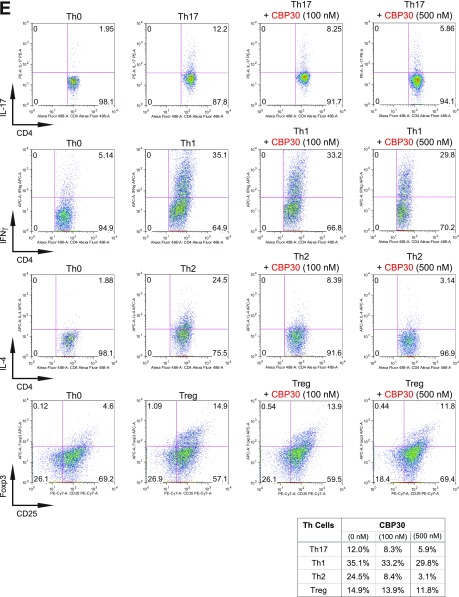
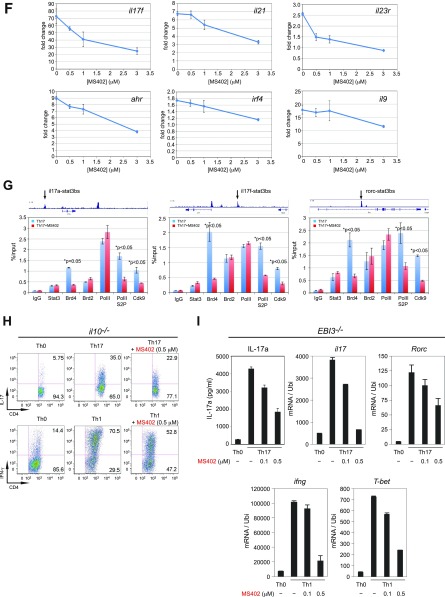
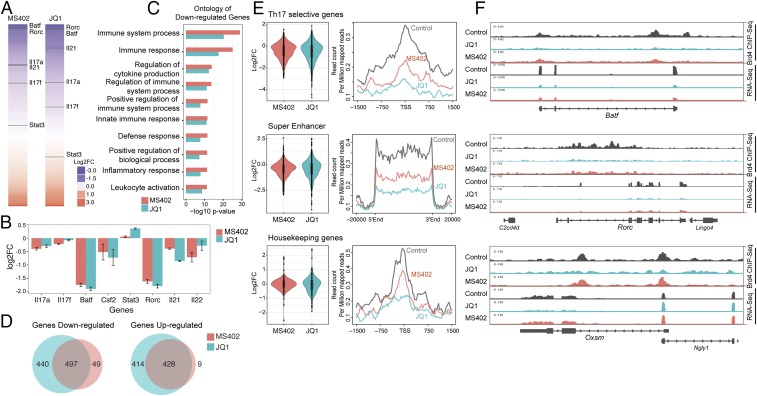
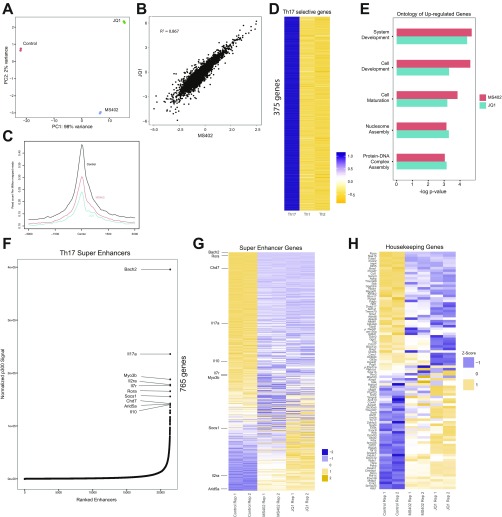
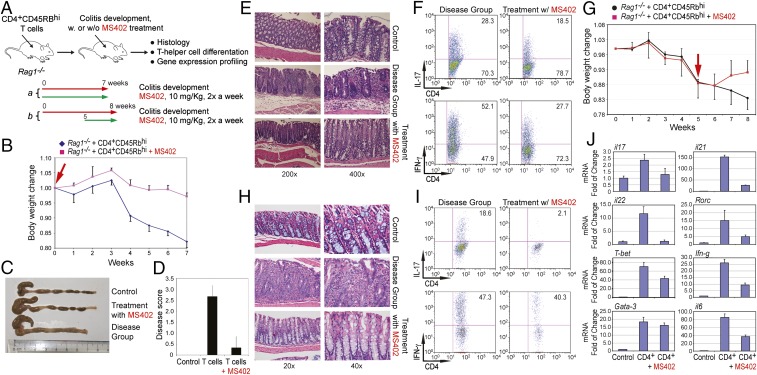
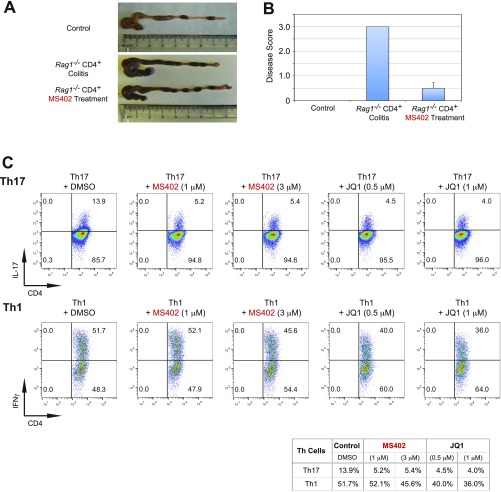
T-helper 17 (Th17) cells have important functions in adaptor immunity and have also been implicated in inflammatory disorders. The bromodomain and extraterminal domain (BET) family proteins regulate gene transcription during lineage-specific differentiation of naïve CD4+ T cells to produce mature T-helper cells. Inhibition of acetyl-lysine binding of the BET proteins by pan-BET bromodomain (BrD) inhibitors, such as JQ1, broadly affects differentiation of Th17, Th1, and Th2 cells that have distinct immune functions, thus limiting their therapeutic potential. Whether these BET proteins represent viable new epigenetic drug targets for inflammatory disorders has remained an unanswered question. In this study, we report that selective inhibition of the first bromodomain of BET proteins with our newly designed small molecule MS402 inhibits primarily Th17 cell differentiation with a little or almost no effect on Th1 or Th2 and Treg cells. MS402 preferentially renders Brd4 binding to Th17 signature gene loci over those of housekeeping genes and reduces Brd4 recruitment of p-TEFb to phosphorylate and activate RNA polymerase II for transcription elongation. We further show that MS402 prevents and ameliorates T-cell transfer-induced colitis in mice by blocking Th17 cell overdevelopment. Thus, selective pharmacological modulation of individual bromodomains likely represents a strategy for treatment of inflammatory bowel diseases.

Keywords: Brd4; Th17 cell differentiation; bromodomain; chemical inhibitor; gene transcription.


Conflict of interest statement

The authors declare no conflict of interest.

Figures

Fig. 1.
Fig. 1.
Structure-guided development of MS402, a BD1-selective BET BrD inhibitor. (A) (Upper) Domain organization of mammalian BET family proteins. (Lower) Binding affinity of MS402 or an H4K5ac/K8ac peptide (residues 1–13) to the BrDs of BRD4 as measured in a fluorescence anisotropy binding assay using an FITC-labeled BrD inhibitor as a probe. (B) (Left) The crystal structure of MS402 (yellow) bound to the BRD4-BD1. (Right) Electrostatic potential surface representation of the BRD4-BD1/MS402 complex. Side chains of key residues at the ligand-binding site in the protein are shown, and bound water molecules are depicted as red spheres. (Lower) Schematic diagram highlights key interactions in MS402 recognition by the BRD4-BD1. Two key water molecules are shown in magenta spheres, and hydrogen bonds are drawn as dashed lines. The figure was generated using LIGPLOT (43).
Scheme S1.
Scheme S1.
Synthetic scheme of MS402.
Fig. S1.
Fig. S1.
MS402, a BD1-selective BET bromodomain inhibitor. (A) Binding affinity of MS402 to BrDs that represent different subgroups of the human BrD family, as determined in a fluorescence anisotropy assay. See experimental details in SI Materials and Methods. (B) Characterization of MS402 binding to representative human BrDs, as assessed by measuring protein thermal stability with and without the presence of the chemical ligand. The results are depicted in the phylogenetic tree of the human BrD family with dots that are color-coded for high affinity (red), modest affinity (blue), or low or no binding (gray). PCAF is also known as histone acetyltransferase KAT2B. (C) Sequence alignment of BET-BD1 and BD2 using the UniProt database and the PROMALS3D server. The conserved Asn and the gatekeeper residue in αC are highlighted with green and blue background, respectively. The WPF shelf residues are highlighted in yellow and the key residue Gln85 is colored in red for BRD4-BD1 and its counterpart Lys in BRD4-BD2 is in blue. (D) (Left) A detailed view of the polar interactions engaged by MS402 with binding site residues of BRD4-BD1. Hydrogen bonds are shown by dashed lines. (Right) Superimposition of MS402 bound to BRD4-BD1 (5E87, colored in white) with BRD4-BD2 (2YEM, colored in cyan).
Fig. 2.
Fig. 2.
MS402, a bromodomain inhibitor, renders Th17 cell differentiation. (A) (Upper) A schematic illustration of the T-helper-cell differentiation study. (Lower) Flow cytometry analysis of mouse primary naïve CD4+ T cells purified from spleens and lymph nodes of C57BL/6 mice and differentiated under Th0, Th1, Th2, Th17, and Treg polarization conditions with and without the presence of MS402 added daily at 100 nM or 500 nM. (B) Table summarizing the effects of MS402 or pan-BET BrD inhibitors including MS417, JQ1, and I-BET762 on T-helper-cell differentiation. (C) Effects of MS402 or MS417 treatment on mRNA expression levels of key Th17, Th1, Th2, or Treg subset-specific signature genes (transcription factors and cytokines) after 3-d lineage-specific cell differentiation from mouse primary naïve CD4+ T cells in a dose-dependent manner.
Fig. S2.
Fig. S2.
BET proteins control gene transcriptional programs in cell differentiation of T-helper cells. (A) Naive CD4+ T cells isolated from spleen and lymph nodes and stimulated to proliferate with plant-bound anti-CD3 plus anti-CD28 for 72 h under different concentrations of MS402. (B) Flow cytometry analysis of mouse primary naïve CD4+ T cells purified from spleens and lymph nodes of C57BL/6 mice and differentiated under Th0, Th1, and Th17 polarization conditions after 3 d with and without MS417 added daily at 100 nM or 250 nM. (C) Flow cytometry analysis of mouse primary naïve CD4+ T cells purified from spleens and lymph nodes of C57BL/6 mice and differentiated under Th0, Th1, and Th17 polarization conditions after 3 d with and without JQ1 added daily at 100 nM or 500 nM. (D) Flow cytometry analysis of mouse primary naïve CD4+ T cells purified from spleens and lymph nodes of C57BL/6 mice and differentiated under Th0, Th1, and Th17 polarization conditions after 3 d with and without IBET762 added daily at 100 nM or 500 nM. (E) Flow cytometry analysis of mouse primary naïve CD4+ T cells purified from spleens and lymph nodes of C57BL/6 mice and differentiated under Th0, Th1 and Th17 polarization conditions after 3 d with and without a selective CBP BrD inhibitor, SGC-CBP30 added daily at 100 nM or 500 nM. (F) Effects of MS402 treatment on mRNA expression levels of additional Th17-specifying transcription factors and cytokines after 3-d Th17-specific cell differentiation from mouse primary naïve CD4+ T cells in a dose-dependent manner. (G) ChIP-seq tracks of Stat3 on il17a-f and rorc gene loci in Th17 cells (Upper) and ChIP-qPCR analysis of Stat3, Brd4, Brd2, PolII, PolIIS2P, and Cdk9 in Th17 cells treated with and without MS402 (3 μM) (Lower). Statistically significant (*P < 0.05) results are annotated. All results are representative of more than two independent experiments. (H) (Upper) Naïve CD4+ T cells of il10−/− mice were differentiated under Th0 and Th17 polarizing conditions. Th17 cells were treated with or without MS402 (500 nM). After in vitro culturing for 3 d the cells were restimulated with PMA/ionomycine for 6 h, stained for intracellular IL-17 for flow cytometry analysis. (Lower) A similar experiment was performed under Th1 polarizing conditions to assess MS402’s effect on IFN-γ–producing CD4+ cells. (I) Naive CD4+ T cells isolated from EBI3−/− mice were differentiated under Th1 or Th17 polarizing conditions. Th17 cells were treated with or without MS402 added daily at concentration of 100 or 500 nM. After in vitro culturing for 3 d the cells were restimulated with PMA/ionomycine for 6 h, and real-time PCR was performed for detection of mRNA expression of Th17 and Th1 cytokines and transcription factors. In addition, supernatants were harvested and IL-17 production was analyzed by ELISA.
Fig. S2.
Fig. S2.
BET proteins control gene transcriptional programs in cell differentiation of T-helper cells. (A) Naive CD4+ T cells isolated from spleen and lymph nodes and stimulated to proliferate with plant-bound anti-CD3 plus anti-CD28 for 72 h under different concentrations of MS402. (B) Flow cytometry analysis of mouse primary naïve CD4+ T cells purified from spleens and lymph nodes of C57BL/6 mice and differentiated under Th0, Th1, and Th17 polarization conditions after 3 d with and without MS417 added daily at 100 nM or 250 nM. (C) Flow cytometry analysis of mouse primary naïve CD4+ T cells purified from spleens and lymph nodes of C57BL/6 mice and differentiated under Th0, Th1, and Th17 polarization conditions after 3 d with and without JQ1 added daily at 100 nM or 500 nM. (D) Flow cytometry analysis of mouse primary naïve CD4+ T cells purified from spleens and lymph nodes of C57BL/6 mice and differentiated under Th0, Th1, and Th17 polarization conditions after 3 d with and without IBET762 added daily at 100 nM or 500 nM. (E) Flow cytometry analysis of mouse primary naïve CD4+ T cells purified from spleens and lymph nodes of C57BL/6 mice and differentiated under Th0, Th1 and Th17 polarization conditions after 3 d with and without a selective CBP BrD inhibitor, SGC-CBP30 added daily at 100 nM or 500 nM. (F) Effects of MS402 treatment on mRNA expression levels of additional Th17-specifying transcription factors and cytokines after 3-d Th17-specific cell differentiation from mouse primary naïve CD4+ T cells in a dose-dependent manner. (G) ChIP-seq tracks of Stat3 on il17a-f and rorc gene loci in Th17 cells (Upper) and ChIP-qPCR analysis of Stat3, Brd4, Brd2, PolII, PolIIS2P, and Cdk9 in Th17 cells treated with and without MS402 (3 μM) (Lower). Statistically significant (*P < 0.05) results are annotated. All results are representative of more than two independent experiments. (H) (Upper) Naïve CD4+ T cells of il10−/− mice were differentiated under Th0 and Th17 polarizing conditions. Th17 cells were treated with or without MS402 (500 nM). After in vitro culturing for 3 d the cells were restimulated with PMA/ionomycine for 6 h, stained for intracellular IL-17 for flow cytometry analysis. (Lower) A similar experiment was performed under Th1 polarizing conditions to assess MS402’s effect on IFN-γ–producing CD4+ cells. (I) Naive CD4+ T cells isolated from EBI3−/− mice were differentiated under Th1 or Th17 polarizing conditions. Th17 cells were treated with or without MS402 added daily at concentration of 100 or 500 nM. After in vitro culturing for 3 d the cells were restimulated with PMA/ionomycine for 6 h, and real-time PCR was performed for detection of mRNA expression of Th17 and Th1 cytokines and transcription factors. In addition, supernatants were harvested and IL-17 production was analyzed by ELISA.
Fig. 3.
Fig. 3.
Genomic analysis of BET inhibition effects on gene transcription during Th17 cell differentiation. (A) Effects of MS402 and JQ1 treatment on gene transcription in Th17 cell differentiation. Genes are ranked from most down-regulated to most up-regulated by compound treatment. Select Th17 signature genes whose transcriptional levels are affected by compound treatment are indicated. (B) MS402 and JQ1 show comparable (log2) fold change for select Th17 signature genes. (C) Immune and cytokine ontologies are among top-enriched down-regulated genes by MS402 or JQ1 treatment. (D) Venn diagram analysis of genes down- or up-regulated by MS402 and JQ1 treatment during Th17 differentiation. (E) Violin plots of the RNA-seq data and profiles of the ChIP-seq data showing patterns of perturbation across multiple gene sets of Th17 selective genes, genes with super enhancers, and housekeeping genes in Th17 cells upon treatment of MS402 or JQ1. (F) Select RNA-seq tracks illustrating changes of transcriptional expression of Brd4 target genes Batf and Rorc (Th17 selective genes) and Oxsm (housekeeping) upon the treatment of MS402 or JQ1.
Fig. S3.
Fig. S3.
Genomic analysis of BET inhibition effects on gene transcription in Th17 cell differentiation. (A) Principal component analysis plot showing the reproducibility of each RNA-seq experiment. JQ1 and MS402 samples also cluster together along the PC1 axis. (B) Scatter plot of log-fold change of genes altered by JQ1 and MS402 treatment illustrating a similar pattern of change for all affected genes. (C) TSS profiles of Brd4 occupancy at all genes before and after JQ1 and MS402 treatment showing Brd4 displacement by the compounds. (D) A group of 375 genes is up-regulated twofold in Th17 cells compared with Th1 and Th2 cells. This set is used in Fig. 3B. (E) Genes, up-regulated by MS402 and JQ1 treatment, are enriched for similar ontologies, including developmental genes as well as genes involved in chromatin maintenance. (F) Super enhancers discovered using a ROSE-type algorithm on p300 peaks in Th17 cells. Over 750 genes in proximity to super enhancers were discovered, with the top 10 labeled. (G) Treatment by JQ1 and MS402 demonstrates a similar pattern in down-regulation of the majority of super-enhancer genes, as identified in C. (H) Treatment by JQ1 alters a representative set of 100 housekeeping genes in greater fashion compared with MS402. Both compounds, however, demonstrate similar trends in up-regulation and down-regulation of these housekeeping genes. This set was used for analysis in Fig. 3B.
Fig. 4.
Fig. 4.
MS402 ameliorates adaptive T-cell transfer-induced colitis in mice. (A) Scheme illustrating the experimental colitis study. CD4+CD45RBhi T cells were purified from spleens and lymph nodes of wild-type or iNOS−/− mice and 5 × 10⁵ cells were injected (i.p.) into recipient Rag1−/− mice. Mice were treated with PBS in a control group or MS402 (10 mg/kg) twice a week starting either at week 0 (a), or week 5 (b) for 7 or 3 wk, respectively. Body weight change was monitored weekly, and mice were killed at the end of experiment for histology analysis. (B) Changes in body weight of Rag1−/− mice (n = 5–6 mice per group) after i.p. transfer of wild-type CD4+CD45RBhi T cells were recorded. MS402 treatment started at week 0 for 7 wk. Data are presented as the mean ± SD of the percentage of initial body weight and are representative of two similar experiments. (C) Changes of morphology of intestines of the Rag1−/− mice with and without MS402 treatment as in B. (D) Disease score assessing efficacy of MS402 treatment as in B on ameliorating inflammation of colitis in mice. The inflammation grading was graded on a scale of 0–3: negative (0), no inflammation; mild (1), mild and patchy; moderate (2), most crypts involved by inflammation; or severe (3), crypt abscess, ulceration, erosion, or submucosal involvement. The inflammation cells are most lymphocytes with some neutrophils. (E) Images showing H&E staining of large intestines of the Rag1−/− mice with or without MS402 treatment as in B. (F) Flow cytometry analysis of CD4+IL17+ and CD4+IFNγ+ T cells in large intestine from the Rag1−/− mice treated with or without MS402 treatment as in B. All results are statistically significant (P < 0.05) and are representative of more than two independent experiments. (G) Body weight change over time after CD4+ T cells injected into recipient Rag1−/− mice with and without MS402 treatment, as indicated by a red arrow (i.e., started at week 5 until week 8). (H) Images showing H&E staining of large intestines of the Rag1−/− mice with or without MS402 treatment as in G. (I) Flow cytometry analysis of CD4+IL17+ and CD4+IFNγ+ T cells in large intestine from the Rag1−/− mice treated with or without MS402 starting at week 5 as in G. All results are statistically significant (P < 0.05) and are representative of more than two independent experiments. (J) mRNA levels of Th17 and Th1-specific genes measured in the Rag1−/− mice treated with or without MS402 starting at week 5 as in G.
Fig. S4.
Fig. S4.
MS402 ameliorates adoptive T-cell transfer-induced colitis in mice. (A) Changes of morphology of intestines of the Rag1−/− mice with and without MS402 treatment started at week 5 until week 8, as indicated in Fig. 4A. (B) Disease score assessing efficacy of MS402 treatment as in A on ameliorating inflammation of colitis in mice. The inflammation grading was graded on a scale of 0–3: negative (0), no inflammation; mild (1), mild and patchy; moderate (2), most crypts involved by inflammation; or severe (3), crypt abscess, ulceration, erosion, or submucosal involvement. The inflammation cells are most lymphocytes with some neutrophils. (C) Flow cytometry analysis assessing the effects of MS402 or JQ1 treatment (24 h at the indicated concentrations) on the maintenance of Th17 and Th1 cells after being differentiated from mouse primary naïve CD4+ T cells purified from spleens and lymph nodes of C57BL/6 mice under Th17 and Th1 polarization conditions after 3 d. These results are statistically significant (P < 0.05) and are representative of more than two independent experiments.
Fig. S5.
Fig. S5.
NMR spectra of compound 5, MS402. (A) The 1H and (B) 13C NMR spectra of MS402 in d6-DMSO, collected on a 600-MHz Bruker NMR spectrometer at room temperature.

References

    1. Iwasaki A, Medzhitov R. Control of adaptive immunity by the innate immune system. Nat Immunol. 2015;16(4):343–353. - PMC - PubMed
    1. Tabas I, Glass CK. Anti-inflammatory therapy in chronic disease: Challenges and opportunities. Science. 2013;339(6116):166–172. - PMC - PubMed
    1. Abraham C, Medzhitov R. Interactions between the host innate immune system and microbes in inflammatory bowel disease. Gastroenterology. 2011;140(6):1729–1737. - PMC - PubMed
    1. Rubin DC, Shaker A, Levin MS. Chronic intestinal inflammation: Inflammatory bowel disease and colitis-associated colon cancer. Front Immunol. 2012;3:107. - PMC - PubMed
    1. Saleh M, Trinchieri G. Innate immune mechanisms of colitis and colitis-associated colorectal cancer. Nat Rev Immunol. 2011;11(1):9–20. - PubMed

Publication types

MeSH terms

Associated data