. 2017 Mar 21;114(12):E2440-E2449.
doi: 10.1073/pnas.1615575114. Epub 2017 Mar 6.

Polyphosphate granule biogenesis is temporally and functionally tied to cell cycle exit during starvation in Pseudomonas aeruginosa

Affiliations

Polyphosphate granule biogenesis is temporally and functionally tied to cell cycle exit during starvation in Pseudomonas aeruginosa

Lisa R Racki et al. Proc Natl Acad Sci U S A. .

Abstract

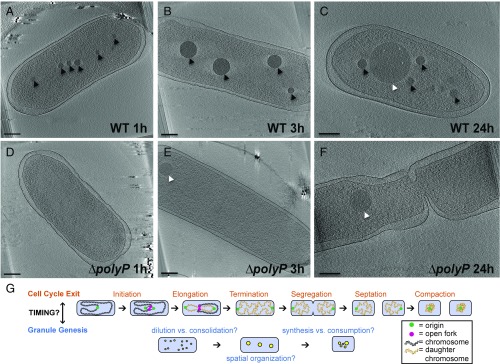
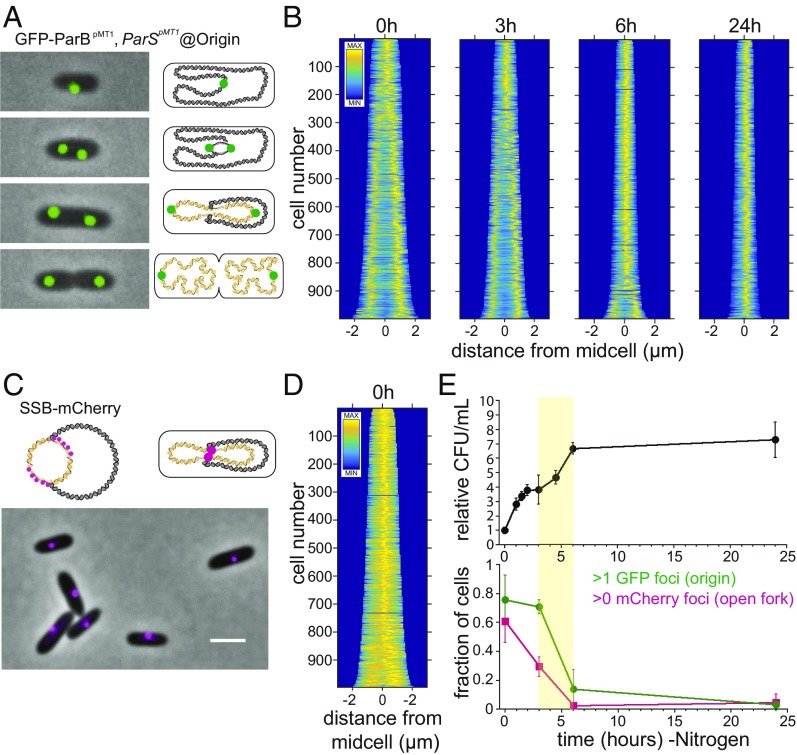
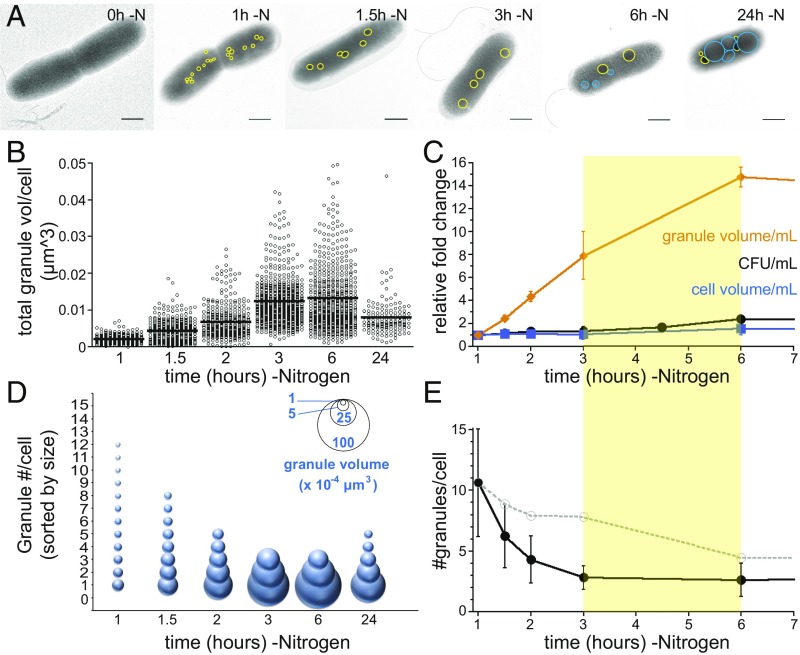
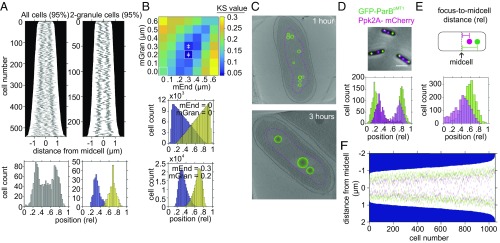
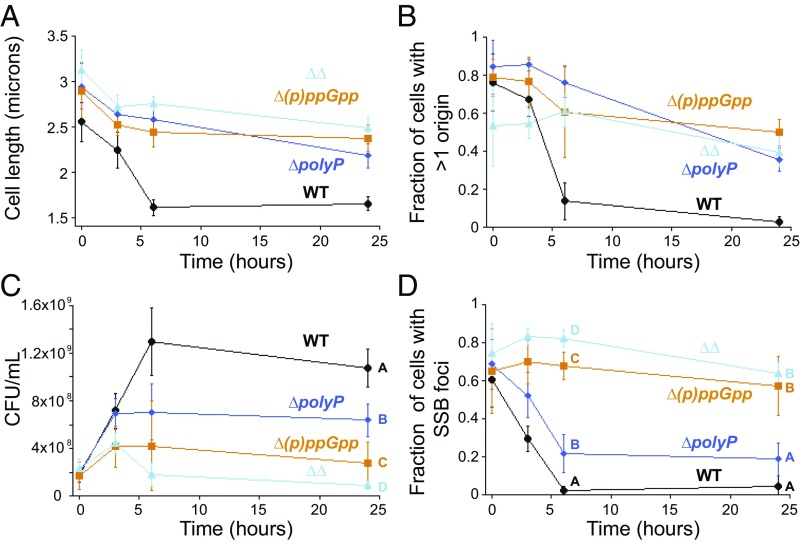
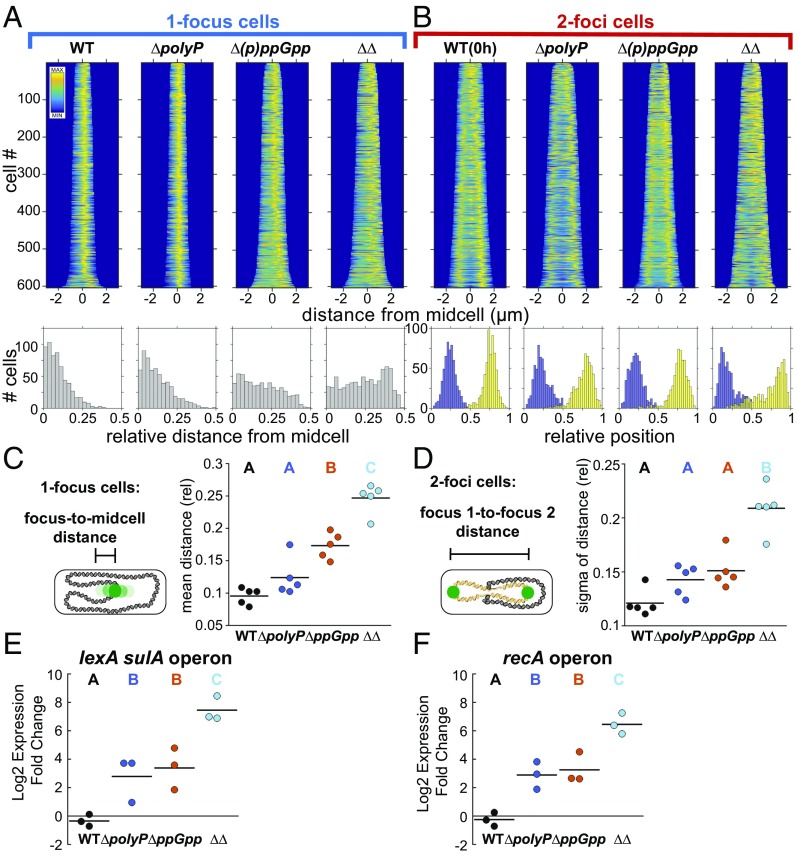
Polyphosphate (polyP) granule biogenesis is an ancient and ubiquitous starvation response in bacteria. Although the ability to make polyP is important for survival during quiescence and resistance to diverse environmental stresses, granule genesis is poorly understood. Using quantitative microscopy at high spatial and temporal resolution, we show that granule genesis in Pseudomonas aeruginosa is tightly organized under nitrogen starvation. Following nucleation as many microgranules throughout the nucleoid, polyP granules consolidate and become transiently spatially organized during cell cycle exit. Between 1 and 3 h after nitrogen starvation, a minority of cells have divided, yet the total granule number per cell decreases, total granule volume per cell dramatically increases, and individual granules grow to occupy diameters as large as ∼200 nm. At their peak, mature granules constitute ∼2% of the total cell volume and are evenly spaced along the long cell axis. Following cell cycle exit, granules initially retain a tight spatial organization, yet their size distribution and spacing relax deeper into starvation. Mutant cells lacking polyP elongate during starvation and contain more than one origin. PolyP promotes cell cycle exit by functioning at a step after DNA replication initiation. Together with the universal starvation alarmone (p)ppGpp, polyP has an additive effect on nucleoid dynamics and organization during starvation. Notably, cell cycle exit is temporally coupled to a net increase in polyP granule biomass, suggesting that net synthesis, rather than consumption of the polymer, is important for the mechanism by which polyP promotes completion of cell cycle exit during starvation.

Keywords: biomineralization; cell cycle; nucleoid; polyphosphate; starvation.


Conflict of interest statement

The authors declare no conflict of interest.

Figures

Fig. 1.
Fig. 1.
PolyP granule formation in Pseudomonas aeruginosa under nitrogen starvation. Each panel is a 20-nm-thick tomographic slice through a 3D reconstruction of an intact cell. (Scale bar, 200 nm.) (A) Cryotomogram of a WT cell 1 h after inducing starvation. The cell shows many microgranules of polyP (black arrowheads). (B) WT cell 3 h after inducing starvation. Microgranules consolidate within the nucleoid region into regularly spaced mature granules. (C) WT cell 24 h after inducing starvation. PolyP granules lose tight spatial organization, and they are of heterogeneous size and number. PHA granules (white arrowheads) are formed late in starvation. (D) ∆polyP cell 1 h after inducing starvation. Quadruple knockout of polyphosphate kinases ∆ppk1∆ppk2a∆ppk2b∆ppk2c. (E) ∆polyP cell 3 h after inducing starvation do not form polyP granules but form PHA granules earlier than WT. (F) ∆polyP cell 24 h after inducing starvation contain PHA granules and are elongated, with some showing evidence of initiation but not completion of septation. (G) (Top) Model of steps in cell cycle exit. Reinitiation of DNA replication is inhibited. Replication elongation rates are modulated for efficiency to prevent stalled forks and fork breakage. Daughter chromosomes are segregated and compacted. Septation proceeds in the absence of stalled forks and once daughter chromosomes are segregated. (Bottom) Model for steps in polyP granule genesis. PolyP granules initiate throughout the nucleoid region. Granule number decreases, whereas size increases, by some combination of dilution of granules due to cell division and/or granule consolidation. Mature granules become transiently spatially organized. Granule number, size distribution, and positioning relax deeper into starvation.
Fig. 2.
Fig. 2.
Timing of cell cycle exit during nitrogen starvation determined by counting cells, chromosomal origins of replication per cell, and open DNA replication forks per cell. (A) (Left) Examples of cells labeled using the GFP-ParBpMT1 chimeric reporter and the parSpMT1 binding site inserted at the attTn7 locus, 19.5 kb from the origin of replication. The GFP-ParBpMT1 chimera is expressed under the control of a second copy of the native P. aeruginosa AraJ-SSB promoter, also inserted at the attT7 locus. (Right) Illustration of model for organization of chromosomal origins (green), chromosome (black), and daughter chromosomes (gold). (B) Demographs of fluorescence intensity of the GFP-ParBpMT1 reporter construct in wild-type cells at 0, 3, 6, and 24 h into nitrogen starvation. (C) (Top) A translational fusion of SSB-mCherry under its native promoter was used to label open DNA replication forks, which colocalize midcell in P. aeruginosa. (Bottom) Example of exponential-phase wild-type cells with the SSB-mCherry translational fusion. (Scale bar, 2 µm.) (D) Demograph of mCherry fluorescence of exponential-phase cells with SSB-mCherry translational fusion construct. (E) (Top) Relative fold change in the number of cells (cfu/mL) after the shift to nitrogen-limited medium. (Bottom) Green circles represent the fraction of cells with >1 GFP focus, indicating the presence of more than one chromosome origin of replication after the shift to nitrogen-limited medium. Magenta squares represent the fraction of cells with >0 mCherry foci, indicating the presence of an open DNA replication fork after the shift to the nitrogen-limited medium. Highlighted yellow region between 3 and 6 h indicates the period during which the majority of cells in the population complete cell cycle exit (the fraction of cells with more than one GFP focus drops from 71 ± 17% to 14 ± 14% from 3 to 6 h, means and SDs of four independent experiments, and the fraction of cells with at least one mCherry focus drops from 29 ± 6.8% to 2.5 ± 2.1% from 3 to 6 h, means and SDs of five independent experiments).
Fig. 3.
Fig. 3.
PolyP granule growth and consolidation during cell cycle exit. (A) Examples of nitrogen-starved cells as a function of time. (Scale bar, 0.5 μM.) PolyP granules are outlined in yellow, and polyhydroxyalkanoate (PHA) granules are outlined in blue. (B) The total volume of granules per cell increases throughout cell cycle exit [0.0021 ± 0.0021 µm3 at 1 h (n = 214 cells), 0.004 ± 0.003 µm3 at 1.5 h (n = 319 cells), 0.0069 ± 0.0048 µm3 at 2 h (n = 316 cells), 0.0124 ± 0.067 µm3 at 3 h (n = 542 cells), and 0.0132 ± 0.0094 µm3 at 6 h (n = 560 cells)] and then decreases to 0.008 ± 0.005 µm3 at 24 h (n = 136 cells). Global analysis of two to four independent experiments is shown. (C) The total volume of granules per mL of culture increases throughout cell cycle exit. The yellow bar between 3 and 6 h highlights the period where the population as a whole completes cell cycle exit. (D) The size distribution of granules that contribute 95% or more of total granular volume. Inserted key shows granule volume represented by bubble size. For each cell, granules were ranked by size, and their volumes were summed, starting from the largest to smallest granule, until 95% of total granule volume was reached; any additional smaller granules are excluded. At each time point, the average number of granules required to reach 95% of total granule volume is shown, with granule size depicted reflecting the average size of granules of that numerical rank. (E) The number of granules per cell that contribute to 95% of total granular volume. Black closed circles represent experimental data: 10.6 ± 4 granules per cell at 1 h, 6.3 ± 3 at 1.5 h, 4.3 ± 2 at 2 h, 2.8 ± 1 at 3 h, 2.6 ± 1 at 6 h, and 4.3 ± 2 at 24 h. Gray open circles and dotted line represent the number of granules predicted by dilution, i.e., the number of granules predicted per cell if there is no net change in the number of granules, but they are partitioned to new cells due to cell division. Cell counts were used to generate the dilution factors: 8.9 at 1.5 h, 7.9 at 2 h, 7.8 at 3 h, 4.5 at 6 h, and 4.1 at 24 h.
Fig. 4.
Fig. 4.
PolyP granules are spatially organized 3 h into nitrogen starvation. (A) (Top Left) Demograph of granules contributing to 95% of total granular volume per cell of all 3 h-starved cells imaged by TEM. (Bottom Left) Histogram of relative position of granules along the long axis of cells imaged by TEM as above. (Top Right) Demograph of 3 h-starved cells with two granules imaged by TEM. (Bottom Right) Histogram of relative position of granules along the long axis of cells imaged by TEM as above. First granule, 0.32 ± 0.06 (blue), and second granule, 0.68 ± 0.08 (yellow). (B) (Top) Heat map of KS test statistic from comparing the experimentally observed distribution of granules in two-granule cells to a simulation of randomly positioning granules along the long axis of the cell, with two added constraints: first, a minimum distance between granules and cell poles (mEnd) and second, a minimum distance between first and second granule (mGran). Symbol ǂ indicates parameter space where the model is statistically indistinguishable from the data. See Methods and SI Appendix, Fig. S6 and SI Methods, for more detailed description. (Middle) Histogram of relative granule position along long axis of cells from a simulation of 229,000 cells in which the only constraint is that granules cannot overlap along long axis of the cell (mEnd = 0, mGran = 0). (Bottom) As in Middle, with the added constraints that granules must be a minimum of 0.3 µm from cell poles and 0.2 µm from each other. (C) (Top) Cryotomogram of WT cell 1 h after inducing starvation. Granules are represented as green spheres, and the nucleoid region is outlined with a magenta dotted line. (Bottom) As in Top, at 3 h. (D) (Top) Example cells with nucleoid origins labeled using the GFP-ParBpMT1 chimera and the parSpMT1 DNA binding site on the chromosome at the attTn7 site (green), and polyP granules labeled with the Ppk2A-mCherry chimera (magenta), replacing the native copy of ppk2A on the chromosome. (Scale bar, 0.5 μM.) (Bottom) Histogram of relative position on long axis of the cell of GFP foci (0.25 ± 0.08 and 0.76 ± 0.09; green) and mCherry foci (0.34 ± 0.13 and 0.71 ± 0.10; magenta). (E) Histogram of relative position of GFP and mCherry foci from midcell, 0.28 ± 0.07 and 0.20 ± 0.09, respectively. P < 0.01 by Student’s t test. (F) Demograph representation of position of nucleoid origins (green) and polyP granules (magenta).
Fig. 5.
Fig. 5.
PolyP and (p)ppGpp promote cell cycle exit during starvation. WT, black circles; ∆polyP, blue diamonds; ∆(p)ppGpp, orange squares; and ∆∆, cyan triangles. (A) Average cell length as a function of time after induction of nitrogen starvation. Mean and SD from at least six independent experiments for each time point. (B) Fraction of cells with >1 GFP-ParBpMT1 focus as a function of time after induction of nitrogen starvation. Mean and SD from at least three independent experiments for each time point. (C) Cell counts (cfu) after the shift to nitrogen-limited medium. Mean and SD from at least three independent experiments, variance analyzed using a one-way ANOVA. Significant differences between strains at the same time point are marked with uppercase letters based on post hoc Tukey test. Strains at the same time point marked with different letters have significantly different means. P < 0.05. (D) Fraction of cells with at least one SSB-mCherry focus as a function of time during nitrogen starvation, mean and SD from five independent experiments, variance analyzed using a one-way ANOVA. Significant differences between strains at a given time point are marked with uppercase letters based on post hoc Tukey test. Strains at the same time point marked with different letters have significantly different means. P < 0.05.
Fig. 6.
Fig. 6.
PolyP and (p)ppGpp have synergistic effects on nucleoid organization and the SOS DNA damage response. Variance analyzed using a one-way ANOVA. Significant differences between strains at the same time point are marked with uppercase letters based on post hoc Tukey test. Strains marked with different letters have significantly different means. P < 0.05. (A) (Top) Fluorescence demographs of cells with one GFP-ParBpMT1 focus, 24 h nitrogen starvation, using GFP-ParBpMT1 chimeric reporter under the SSB promoter and the parSpMT1 DNA binding site at the attT7 locus. (Bottom) Histograms of relative distance from midcell of GFP-ParBpMT1 foci. (B) (Top) As in A but for two-foci cells. (Bottom) Relative position of first GFP-ParBpMT1 focus (blue) and second focus (yellow) on long axis of cell, normalized to 1. (C) Relative distance from midcell of GFP-ParBpMT1 foci in one-focus cells as above. Each point represents the population mean from an independent experiment. P < 0.05 for strains marked with different letters. (D) Broadness of distribution (sigma) of relative distance of GFP-ParBpMT1 foci to each other in a population of two-foci cells. Each point represents an independent experiment. P < 0.001. (E) Relative change in expression 3 h into nitrogen starvation relative to 0 h of lexA sulA operon, mRNA quantification by qPCR. Each point represents an independent experiment. P < 0.05. (F) As in E, for recA operon. P < 0.01.

References

    1. Kreuzer KN. DNA damage responses in prokaryotes: Regulating gene expression, modulating growth patterns, and manipulating replication forks. Cold Spring Harb Perspect Biol. 2013;5(11):a012674. - PMC - PubMed
    1. Saint-Ruf C, Pesut J, Sopta M, Matic I. Causes and consequences of DNA repair activity modulation during stationary phase in Escherichia coli. Crit Rev Biochem Mol Biol. 2007;42(4):259–270. - PubMed
    1. Minsky A, Shimoni E, Frenkiel-Krispin D. Stress, order and survival. Nat Rev Mol Cell Biol. 2002;3(1):50–60. - PubMed
    1. Frenkiel-Krispin D, Minsky A. Nucleoid organization and the maintenance of DNA integrity in E. coli, B. subtilis and D. radiodurans. J Struct Biol. 2006;156(2):311–319. - PubMed
    1. Wang JD, Levin PA. Metabolism, cell growth and the bacterial cell cycle. Nat Rev Microbiol. 2009;7(11):822–827. - PMC - PubMed

Publication types

MeSH terms

LinkOut - more resources