. 2017 Mar 1:5:e3058.
doi: 10.7717/peerj.3058. eCollection 2017.

A supertree pipeline for summarizing phylogenetic and taxonomic information for millions of species

Affiliations

A supertree pipeline for summarizing phylogenetic and taxonomic information for millions of species

Benjamin D Redelings et al. PeerJ. .

Abstract

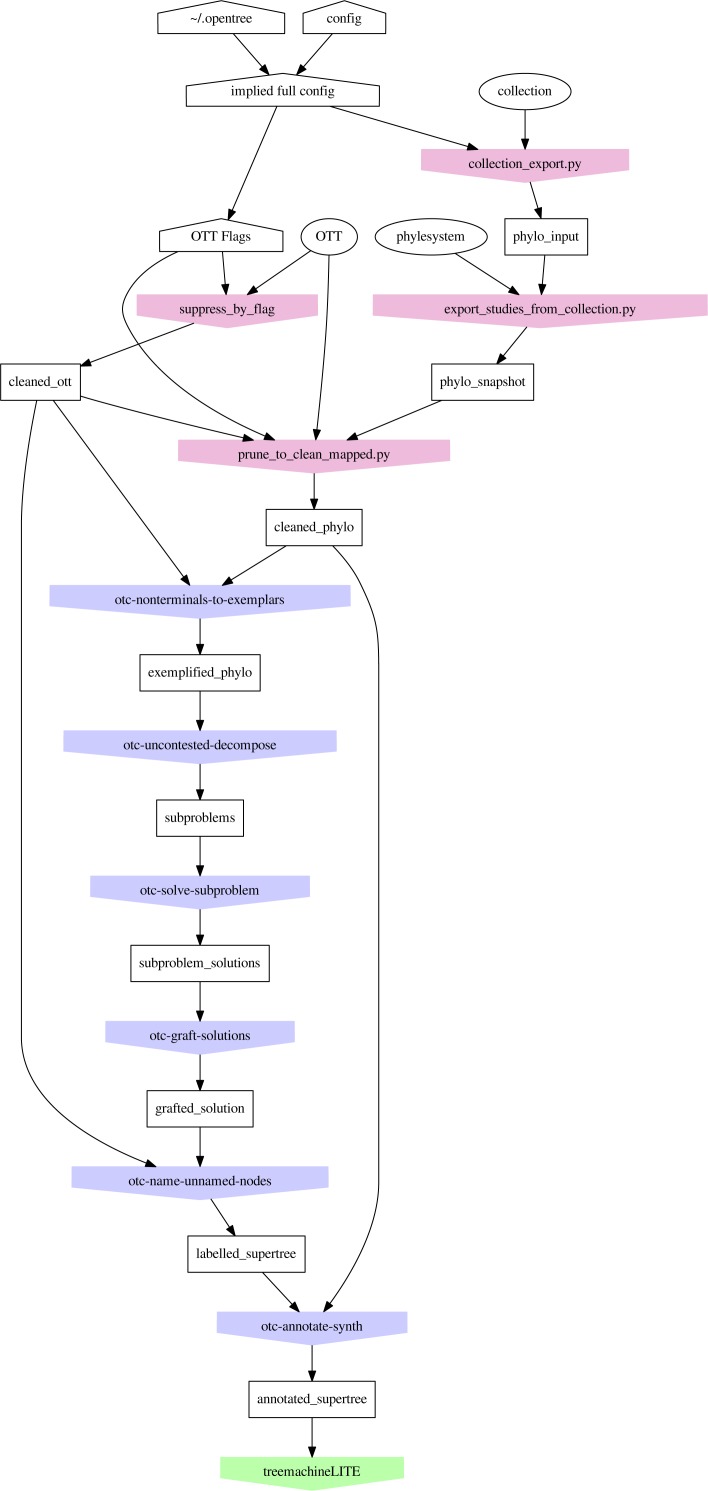
We present a new supertree method that enables rapid estimation of a summary tree on the scale of millions of leaves. This supertree method summarizes a collection of input phylogenies and an input taxonomy. We introduce formal goals and criteria for such a supertree to satisfy in order to transparently and justifiably represent the input trees. In addition to producing a supertree, our method computes annotations that describe which grouping in the input trees support and conflict with each group in the supertree. We compare our supertree construction method to a previously published supertree construction method by assessing their performance on input trees used to construct the Open Tree of Life version 4, and find that our method increases the number of displayed input splits from 35,518 to 39,639 and decreases the number of conflicting input splits from 2,760 to 1,357. The new supertree method also improves on the previous supertree construction method in that it produces no unsupported branches and avoids unnecessary polytomies. This pipeline is currently used by the Open Tree of Life project to produce all of the versions of project's "synthetic tree" starting at version 5. This software pipeline is called "propinquity". It relies heavily on "otcetera"-a set of C++ tools to perform most of the steps of the pipeline. All of the components are free software and are available on GitHub.

Keywords: Phylogenetics; Software; Supertree; Taxonomy; Tree of life.


Conflict of interest statement

The authors declare there are no competing interests.

Figures

Figure 1
Figure 1. An example demonstrating that our definition of “supported by” does not imply entire composition of a grouping.
(A) and (B) show 2 input trees and (C) and (D) depict trees that each display each of the groupings in the input trees and which have no unsupported nodes. The BUILD algorithm (‘Subproblem solution’) would choose tree (D) that floats taxon E closer to the root.
Figure 2
Figure 2. An example of three input trees shown in (A), (B), and (C) which do not conflict in a pairwise manner, but cannot be jointly displayed in one tree. The 3 solution trees are shown in (D–F).
(D) for ranking the tree in (C) lowest. (E) shows the solution if the tree in (B) has the lowest rank. (F) shows the solution if the tree in (A) is ranked lowest. Each of the solutions displays two of the three input groupings.
Figure 3
Figure 3. Organization of the propinquity pipeline.
Each colored pentagon labels a program (blue for otcetera-based tools and red for python scripts in the propinquity or peyotl repository) that performs the important operations in each step; the number before the tool name refers to the section in this paper that describes the operation. The output of each step corresponds to a subdirectory of the propinquity system which will hold the output artifacts for the step. Ovals are resources that are required (OTT and Open Tree’s phylesystem repository). White pentagons are user-controlled inputs.
Figure 4
Figure 4. Input trees (A–B) and taxonomy tree (C).
Figure 5
Figure 5. Exemplified input trees (A–B) and pruned taxonomy tree (C) from Fig. 4.
Taxon E in the first input tree is exemplified by E1 in (A). Pruned taxa are E2, F2, and D. The taxa E and F are retained as monotypic taxa in the pruned taxonomy. The red edge in the pruned taxonomy tree is an uncontested higher taxon in the exemplified taxonomy (as explained in section ‘Subproblem decomposition’ ).
Figure 6
Figure 6. Subproblems (A) ABCD and (B) root generated from the exemplified trees shown in Fig. 5.
A trivial statement from the first tree that a taxon labelled ABCD is sister to E has been omitted, because trees with only two leaves do not contain phylogenetic information.
Figure 7
Figure 7
An example with three input trees: the highest ranked phylogenetic input (A), the second ranked phylogenetic (B), and the taxonomy in (C). The summary tree in (D) has the highest possible score, but the summary shown in (E) would be returned from the pipeline that uses uncontested taxon decomposition.
Figure 8
Figure 8. Algorithm ConsistentSplitsFromRankedList.
Figure 9
Figure 9. Solutions to (A) subproblem ABCD and (B) subproblem root depicted in Fig. 6.
Figure 10
Figure 10. Grafted solution produced from the subproblems from Fig. 9 and which is the backbone onto which taxa that are not included in any phylogeny will be placed.
Figure 11
Figure 11. Unpruned tree with internal taxa.
Taxa unsampled in phylogenetic statements have been added to the grafted tree shown in Fig. 10.
Figure 12
Figure 12. Two approaches to unpruning.
Taxa G and R in the taxonomy (A) are broken because they conflict with the grafted solution (B). Removing these broken taxa from the taxonomy before unpruning leads to taxa R4, R5, and R6 being attached directly at taxon N, as in tree (C). In tree (D), the children of the broken taxon R are instead attached at the MRCA of R1, R2, and R3. Our method follows the second approach.
Figure 13
Figure 13. The relationship of edges in summary tree 𝕊 in (B) to edges in the input tree T1 named “tree1” in (A). Only edges of 𝕊 that are present in the induced tree 𝕊(1) in (C) are represented by JSON annotations in (D).
Taxon names are here suppressed in favor of OTT IDs, and edges are referenced via their tipward nodes. Edges in 𝕊(1) that correspond to terminal edges of T1 are orange; edges of 𝕊(1) that are supported by edges of T1 are blue; where multiple edges of 𝕊(1) correspond to the same edge of T1 they are green. There is no conflict in this example. Also, if this were output from propinquity, then each internal node of 𝕊 would be supported by other inputs trees that are not shown here.

References

    1. Aho AV, Sagiv Y, Szymanski TG, Ullman JD. Inferring a tree from lowest common ancestors with an application to the optimization of relational expressions. SIAM Journal on Computing. 1981;10(3):405–421. doi: 10.1137/0210030. - DOI
    1. Baum BR. Combining trees as a way of combining data sets for phylogenetic inference, and the desirability of combining gene trees. Taxon. 1992;41(1):3–10. doi: 10.2307/1222480. - DOI
    1. Bininda-Emonds ORP, Cardillo M, Jones KE, MacPhee RDE, Beck RMD, Grenyer R, Price SA, Vos RA, Gittleman JL, Purvis A. The delayed rise of present-day mammals. Nature. 2007;446:507–512. doi: 10.1038/nature05634. - DOI - PubMed
    1. Davis KE, Page RDM. Reweaving the tapestry: a supertree of birds. PLOS Currents. 2014 doi: 10.1371/currents.tol.c1af68dda7c999ed9f1e4b2d2df7a08e. Epub ahead of print Jun 9 2014. - DOI - PMC - PubMed
    1. Gatesy J, Springer MS. A critique of matrix representation with parsimony supertrees. In: Bininda-Edmonds ORP, editor. Phylogenetic supertrees: combining information to reveal the tree of life. vol. 3. Dordrecht: Springer; 2004. pp. 369–388. (Computational biology). Dress A, ed.

LinkOut - more resources