Meta-Analysis
. 2017:2017:8282391.
doi: 10.1155/2017/8282391. Epub 2017 Feb 7.

Clinical Outcomes of Specific Immunotherapy in Advanced Pancreatic Cancer: A Systematic Review and Meta-Analysis

Affiliations
Meta-Analysis

Clinical Outcomes of Specific Immunotherapy in Advanced Pancreatic Cancer: A Systematic Review and Meta-Analysis

Jiang Chen et al. J Immunol Res. 2017.

Abstract

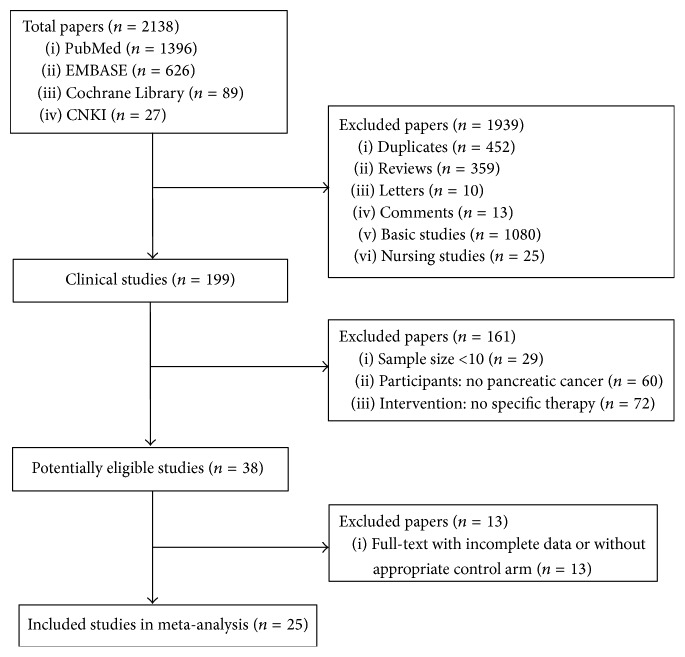
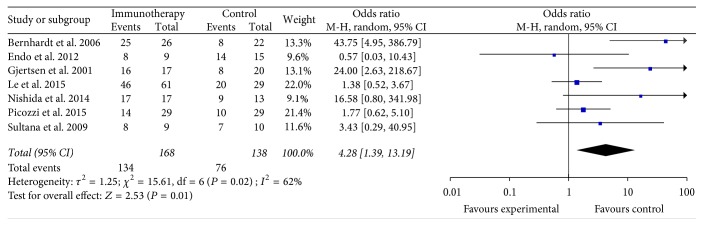
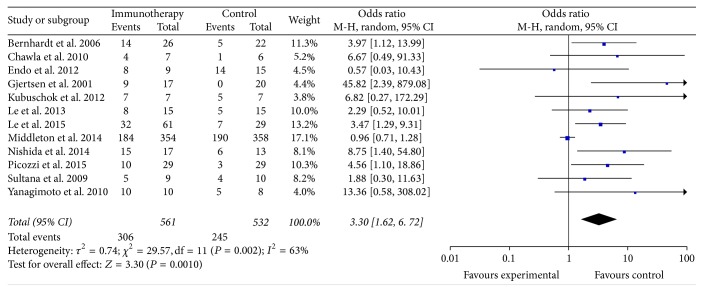
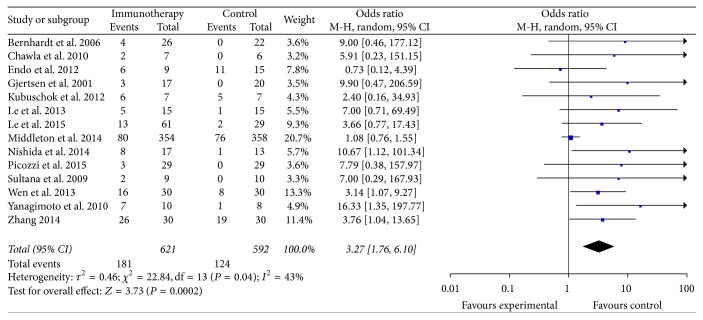
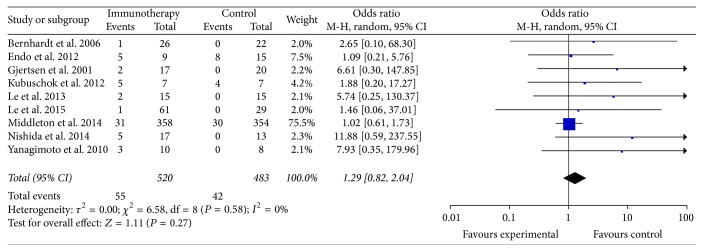
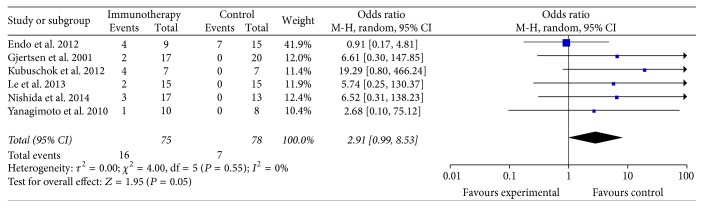
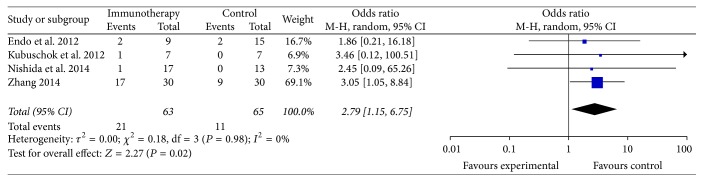
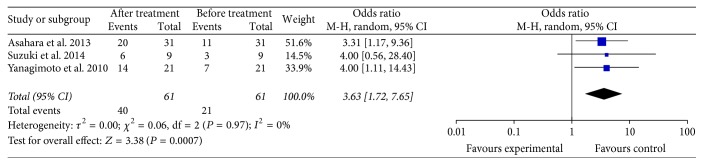
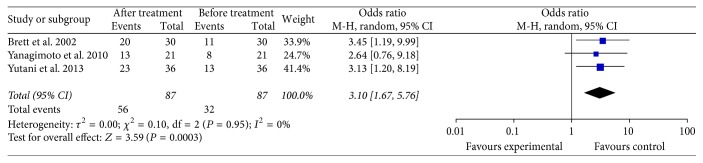
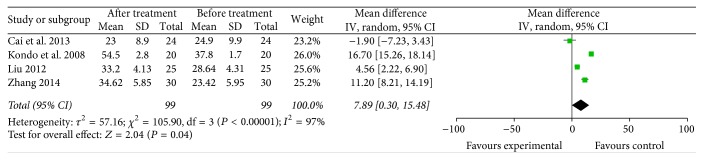
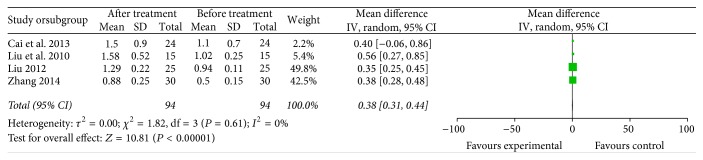
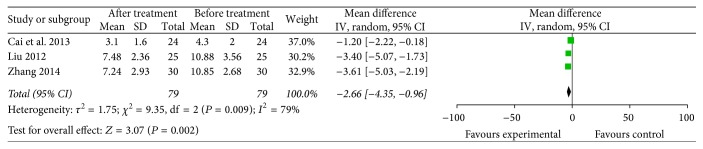
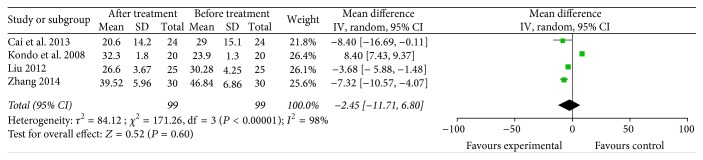
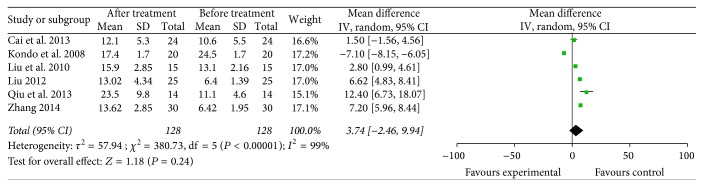
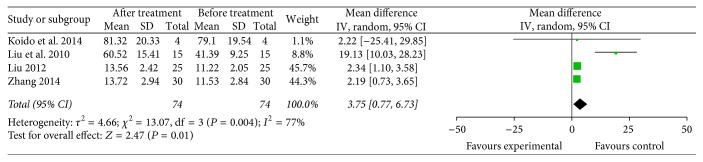
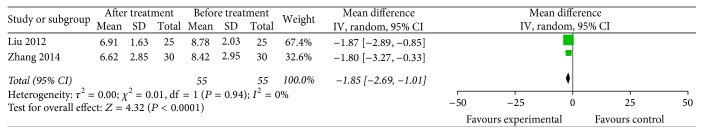
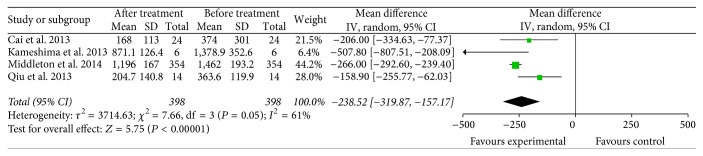
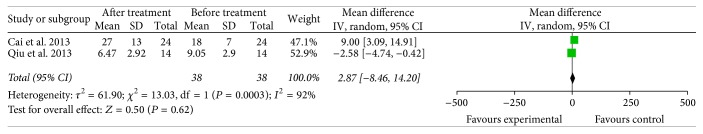
Specific immunotherapies, including vaccines with autologous tumor cells and tumor antigen-specific monoclonal antibodies, are important treatments for PC patients. To evaluate the clinical outcomes of PC-specific immunotherapy, we performed a systematic review and meta-analysis of the relevant published clinical trials. The effects of specific immunotherapy were compared with those of nonspecific immunotherapy and the meta-analysis was executed with results regarding the overall survival (OS), immune responses data, and serum cancer markers data. The pooled analysis was performed by using the random-effects model. We found that significantly improved OS was noted for PC patients utilizing specific immunotherapy and an improved immune response was also observed. In conclusion, specific immunotherapy was superior in prolonging the survival time and enhancing immunological responses in PC patients.


Conflict of interest statement

The authors declare that there are no competing interests regarding the publication of this paper.

Figures

Figure 1
Figure 1
Flowchart of inclusion.
Figure 2
Figure 2
Forest plot of comparison: 3-month overall survival of 7 included studies.
Figure 3
Figure 3
Forest plot of comparison: 6-month overall survival (12 studies).
Figure 4
Figure 4
Forest plot of comparison: 1-year overall survival of 14 included studies.
Figure 5
Figure 5
Forest plot of comparison: 1.5-year overall survival of 9 included studies.
Figure 6
Figure 6
Forest plot of comparison: 2-year overall survival (6 studies).
Figure 7
Figure 7
Forest plot of comparison: 3-year overall survival of 4 included studies.
Figure 8
Figure 8
Forest plot of comparison: CTL-responses between before and after specific immunotherapy treatment groups (3 studies).
Figure 9
Figure 9
Forest plot of comparison: antibody-responses between before and after specific immunotherapy treatment groups (3 studies).
Figure 10
Figure 10
Forest plot of comparison: CD4+ lymphocyte subset percentages between specific immunotherapy group and the baseline observed before treatment group in 4 included studies.
Figure 11
Figure 11
Forest plot of comparison: portion of CD4+/CD8+ between specific immunotherapy group and the baseline observed before treatment group (4 studies).
Figure 12
Figure 12
Forest plot of comparison: CD4+CD25+ lymphocyte subset percentages between specific immunotherapy group and the baseline observed before treatment group (3 studies).
Figure 13
Figure 13
Forest plot of comparison: CD8+ lymphocyte subset percentages between specific immunotherapy group and the baseline observed before treatment group in 4 included studies.
Figure 14
Figure 14
Forest plot of comparison: CD56+ lymphocyte subset percentages between specific immunotherapy group and the baseline observed before treatment group in 6 included studies.
Figure 15
Figure 15
Forest plot of comparison: IFN-γ levels between specific immunotherapy group and the baseline observed before treatment group (4 trials).
Figure 16
Figure 16
Forest plot of comparison: IL4 levels between specific immunotherapy group and the baseline observed before treatment group (2 trials).
Figure 17
Figure 17
Forest plot of comparison: CA19-9 levels between specific immunotherapy group and the baseline observed before treatment group (4 trials).
Figure 18
Figure 18
Forest plot of comparison: CEA levels between specific immunotherapy group and the baseline observed before treatment group (2 trials).

References

    1. Siegel R. L., Miller K. D., Jemal A. Cancer statistics, 2015. CA Cancer Journal for Clinicians. 2015;65(1):5–29. doi: 10.3322/caac.21254. - DOI - PubMed
    1. Bond-Smith G., Banga N., Hammond T. M., Imber C. J. Pancreatic adenocarcinoma. British Medical Journal. 2012;344(7857) doi: 10.1136/bmj.e2476.e2476 - DOI - PubMed
    1. Manuel H. Pancreatic cancer. New England Journal of Medicine. 2010;362(17):1605–1617. doi: 10.1056/nejmra0901557. - DOI - PubMed
    1. Arslan C., Yalcin S. Current and future systemic treatment options in metastatic pancreatic cancer. Journal of Gastrointestinal Oncology. 2014;5(4):280–295. - PMC - PubMed
    1. Darcy P. K., Neeson P., Yong C. S., Kershaw M. H. Manipulating immune cells for adoptive immunotherapy of cancer. Current Opinion in Immunology. 2014;27(1):46–52. doi: 10.1016/j.coi.2014.01.008. - DOI - PubMed