

Identifying ionic interactions within a membrane using BLaTM, a genetic tool to measure homo- and heterotypic transmembrane helix-helix interactions
- PMID: 28266525
- PMCID: PMC5339904
- DOI: 10.1038/srep43476
Identifying ionic interactions within a membrane using BLaTM, a genetic tool to measure homo- and heterotypic transmembrane helix-helix interactions
Erratum in
-
Author Correction: Identifying ionic interactions within a membrane using BLaTM, a genetic tool to measure homo- and heterotypic transmembrane helix-helix interactions.Sci Rep. 2020 Apr 24;10(1):7223. doi: 10.1038/s41598-020-63947-z. Sci Rep. 2020. PMID: 32332822 Free PMC article.
Abstract
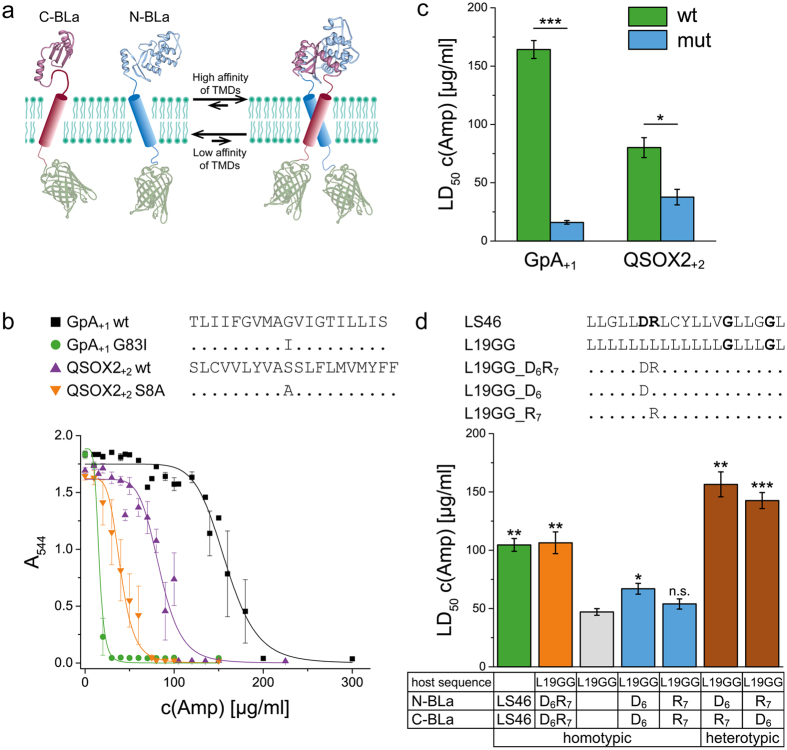
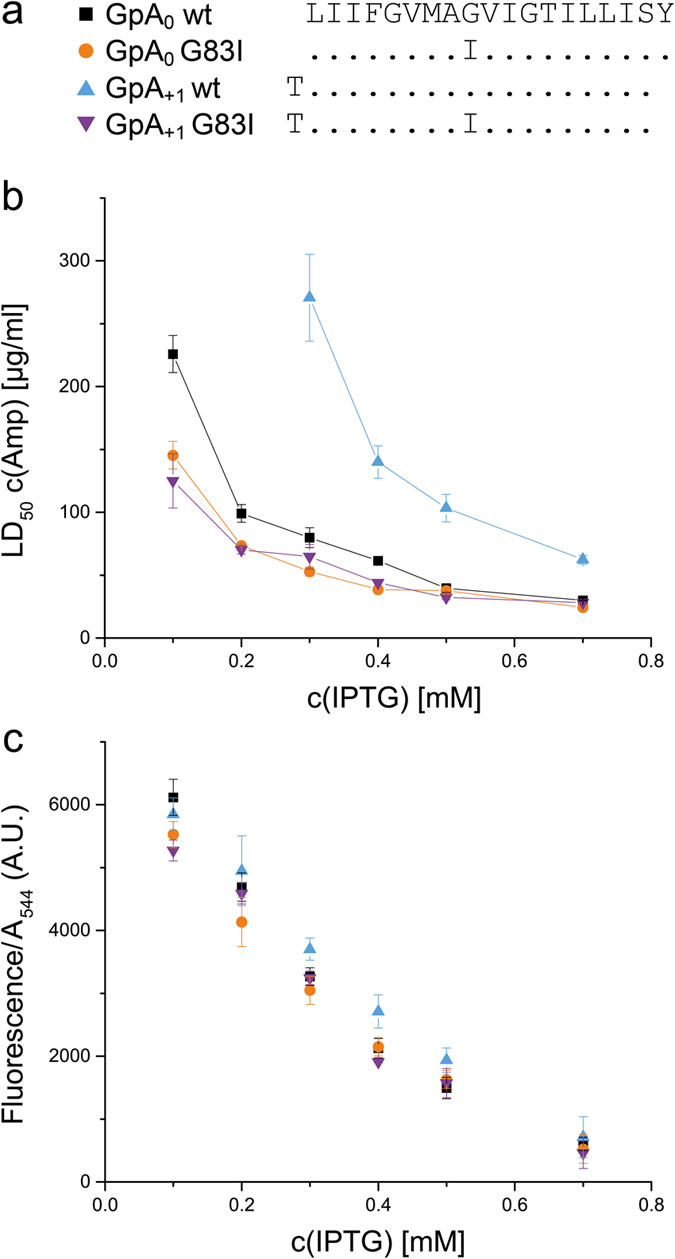
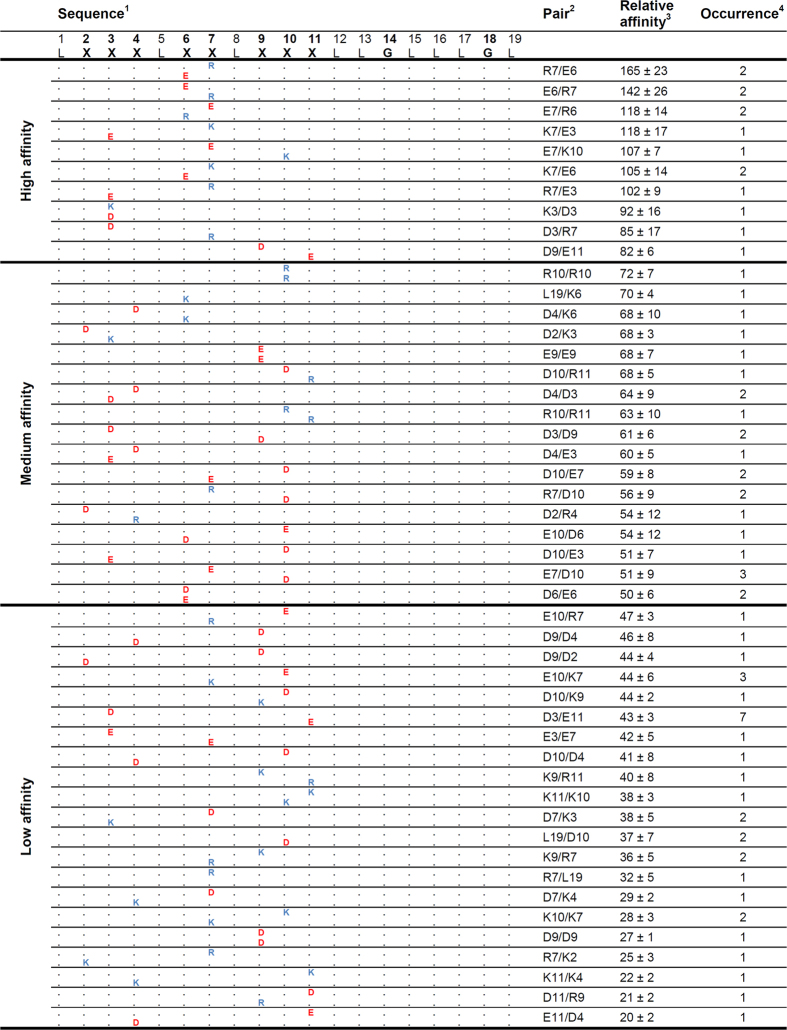
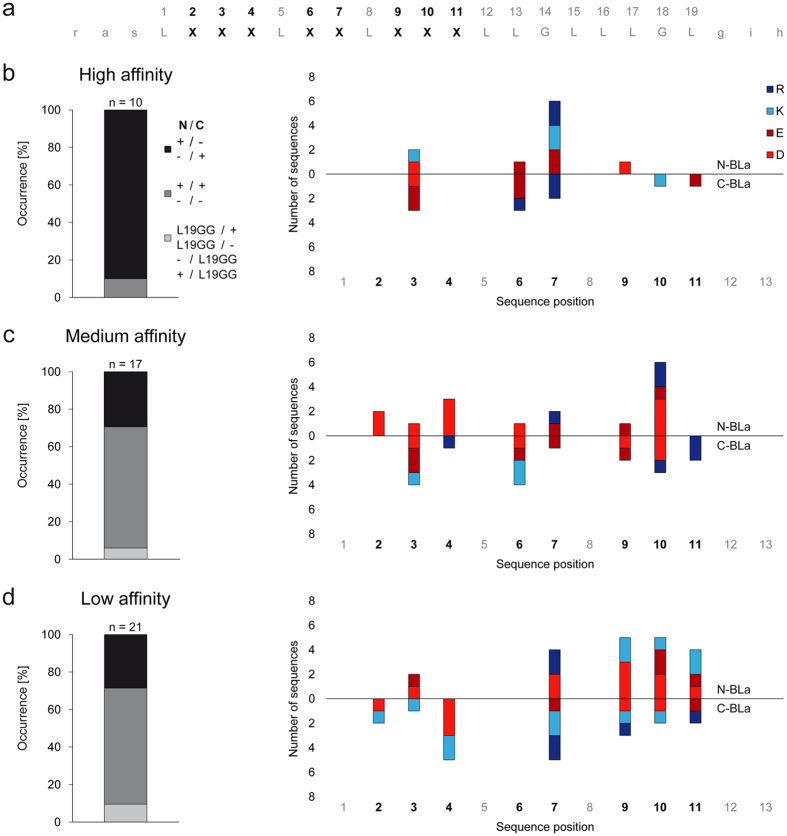
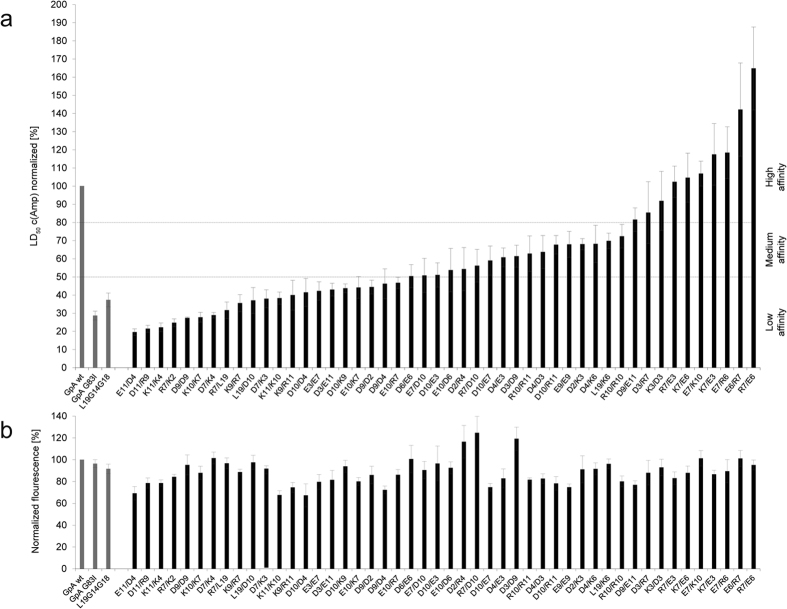
The assembly of integral membrane protein complexes is frequently supported by transmembrane domain (TMD) interactions. Here, we present the BLaTM assay that measures homotypic as well as heterotypic TMD-TMD interactions in a bacterial membrane. The system is based on complementation of β-lactamase fragments genetically fused to interacting TMDs, which confers ampicillin resistance to expressing cells. We validated BLaTM by showing that the assay faithfully reports known sequence-specific interactions of both types. In a practical application, we used BLaTM to screen a focussed combinatorial library for heterotypic interactions driven by electrostatic forces. The results reveal novel patterns of ionizable amino acids within the isolated TMD pairs. Those patterns indicate that formation of heterotypic TMD pairs is most efficiently supported by closely spaced ionizable residues of opposite charge. In addition, TMD heteromerization can apparently be driven by hydrogen bonding between basic or between acidic residues.
Conflict of interest statement
The authors declare no competing financial interests.
Figures
Similar articles
-
KPC-2 β-lactamase enables carbapenem antibiotic resistance through fast deacylation of the covalent intermediate.J Biol Chem. 2021 Jan-Jun;296:100155. doi: 10.1074/jbc.RA120.015050. Epub 2020 Dec 10. J Biol Chem. 2021. PMID: 33273017 Free PMC article.
-
Characterization of BRPMBL, the Bleomycin Resistance Protein Associated with the Carbapenemase NDM.Antimicrob Agents Chemother. 2017 Feb 23;61(3):e02413-16. doi: 10.1128/AAC.02413-16. Print 2017 Mar. Antimicrob Agents Chemother. 2017. PMID: 28069656 Free PMC article.
-
BLaTM 2.0, a Genetic Tool Revealing Preferred Antiparallel Interaction of Transmembrane Helix 4 of the Dual-Topology Protein EmrE.J Mol Biol. 2017 Jun 2;429(11):1630-1637. doi: 10.1016/j.jmb.2017.04.003. Epub 2017 Apr 19. J Mol Biol. 2017. PMID: 28432015
-
Glycophorin A dimerization is driven by specific interactions between transmembrane alpha-helices.J Biol Chem. 1992 Apr 15;267(11):7683-9. J Biol Chem. 1992. PMID: 1560003
-
Extended-spectrum and inhibitor-resistant TEM-type beta-lactamases: mutations, specificity, and three-dimensional structure.Antimicrob Agents Chemother. 1995 Dec;39(12):2593-601. doi: 10.1128/AAC.39.12.2593. Antimicrob Agents Chemother. 1995. PMID: 8592985 Free PMC article. Review. No abstract available.
Cited by
-
Dynamic proton-dependent motors power type IX secretion and gliding motility in Flavobacterium.PLoS Biol. 2022 Mar 25;20(3):e3001443. doi: 10.1371/journal.pbio.3001443. eCollection 2022 Mar. PLoS Biol. 2022. PMID: 35333857 Free PMC article.
-
Interaction of Substrates with γ-Secretase at the Level of Individual Transmembrane Helices-A Methodological Approach.Int J Mol Sci. 2023 Sep 21;24(18):14396. doi: 10.3390/ijms241814396. Int J Mol Sci. 2023. PMID: 37762696 Free PMC article.
-
Combination of Cα-H Hydrogen Bonds and van der Waals Packing Modulates the Stability of GxxxG-Mediated Dimers in Membranes.J Am Chem Soc. 2017 Nov 8;139(44):15774-15783. doi: 10.1021/jacs.7b07505. Epub 2017 Oct 27. J Am Chem Soc. 2017. PMID: 29028318 Free PMC article.
-
Transmating: conjugative transfer of a new broad host range expression vector to various Bacillus species using a single protocol.BMC Microbiol. 2018 Jun 8;18(1):56. doi: 10.1186/s12866-018-1198-4. BMC Microbiol. 2018. PMID: 29884129 Free PMC article.
-
Bacterial One- and Two-Hybrid Assays to Monitor Transmembrane Helix Interactions.Methods Mol Biol. 2024;2715:259-271. doi: 10.1007/978-1-0716-3445-5_17. Methods Mol Biol. 2024. PMID: 37930534
References
-
- Neumann J., Klein N., Otzen D. E. & Schneider D. Folding energetics and oligomerization of polytopic alpha-helical transmembrane proteins. Archives of Biochemistry and Biophysics 564, 281–296 (2014). - PubMed
-
- Cymer F., Veerappan A. & Schneider D. Transmembrane helix-helix interactions are modulated by the sequence context and by lipid bilayer properties. Biochim Biophys Acta 1818, 963–973 (2012). - PubMed
-
- Teese M. G. & Langosch D. Role of GxxxG Motifs in Transmembrane Domain Interactions. Biochemistry 54, 5125–5135 (2015). - PubMed
-
- Fink A., Sal-Man N., Gerber D. & Shai Y. Transmembrane domains interactions within the membrane milieu: Principles, advances and challenges. Biochimica et Biophysica Acta 1818, 974–983 (2012). - PubMed
Publication types
MeSH terms
Substances
LinkOut - more resources
Full Text Sources
Other Literature Sources
Medical
Research Materials
