. 2017 Mar 7:7:43364.
doi: 10.1038/srep43364.

Ethylene-induced transcriptional and hormonal responses at the onset of sugarcane ripening

Affiliations

Ethylene-induced transcriptional and hormonal responses at the onset of sugarcane ripening

Camila P Cunha et al. Sci Rep. .

Abstract

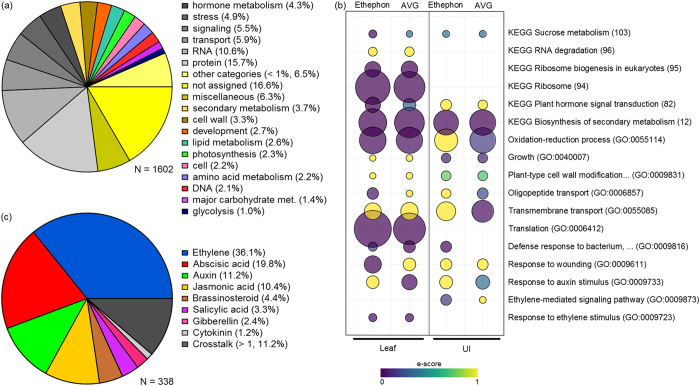
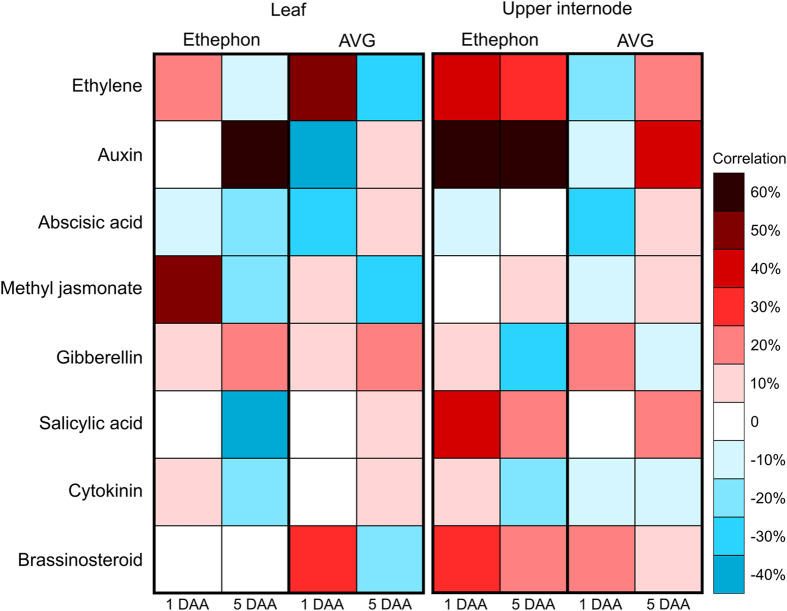
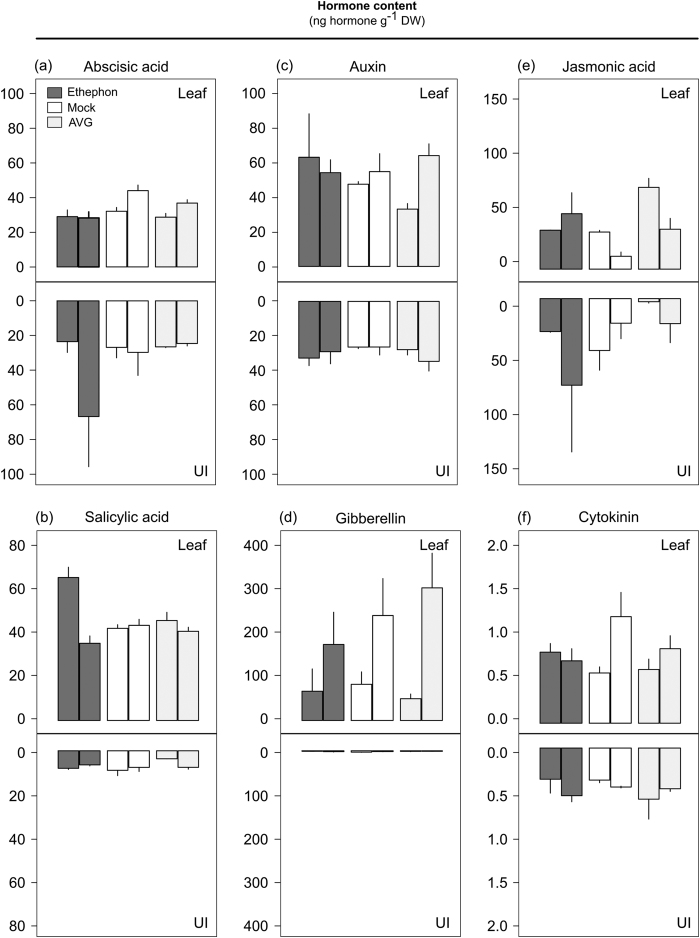
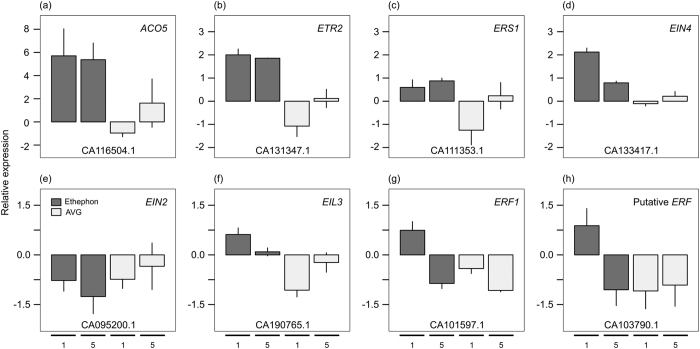
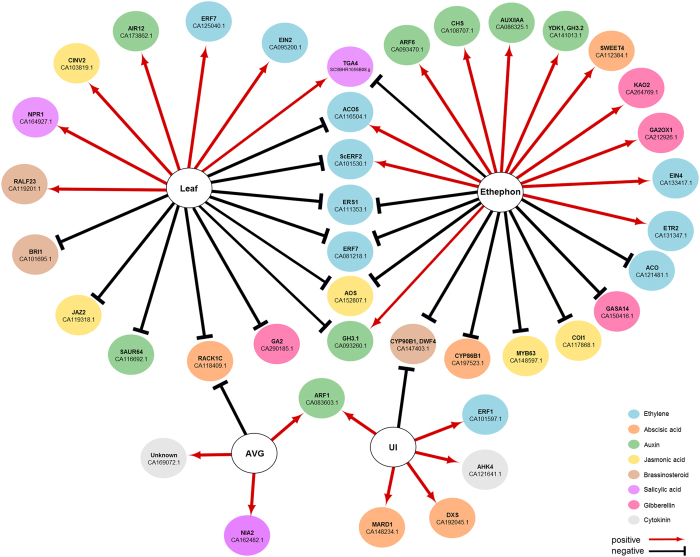
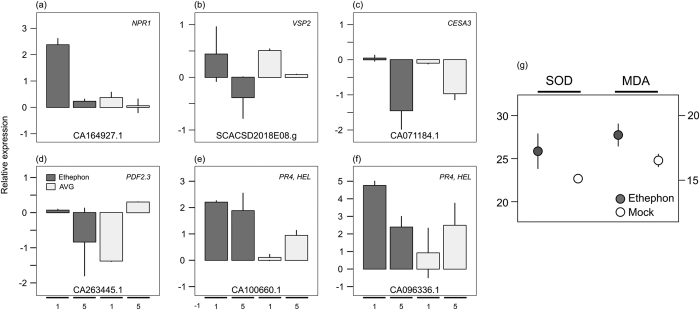
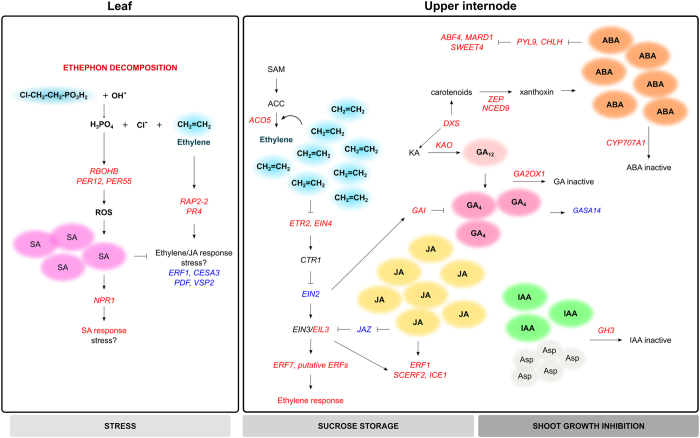
The effects of ethephon as a sugarcane ripener are attributed to ethylene. However, the role of this phytohormone at the molecular level is unknown. We performed a transcriptome analysis combined with the evaluation of sucrose metabolism and hormone profiling of sugarcane plants sprayed with ethephon or aminoethoxyvinylglycine (AVG), an ethylene inhibitor, at the onset of ripening. The differential response between ethephon and AVG on sucrose level and sucrose synthase activity in internodes indicates ethylene as a potential regulator of sink strength. The correlation between hormone levels and transcriptional changes suggests ethylene as a trigger of multiple hormone signal cascades, with approximately 18% of differentially expressed genes involved in hormone biosynthesis, metabolism, signalling, and response. A defence response elicited in leaves favoured salicylic acid over the ethylene/jasmonic acid pathway, while the upper internode was prone to respond to ethylene with strong stimuli on ethylene biosynthesis and signalling genes. Besides, ethylene acted synergistically with abscisic acid, another ripening factor, and antagonistically with gibberellin and auxin. We identified potential ethylene target genes and characterized the hormonal status during ripening, providing insights into the action of ethylene at the site of sucrose accumulation. A molecular model of ethylene interplay with other hormones is proposed.


Conflict of interest statement

The authors declare no competing financial interests.

Figures

Figure 1
Figure 1
Sucrose (a,b) and hexose (reducing sugars, (c,d)) contents (mg sugar g−1 dry weight) and sucrose:hexose ratio (e,f) in leaf and upper (UI, immature) and middle (MI, maturing) internodes of sugarcane plants at five (a,c,e) and 32 (b,d,f) days after ethephon (dark gray), mock (white), or AVG (light gray) application (DAA). Each bar represents the average of four replicates (individual plants), including the standard error of the mean (SEM). The letters denote significant differences using two-way ANOVA (chemical versus tissue interaction, p-value < 0.05) followed by LSD test (p-value < 0.05).
Figure 2
Figure 2
Activity of sucrose metabolizing enzymes in leaf (ad) and middle internode (maturing, (eh)) of sugarcane plants at five and 32 days after ethephon (blue), mock (black), or AVG (red) application (DAA). The enzymes were involved in sucrose synthesis (μmol sucrose g−1 fresh weight min−1): sucrose-phosphate synthase (SPS) (a,e) and sucrose synthase (SuSy, evaluated only at the synthesis direction) (b,f); and sucrose degradation (μmol glucose g−1 fresh weight min−1): soluble acid invertase (SAI) (c,g) and neutral invertase (NI) (d,h). Each point represents the average of four replicates (individual plants), including the standard error of the mean (SEM). The asterisks denote significant differences between means of growth regulators and mock treatment inferred by one- or two-way ANOVA (F values for chemical and chemical versus time point interaction were shown) followed by LSD test (p-value < 0.05 formula image 
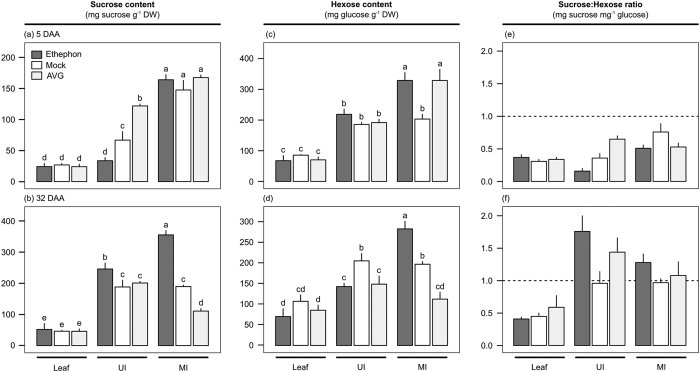
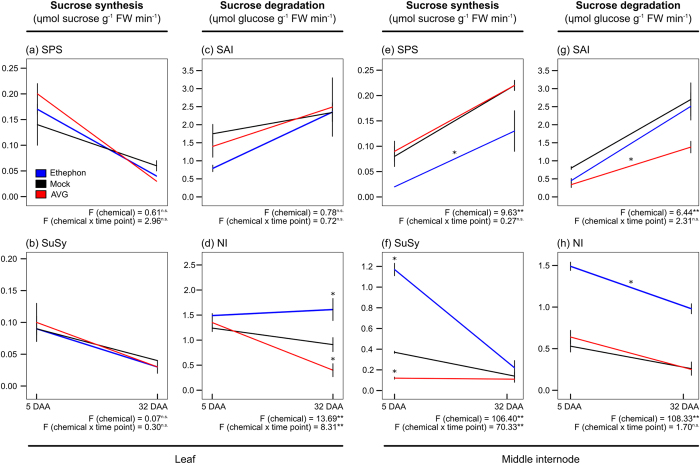
or 0.01*). n.s. means not statistically significant.
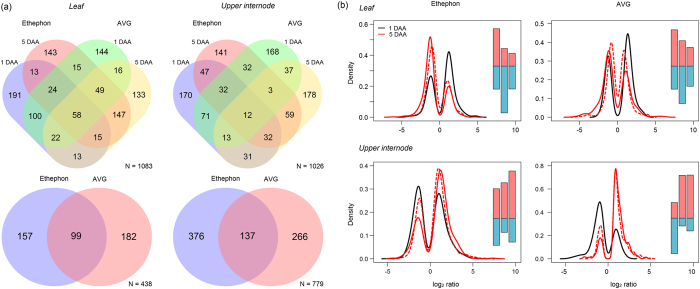
Figure 3
Figure 3. Overview of Sugarcane Assembled Sequences (SAS) identified as differentially expressed (DE) in sugarcane plants sprayed with ethephon and AVG after one and five days (DAA).
(a) Venn diagrams for leaf and upper internode tissues using one-DAA (top) and five-DAA (bottom) mock samples as reference: N means the number of unique SAS in the diagram. (b) Density plots of log2 ratio values (the bimodal distribution reflects the selection of DE SAS based on the HTself algorithm), including a bar chart with the number of up (red) and downregulated (blue) genes in the following order (left to right): one (black line) and five (red line) DAA chemical treated-samples against one DAA mock sample (solid line), and five DAA chemical treated-samples against five DAA mock sample (dashed line).
Figure 4
Figure 4. Functional enrichment analyses.
(a) GOMapMan categories among Sugarcane Assembled Sequences (SAS) identified as differentially expressed (DE) with homology to Arabidopsis. (b) Selected statistically significant enriched GO (Gene Ontology) terms (biological process) and KEGG pathways identified in leaf and upper internode (UI) of plants sprayed with ethephon and AVG; the bubble size indicates the frequency of the GO term within the SAS set. (c) Proportion of hormone-related DE transcripts in each category.
Figure 5
Figure 5. Average correlation values obtained when comparing hormone-related differentially expressed (DE) transcripts identified in sugarcane at one and five days after ethephon and AVG spraying (DAA) with Arabidopsis hormonal transcript indexes (y axis) performed in the HORMONOMETER tool.
The Arabidopsis hormonal treatments include: ethylene (ACC, ethylene precursor), auxin, abscisic acid, methyl jasmonate, brassinosteroid, cytokinin (zeatin) after 30, 60, and 180 min of exposure; salicylic acid after 180 min of exposure; and gibberellin (isoform 3) after 3, 6, and 9 h of exposure. The range of correlation is colour coded for positive (red), neutral (white) and negative (blue).
Figure 6
Figure 6. Hormone concentration (ng g−1 of dry weight) in leaves and upper internodes (UI) of sugarcane plants treated with ethephon, mock (water), and AVG at one and five days after chemical application (consecutive bars, respectively).
(a) Abscisic acid (ABA). (b) Salicylic acid (SA). (c) Auxin (IAA). (d) Gibberellin isoform 4 (GA). (e) Jasmonic acid (JA). (f) Cytokinin, trans-zeatin (CK). Each bar represents the average of four replicates (individual plants), including the standard error of the mean (SEM).
Figure 7
Figure 7. Relative expression of ethylene marker genes in the upper internode of sugarcane plants exposed to ethephon and AVG in relation to mock treatment at one and five days after chemical application (subsequent bars) evaluated by quantitative real-time PCR (qPCR) analysis, using a polyubiquitin gene as reference.
Each bar represents the average of three replicates (individual plants), including the standard error of the mean (SEM). The alias was based on orthology to Arabidopsis. NCBI (National Center for Biotechnology Information) accessions are shown at the bottom of each graph.
Figure 8
Figure 8. Bayesian network based on the relationship among 60 selected hormone-related genes found to be differentially expressed in the microarray analysis, chemical treatments (ethephon and AVG) and plant tissues (leaf and upper internode).
NCBI accession is shown for each transcript, with the exception of TGA4 identified by the Sugarcane Assembled Sequence (SUCEST). It was assumed that gene expression is dependent on the conditions (chemical and tissue), but not the opposite. The type of interactions indicates positive (red) or negative (black) correlation.
Figure 9
Figure 9. Defence or stress indicators.
(af) Relative expression of salicylic acid-mediated suppression of ethylene/jasmonic acid response marker genes in leaves of sugarcane plants exposed to ethephon and AVG in relation to mock treatment at one and five days after chemical application (subsequent bars) evaluated by quantitative real-time PCR (qPCR) analysis, using a polyubiquitin gene as reference. Each bar represents the average of three replicates (individual plants), including the standard error of the mean (SEM). The alias was based on orthology to Arabidopsis. NCBI (National Center for Biotechnology Information) accessions are shown at the bottom of each graph. (g) Superoxide dismutase (SOD) activity (units mg−1 fresh weight min−1) and malondialdehyde (MDA) content (nmol g−1 fresh weight) in ethephon and mock-treated leaves evaluated in tissues harvested at five days after chemical spray. Each bar represents the average of six replicates (individual plants), including the SEM.
Figure 10
Figure 10. Model of potential crosstalk between ethylene and other hormones upon ethephon spraying in sugarcane plants at the onset of ripening.
The ethephon decomposition releases ethylene and phosphoric acid, which may acidify leaf cells. This stress signal might induce NADPH oxidases and peroxidases that stimulate the production of reactive oxygen species (ROS) and, consequently, increase salicylic acid (SA) levels, leading to SA response stimulus over ethylene/jasmonic acid (JA). The ethylene in upper internodes promotes its autocatalytic biosynthesis and transcription of downstream ethylene signalling elements. JA may act synergistically with ethylene, amplifying its response in upper internodes. The synergism between ethylene and abscisic acid (ABA) is also proposed as ethylene seems to promote the expression of ABA biosynthetic genes. Ethylene and ABA may account for sucrose accumulation as ripening signals. The deactivation of gibberellin (GA) and auxin (IAA) through degradation or conjugation might also be induced by ethylene, restraining internode elongation. The genes (italic letters) shown here are placed hierarchically in their respective pathways. Upregulated genes are indicated in red and downregulated genes in blue. The relationship between components include induction (arrow heads) and repression (blocked arrows).

References

    1. Bull T. A. & Glasziou K. T. The evolutionary significance of sugar accumulation in Saccharum. Aust. J. Biol. Sci. 16, 737–742 (1963).
    1. Cheavegatti-Gianotto A. et al.. Sugarcane (Saccharum × officinarum): a reference study for the regulation of genetically modified cultivars in Brazil. Trop. Plant Biol. 4, 62–89 (2011). - PMC - PubMed
    1. FAOSTAT. FAOSTAT: agricultural data faostat.fao.org (2016).
    1. Segato S. V., Mattiuz C. F. M. & Mozambani A. E. Aspectos fenológicos da cana-de-açúcar in Atualização em produção de cana-de-açúcar (eds Segato S. V., Pinto A. S., Jendiroba E. & Nóbrega J. C. M.) 19–36 (Piracicaba CP 2, 2006).
    1. Cardozo N. P. & Sentelhas P. C. Climatic effects on sugarcane ripening under the influence of cultivars and crop age. Sci. Agric. 70, 449–456 (2013).

Publication types

MeSH terms