

ceRNA crosstalk stabilizes protein expression and affects the correlation pattern of interacting proteins
- PMID: 28266541
- PMCID: PMC5339858
- DOI: 10.1038/srep43673
ceRNA crosstalk stabilizes protein expression and affects the correlation pattern of interacting proteins
Abstract
Gene expression is a noisy process and several mechanisms, both transcriptional and post-transcriptional, can stabilize protein levels in cells. Much work has focused on the role of miRNAs, showing in particular that miRNA-mediated regulation can buffer expression noise for lowly expressed genes. Here, using in silico simulations and mathematical modeling, we demonstrate that miRNAs can exert a much broader influence on protein levels by orchestrating competition-induced crosstalk between mRNAs. Most notably, we find that miRNA-mediated cross-talk (i) can stabilize protein levels across the full range of gene expression rates, and (ii) modifies the correlation pattern of co-regulated interacting proteins, changing the sign of correlations from negative to positive. The latter feature may constitute a potentially robust signature of the existence of RNA crosstalk induced by endogenous competition for miRNAs in standard cellular conditions.
Conflict of interest statement
The authors declare no competing financial interests.
Figures
 and
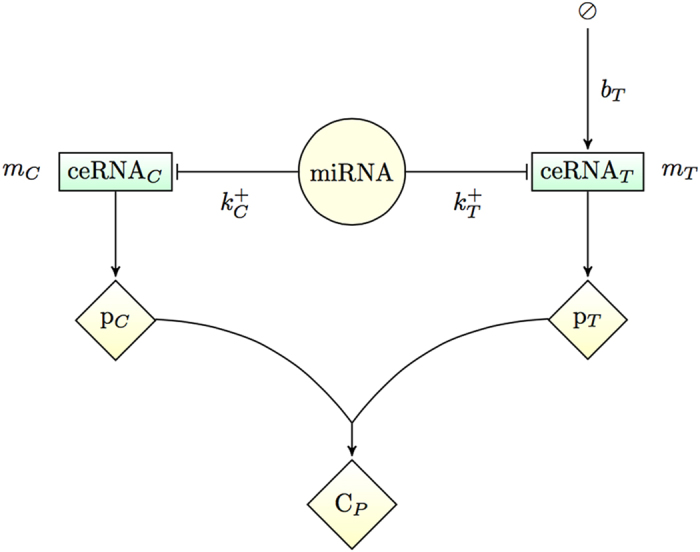
and  , respectively. The functional products of the ceRNAs, proteins pT and pC, can eventually interact to form a complex CP. The key control parameter is the target’s transcription rate bT. See Fig. 7 for a detailed scheme that includes all processes.
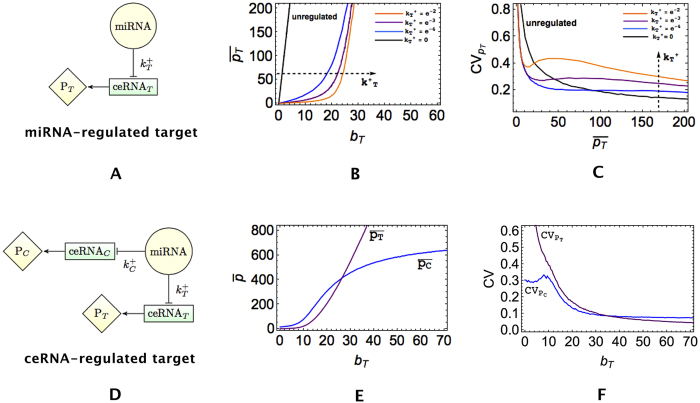
 increases in the direction of the arrow (specifically,
  for orange, purple, blue, black curves respectively). Panels (E) and (F) describe the case of a target regulated through ceRNA competition, depicted in (D), for
  and
and  . Note that no PPI is considered in this case.
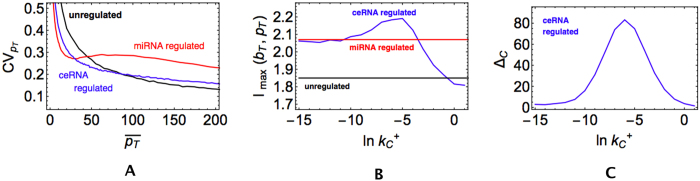
 and
and  ), a miRNA-regulated protein (red line,
  and
and  ) and a ceRNA-regulated protein (blue line,
  and
and  ). (B) Capacity of the target’s expression channel as a function of the miRNA-competitor interaction strength. Color code same as in panel A. (C) Derepression size ΔC of the competitor as a function of the miRNA-competitor interaction strength in the case of ceRNA regulation (same parameters as panel B).
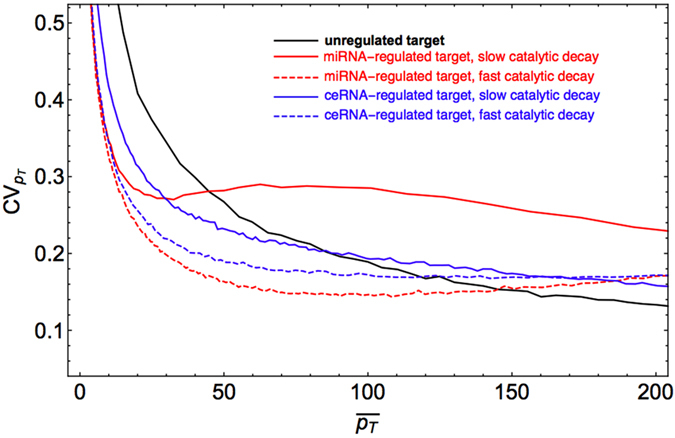
 and
and  ) and a ceRNA-regulated protein (blue,
  and
and  ). The black curve describes the case of an unregulated target (
 and
and  ).
).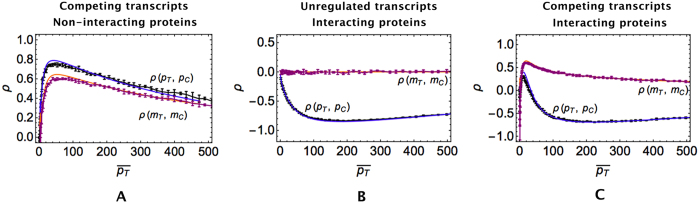
 and
and  ). (B) Case of interacting proteins translated from post-transcriptionally unregulated transcripts (
 ). (C) Case of interacting proteins translated from competing transcripts (
 and
and  ). Lines (blue and orange) correspond to analytical results obtained by the Linear Noise Approximation (see Methods), markers (black and purple) to results from stochastic simulations by the Gillespie algorithm.
 (with
(with  ) and variable bT.
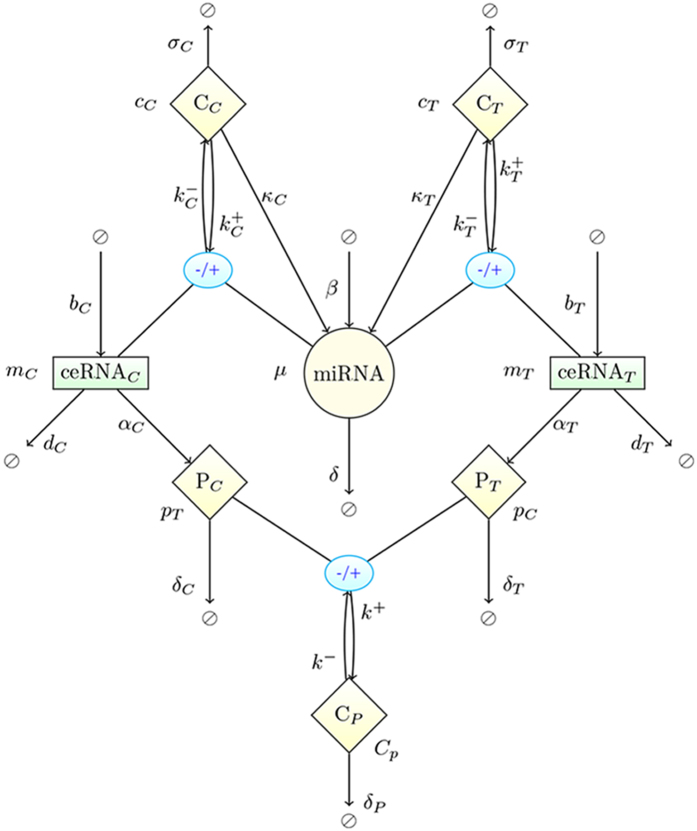
 and
and  respectively forming ceRNA:miRNA complexes cT and cC. Species mT, mC, μ, pT, pC are synthesized (degraded) with the rates bT, bC, β, αT, αC (dT, dC, δ, δT, δC) correspondingly. Protein complex Cp undergoes spontaneous degradation with a rate δp. Finally, cT and cC decay catalytically (ceRNA cleavage and miRNA recycling) with the rates κT and κC respectively. Figure-specific values of the kinetic parameters are reported in Table 1.
References
Publication types
MeSH terms
Substances
LinkOut - more resources
Full Text Sources
Other Literature Sources
