

3D characterization of morphological changes in the intervertebral disc and endplate during aging: A propagation phase contrast synchrotron micro-tomography study
- PMID: 28266560
- PMCID: PMC5339826
- DOI: 10.1038/srep43094
3D characterization of morphological changes in the intervertebral disc and endplate during aging: A propagation phase contrast synchrotron micro-tomography study
Abstract
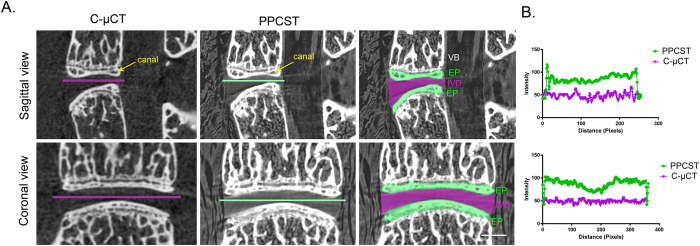
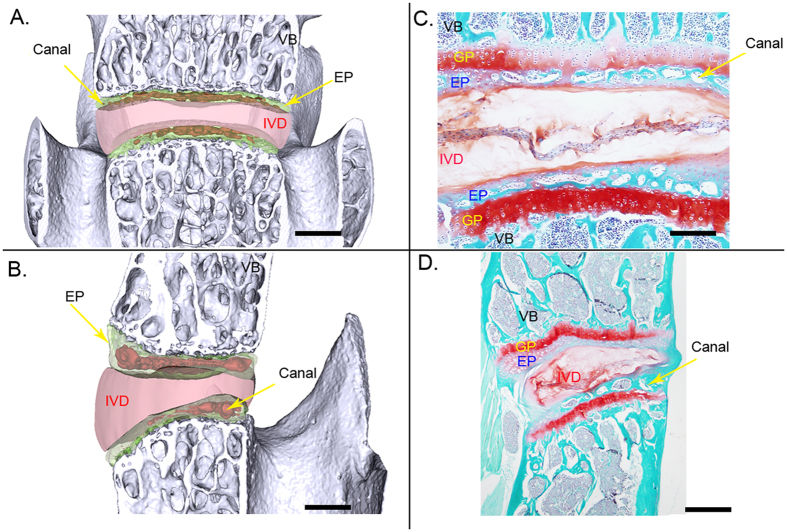
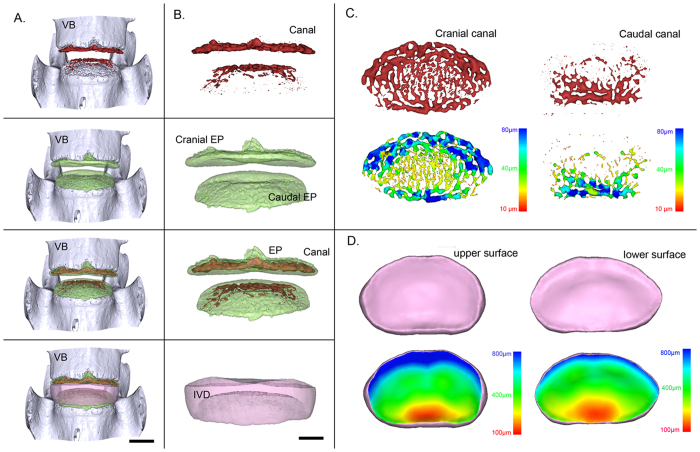
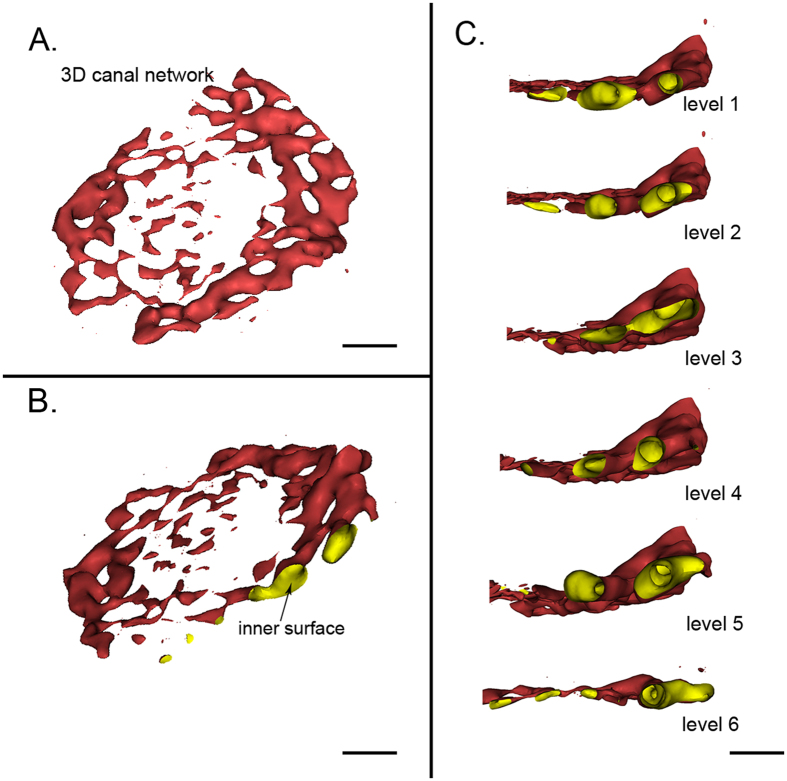
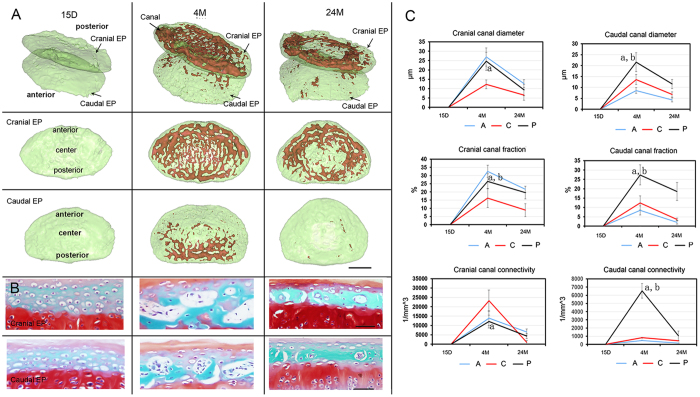
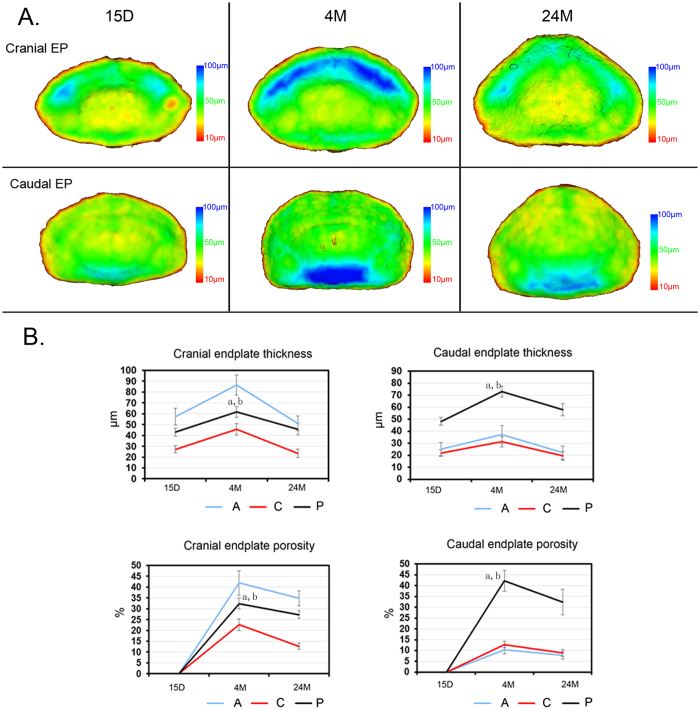
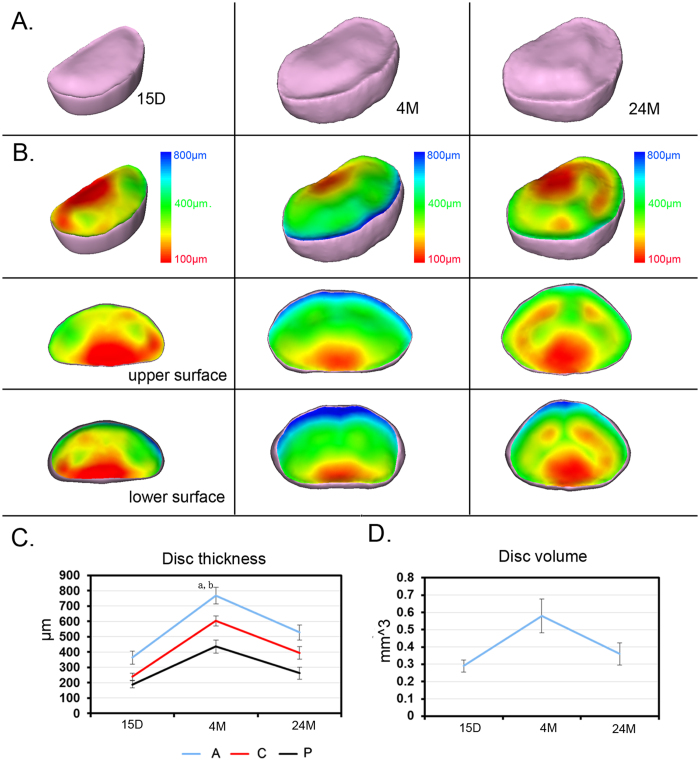
A better understanding of functional changes in the intervertebral disc (IVD) and interaction with endplate is essential to elucidate the pathogenesis of IVD degeneration disease (IDDD). To date, the simultaneous depiction of 3D micro-architectural changes of endplate with aging and interaction with IVD remains a technical challenge. We aim to characterize the 3D morphology changes of endplate and IVD during aging using PPCST. The lumbar vertebral level 4/5 IVDs harvested from 15-day-, 4- and 24-month-old mice were initially evaluated by PPCST with histological sections subsequently analyzed to confirm the imaging efficiency. Quantitative assessments of age-related trends after aging, including mean diameter, volume fraction and connectivity of the canals, and endplate porosity and thickness, reached a peak at 4 months and significantly decreased at 24 months. The IVD volume consistently exhibited same trend of variation with the endplate after aging. In this study, PPCST simultaneously provided comprehensive details of 3D morphological changes of the IVD and canal network in the endplate and the interaction after aging. The results suggest that PPCST has the potential to provide a new platform for attaining a deeper insight into the pathogenesis of IDDD, providing potential therapeutic targets.
Conflict of interest statement
The authors declare no competing financial interests.
Figures
Similar articles
-
Comparison of Synchrotron Radiation-based Propagation Phase Contrast Imaging and Conventional Micro-computed Tomography for Assessing Intervertebral Discs and Endplates in a Murine Model.Spine (Phila Pa 1976). 2017 Aug 1;42(15):E883-E889. doi: 10.1097/BRS.0000000000002110. Spine (Phila Pa 1976). 2017. PMID: 28187077
-
Dynamic adaptation of vertebral endplate and trabecular bone following annular injury in a rat model of degenerative disc disease.Spine J. 2018 Nov;18(11):2091-2101. doi: 10.1016/j.spinee.2018.05.045. Epub 2018 Jun 8. Spine J. 2018. PMID: 29886163
-
Synchrotron tomography of intervertebral disc deformation quantified by digital volume correlation reveals microstructural influence on strain patterns.Acta Biomater. 2019 Jul 1;92:290-304. doi: 10.1016/j.actbio.2019.05.021. Epub 2019 May 11. Acta Biomater. 2019. PMID: 31082569
-
[Research progress of cellular senescence and senescent secretary phenotype in intervertebral disc degeneration].Zhongguo Xiu Fu Chong Jian Wai Ke Za Zhi. 2012 Dec;26(12):1448-52. Zhongguo Xiu Fu Chong Jian Wai Ke Za Zhi. 2012. PMID: 23316633 Review. Chinese.
-
Association between non-traumatic vertebral fractures and adjacent discs degeneration: a cross-sectional study and literature review.BMC Musculoskelet Disord. 2020 Nov 27;21(1):781. doi: 10.1186/s12891-020-03814-0. BMC Musculoskelet Disord. 2020. PMID: 33246433 Free PMC article. Review.
Cited by
-
Magnetic resonance imaging classification in a percutaneous needle injury rat model of intervertebral disc degeneration.J Orthop Surg Res. 2024 Oct 7;19(1):632. doi: 10.1186/s13018-024-05110-2. J Orthop Surg Res. 2024. PMID: 39375759 Free PMC article.
-
Constant compression decreases vascular bud and VEGFA expression in a rabbit vertebral endplate ex vivo culture model.PLoS One. 2020 Jun 25;15(6):e0234747. doi: 10.1371/journal.pone.0234747. eCollection 2020. PLoS One. 2020. PMID: 32584845 Free PMC article.
-
Intervertebral disc degeneration and regeneration: a motion segment perspective.Eur Cell Mater. 2021 Mar 24;41:370-380. doi: 10.22203/eCM.v041a24. Eur Cell Mater. 2021. PMID: 33763848 Free PMC article. Review.
-
SRμCT Reveals 3D Microstructural Alterations of the Vascular and Neuronal Network in a Rat Model of Chronic Compressive Thoracic Spinal Cord Injury.Aging Dis. 2020 May 9;11(3):603-617. doi: 10.14336/AD.2019.0529. eCollection 2020 May. Aging Dis. 2020. PMID: 32489705 Free PMC article.
-
In vivo Mouse Intervertebral Disc Degeneration Models and Their Utility as Translational Models of Clinical Discogenic Back Pain: A Comparative Review.Front Pain Res (Lausanne). 2022 Jun 22;3:894651. doi: 10.3389/fpain.2022.894651. eCollection 2022. Front Pain Res (Lausanne). 2022. PMID: 35812017 Free PMC article. Review.
References
-
- Peterson C. K., Bolton J. E. & Wood A. R. A cross-sectional study correlating lumbar spine degeneration with disability and pain. Spine (Phila Pa 1976) 25, 218–223 (2000). - PubMed
Publication types
MeSH terms
Grants and funding
LinkOut - more resources
Full Text Sources
Other Literature Sources
Medical
