

Theta-alpha EEG phase distributions in the frontal area for dissociation of visual and auditory working memory
- PMID: 28266595
- PMCID: PMC5339864
- DOI: 10.1038/srep42776
Theta-alpha EEG phase distributions in the frontal area for dissociation of visual and auditory working memory
Abstract
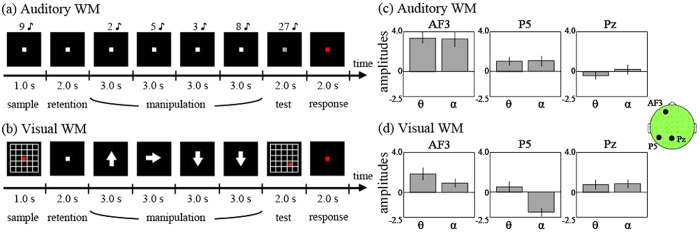
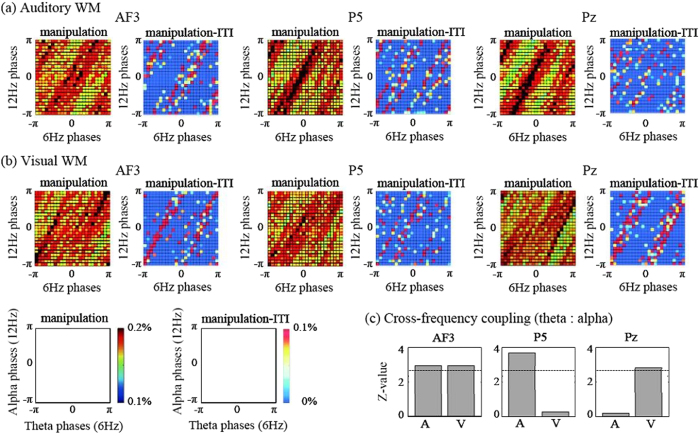
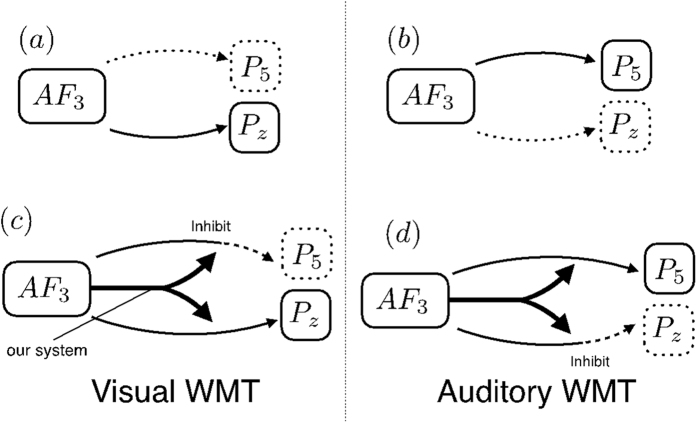
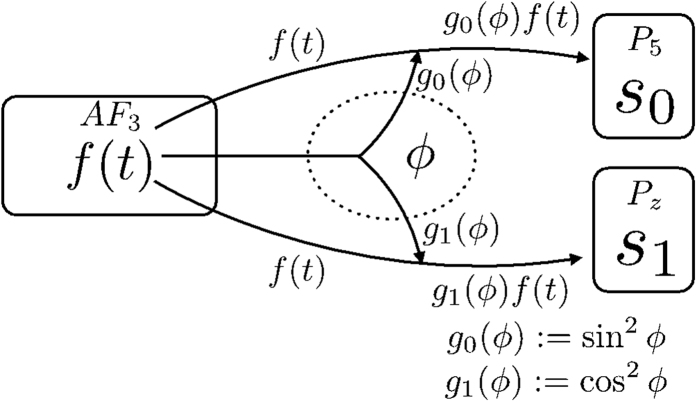
Working memory (WM) is known to be associated with synchronization of the theta and alpha bands observed in electroencephalograms (EEGs). Although frontal-posterior global theta synchronization appears in modality-specific WM, local theta synchronization in frontal regions has been found in modality-independent WM. How frontal theta oscillations separately synchronize with task-relevant sensory brain areas remains an open question. Here, we focused on theta-alpha phase relationships in frontal areas using EEG, and then verified their functional roles with mathematical models. EEG data showed that the relationship between theta (6 Hz) and alpha (12 Hz) phases in the frontal areas was about 1:2 during both auditory and visual WM, and that the phase distributions between auditory and visual WM were different. Next, we used the differences in phase distributions to construct FitzHugh-Nagumo type mathematical models. The results replicated the modality-specific branching by orthogonally of the trigonometric functions for theta and alpha oscillations. Furthermore, mathematical and experimental results were consistent with regards to the phase relationships and amplitudes observed in frontal and sensory areas. These results indicate the important role that different phase distributions of theta and alpha oscillations have in modality-specific dissociation in the brain.
Conflict of interest statement
The authors declare no competing financial interests.
Figures
References
-
- Gevins A., Smith M. E., McEvoy L. & Yu D. High resolution EEG mapping of cortical activation related to working memory: effects of task difficulty, type of processing, and practice. Cereb Cortex 7, 374–385 (1997). - PubMed
-
- Klimesch W. EEG alpha and theta oscillations reflect cognitive and memory performance: a review and analysis. Brain Res Rev 29, 169–195 (1999). - PubMed
-
- Jensen O. & Tesche C. Frontal theta activity in humans increases with memory load in a working memory task. Eur. J. Neurosci. 15, 1395–1400 (2002). - PubMed
-
- Ishihara T. & Yoshii N. Multivariate analytic study of EEG and mental activity in juvenile delinquents. Electroencephalogr. Clin. Neurophysiol. 33, 71–80 (1972). - PubMed
-
- Herrmann C. S., Grigutsch M. & Busch N. A. EEG oscillations and wavelet analysis. In Event-related potentials: A methods handbook(ed. Handy T. C. ) 229–259 (Cambridge, MA: : MIT Press, , 2005).
Publication types
MeSH terms
LinkOut - more resources
Full Text Sources
Other Literature Sources
