. 2017 Mar 7:8:14668.
doi: 10.1038/ncomms14668.

Bioaerosol generation by raindrops on soil

Affiliations

Bioaerosol generation by raindrops on soil

Young Soo Joung et al. Nat Commun. .

Abstract

Aerosolized microorganisms may play an important role in climate change, disease transmission, water and soil contaminants, and geographic migration of microbes. While it is known that bioaerosols are generated when bubbles break on the surface of water containing microbes, it is largely unclear how viable soil-based microbes are transferred to the atmosphere. Here we report a previously unknown mechanism by which rain disperses soil bacteria into the air. Bubbles, tens of micrometres in size, formed inside the raindrops disperse micro-droplets containing soil bacteria during raindrop impingement. A single raindrop can transfer 0.01% of bacteria on the soil surface and the bacteria can survive more than one hour after the aerosol generation process. This work further reveals that bacteria transfer by rain is highly dependent on the regional soil profile and climate conditions.


Conflict of interest statement

The authors declare no competing financial interests.

Figures

Figure 1
Figure 1. Bioaerosol generation by raindrops.
(ad) Aerosols generated by drop impingement on a reference surface, which maximized the aerosol generation (a TLC plate (TLC-C) in Table 1). The TLC plates served as an ideal soil-like surface. The white lines are the trajectories of aerosols ejected from the initial droplet after impact over a period of 400 ms. Due to air flow above the droplet, the trajectories of the ejected aerosols are curved. The scale bars indicate 1 mm. For more details, see Supplementary Movie 1. (e) Schematic illustration of the experimental procedure for drop impingement on soil and aerosol collection. (f) Confocal microscopy images of C. glutamicum on the surface of clay soil with the cell density of 250 cells mm−2. (g,h) Fluorescent microscopy images of aerosols generated by drop impingement on clay soil pre-permeated with C. glutamicum. The red circles and the yellow dots indicate aerosols and C. glutamicum, respectively. The scale bars indicate 200, 50 and 25 μm in fh, respectively.
Figure 2
Figure 2. Viability of bacteria transferred by aerosols.
(a) Colonies of three kinds of soil bacteria, C. glutamicum, P. syringae and B. subtilis, cultured on agar plates for 2 days after they were aerosolized by raindrops on sandy-clay soil (Sandy clay-A in Table 1). The inner black circles indicate the location where raindrops hit on the soil. The yellow dots indicate the colonies where bacteria grew. The scale bars represent 10 mm. (b) Viability test with respect to the duration of drying the aerosols collected on the sampling plates. The time, displayed in the images, indicate the drying duration. Aerosols were generated from TLC plates (TLC-C in Table 1) pre-permeated with C. glutamicum. The colonies were cultured on agar plates for 2 days after the aerosolization. The scale bars indicate 10 mm. (c) Average number of colony-forming units from a single raindrop when the aerosols, collected on the sampling plates, were transferred to the agar plates immediately after aerosolization. The error bars represent±1 s.d. resulting from nine drop impingements. The impact velocity was 1.4 m s−1, the drop diameter of 2.8 mm, and the surface temperature 20 °C for all cases. (d) Viability of bacteria with respect to time after aerosolization. The viability is the ratio of the number of colonies on the agar plate to the number of aerosols containing bacteria collected on the sampling plate. For more details, see ‘Methods' section.
Figure 3
Figure 3. Particle transfer by bubble bursting inside raindrops.
(a) Bubble formation at the interface of surface and raindrop. The red boxes indicate the regions magnified in the images below. The scale bars represent 1 mm. (b) Schematic illustrations of the two cases of bacteria existence. Bacteria can exist inside the raindrop (Case 1) or on the surface (Case 2). (c) The number of particles dispersed by aerosols generated on a TLC (TLC-C) plate with respect to surface temperature. Drop impingements were conducted with two different initial conditions: first, particles are in the raindrops (Case 1) and second, particles are on the surfaces (Case 2). In Case 1 and Case 2, different particle concentrations and densities were used; Case 1: 20 particles per nl, 2 particles per nl, and 0.2 particles per nl; Case 2: 620 particles per mm2, 72 particles per mm2, and 7 particles per mm2. For both cases, 1 μm diameter yellow-green fluorescent microspheres were used. The red symbols and the white symbols indicate the drop impingements of Case 1 and Case 2, respectively. The error bars represent±1 s.d. resulting from nine drop impingements.
Figure 4
Figure 4. Relationship between aerosol generation and bubbles.
(a) The number of aerosols as a function of aerosol diameter. From the curves, we can estimate the number of bubbles formed inside the raindrop as a function of surface temperature. The impact velocity was 1.4 m s−1 with the raindrop diameter of 2.8 mm for all the surface temperatures. (b) The number of bubbles estimated by the theory (the red symbols) and counted using high-speed images (the white symbols). The theoretical data were estimated by curve fittings and an empirical equation reported. (c) The number of bubbles created inside a droplet (the white symbols) and the total volume of aerosols (the red symbols) with respect to surface temperature.
Figure 5
Figure 5. Particle transfer under different particle densities on soils.
(a) Schematic illustration of the key parameters related to particle dispersion by raindrop impact. (b) Fluorescence microscopy images of surfaces with different particle densities. The bright dots are 1 μm diameter yellow-green fluorescent microspheres. The approximate surface particle density of images I, II, III and IV are 10, 102, 103 and 104 particles per mm2, respectively. The scale bars represent 500 μm. (c) Aerosols containing 1 μm microspheres and collected on a sampling plate. The scale bars represent 25 μm. (d) The number of aerosols decreases exponentially with respect to aerosol diameter. (e) The total number of microspheres dispersed by a single raindrop is linearly proportional to the surface density of the microspheres. The surface temperature is 25 °C and the raindrop velocity at impact is 1.4 m s−1 for d and e. The error bars indicate±1 s.d. resulting from nine drop impingements. The dotted lines in d indicate exponential fitting lines.
Figure 6
Figure 6. Particle transfer under different surface temperatures and impact conditions.
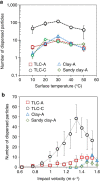
(a) The number of particles dispersed by a single drop impingement with respect to surface temperature. The surface temperature was varied from 10 to 50 °C. (b) The number of microspheres dispersed by aerosols at different impact velocities. Surface particle densities of TLC-A, TLC-C, and Clay-A, and Sandy clay-A are 623, 627, 1,308 and 1,725 particles per mm2, respectively, in a,b. The raindrop velocity at impact is 1.4 m s−1 for a and the surface temperature is 25 °C for b. The error bars indicate±1 s.d. resulting from nine drop impingements. The dotted lines in b indicate the second order polynomial fitting lines.
Figure 7
Figure 7. Bacterial dispersion through aerosols generated by raindrops.
(a) The maximum cell density of aerosols dispersed from the surfaces pre-permeated by microspheres or bacteria. (b) Normalized cell density formula image=C* × ɛ−1 with respect to non-dimensional surface temperature, T*, which is the ratio of the surface temperature T to the critical surface temperature Tc, where C* is the ratio of the dispersed cell density to the surface cell density, ɛ is the aerosolization efficiency obtained from a, and Tc is the surface temperature at which the maximum dispersed cell density is obtained. (c) Normalized cell density with respect to the dimensionless impact velocity, which is the ratio of the impact velocity V to the critical impact velocity Vc at which the maximum dispersed cell density is obtained. For b,c, six types of soils, two kinds of reference surfaces, three different species of bacteria, and two different sizes of microspheres were used as shown in Table 1. The red lines in b,c indicate the polynomial fitting lines. The error bars represent±1 s.d. resulting from more than 90 drop impingements. (d) Average aerosolization efficiency of three kinds of soil bacteria on four different soils and a reference surface (Table 1). On Sand-A and Sand-B, no bioaerosol was observed. The error bars represent±1 s.d. resulting from nine drop impingements.

References

    1. Lighthart B. & Mohr A. J. Atmospheric Microbial Aerosols Theory and Applications Springer (1994).
    1. Knopf D. A., Alpert P. A., Wang B. & Aller J. Y. Stimulation of ice nucleation by marine diatoms. Nat. Geosci. 4, 88–90 (2011).
    1. Cowling B. J. et al.. Aerosol transmission is an important mode of influenza A virus spread. Nat. Commun. 4, 1935 (2013). - PMC - PubMed
    1. Douwes J., Thorne P., Pearce N. & Heederik D. Bioaerosol health effects and exposure assessment: progress and prospects. Ann. Occup. Hyg. 47, 187–200 (2003). - PubMed
    1. Harrison M. D. Aerosol dissemination of bacterial plant pathogens. Ann. N. Y. Acad. Sci. 353, 94–104 (1980).

Publication types