. 2017 Mar 7;7(3):e1052.
doi: 10.1038/tp.2017.20.

Ablation of neuropsin-neuregulin 1 signaling imbalances ErbB4 inhibitory networks and disrupts hippocampal gamma oscillation

Affiliations

Ablation of neuropsin-neuregulin 1 signaling imbalances ErbB4 inhibitory networks and disrupts hippocampal gamma oscillation

M Kawata et al. Transl Psychiatry. .

Abstract

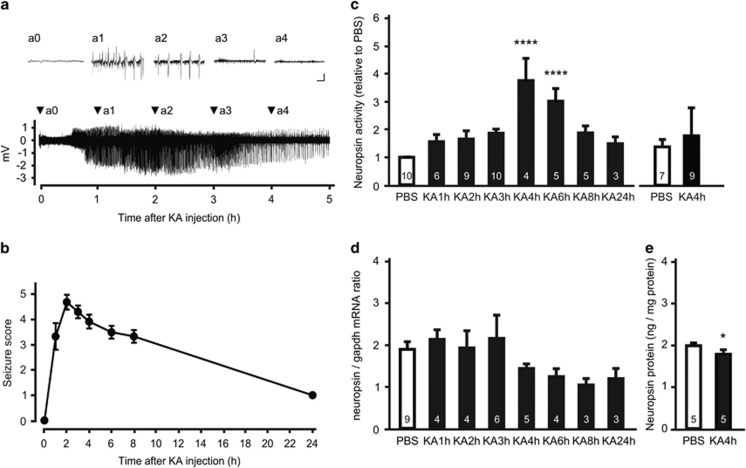
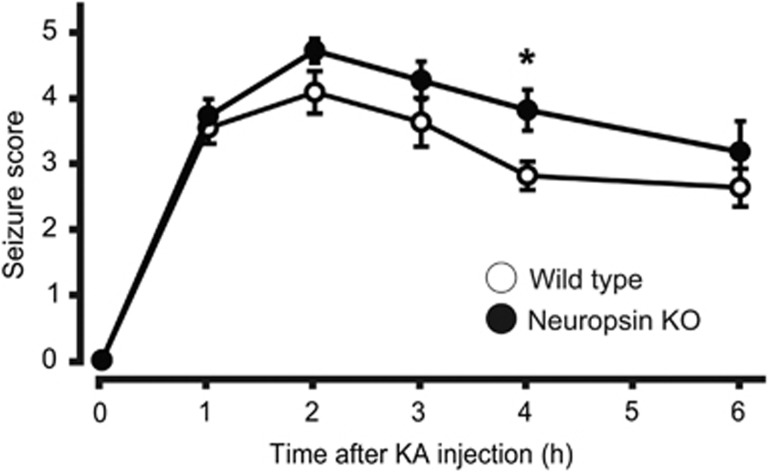
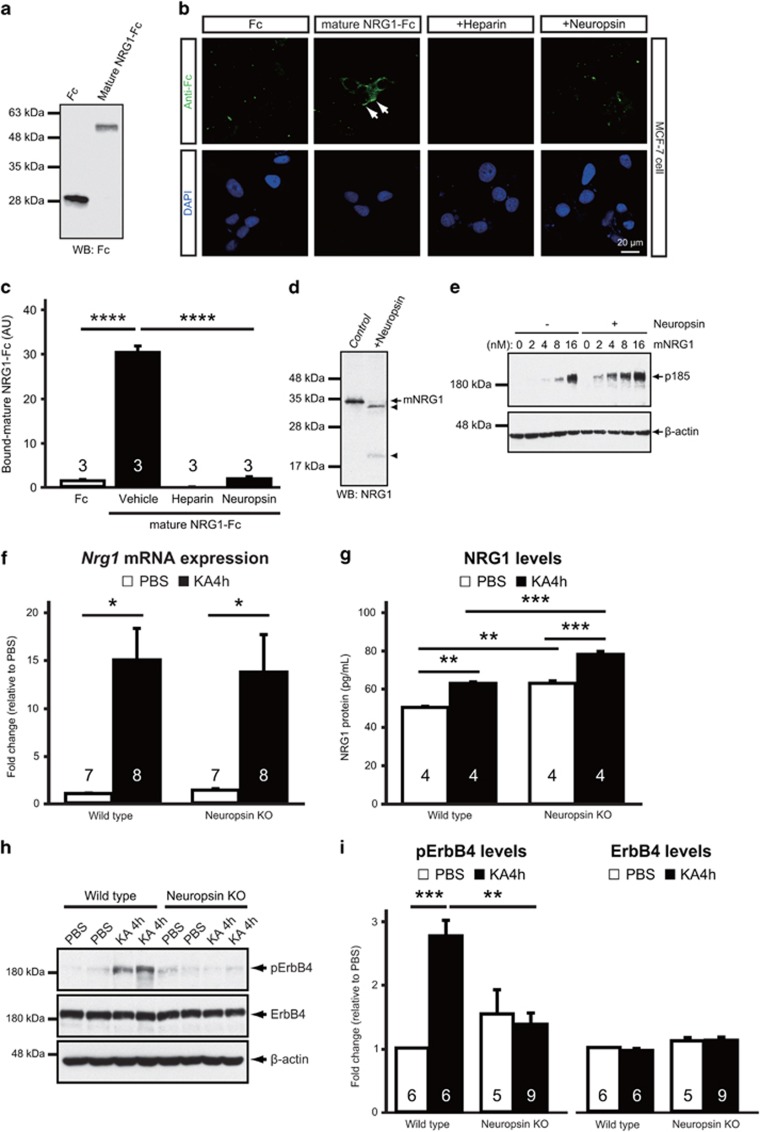
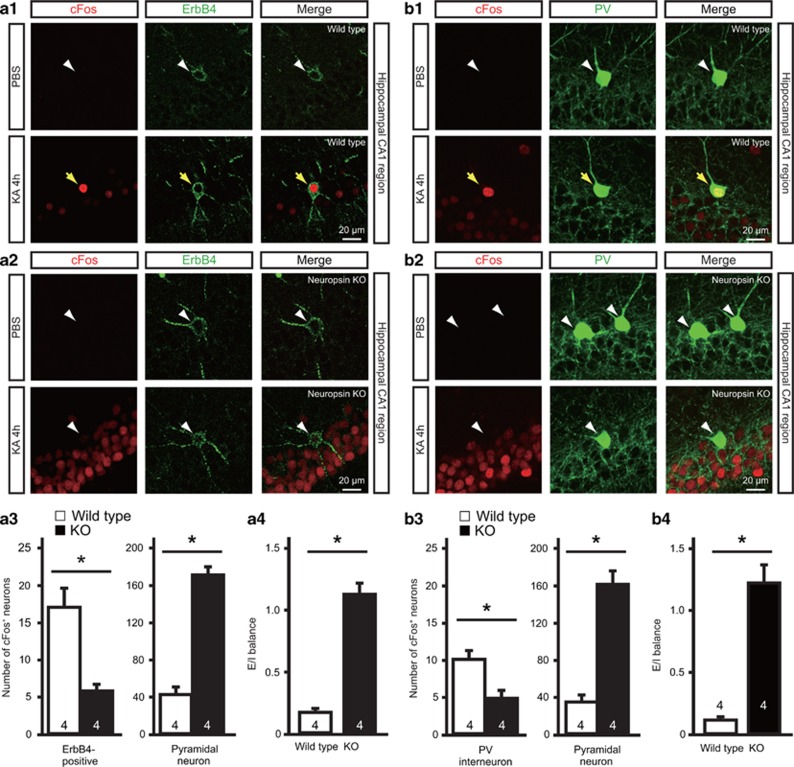
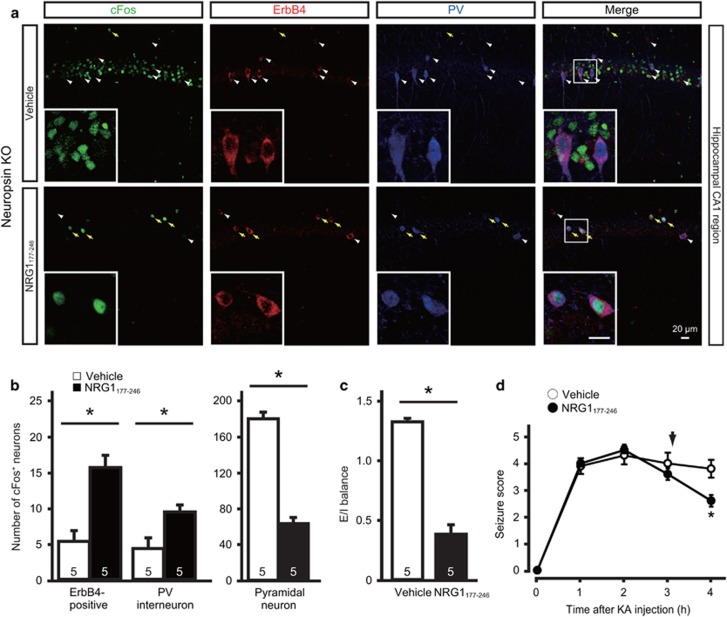
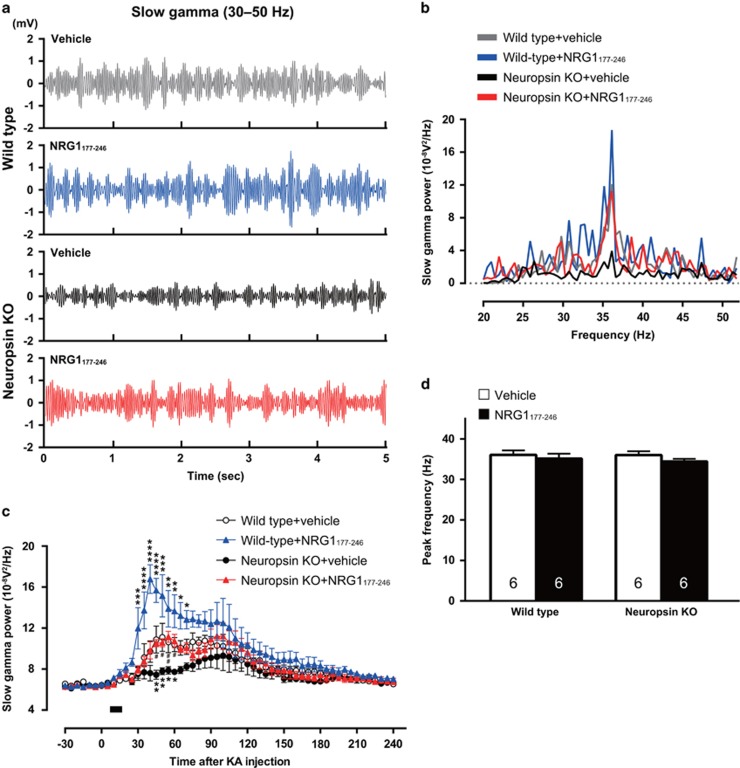
Parvalbumin-expressing interneurons are pivotal for the processing of information in healthy brain, whereas the coordination of these functions is seriously disrupted in diseased brain. How these interneurons in the hippocampus participate in pathological functions remains unclear. We previously reported that neuregulin 1 (NRG1)-ErbB4 signaling, which is actuated by neuropsin, is important for coordinating brain plasticity. Neuropsin cleaves mature NRG1 (bound to extracellular glycosaminoglycans) in response to long-term potentiation or depression, liberating a soluble ligand that activates its receptor, ErbB4. Here, we show in mice that kainate-induced status epilepticus transiently elevates the proteolytic activity of neuropsin and stimulates cFos expression with a time course suggesting that activation of ErbB4- and parvalbumin-expressing interneurons follows the excitation and subsequent silencing of pyramidal neurons. In neuropsin-deficient mice, kainate administration impaired signaling and disrupted the neuronal excitation-inhibition balance (E/I balance) in hippocampal networks, by decreasing the activity of parvalbumin-positive interneurons while increasing that of pyramidal neurons, resulting in the progression of status epilepticus. Slow, but not fast, gamma oscillations in neuropsin-deficient mice showed reduced power. Intracerebroventricular infusion of the soluble NRG1 ligand moiety restored the E/I balance, status epilepticus and gamma oscillations to normal levels. These results suggest that the neuropsin-NRG1 signaling system has a role in pathological processes underlying temporal lobe epilepsy by regulating the activity of parvalbumin-expressing interneurons, and that neuropsin regulates E/I balance and gamma oscillations through NRG1-ErbB4 signaling toward parvalbumin-expressing interneurons. This neuronal system may be a useful target of pharmacological therapies against cognitive disorders.


Conflict of interest statement

The authors declare no conflict of interest.

Figures

Figure 1
Figure 1
Seizures activate hippocampal neuropsin in vivo. (a) Representative trace of a local field potential in the hippocampal CA1 region after intraperitoneal injection of kainate (kainic acid, KA). Insets (a0–a4) show the waveforms at the times indicated by arrowheads. Scale bars, 1 mV and 1 s. (b) Time course for the change in seizure scores after KA administration. The seizure score increased sharply within 1 h after KA administration and remained high for at least 8 h (n=13 mice). (c) Endogenous neuropsin activity at various time points in the hippocampus of mice in which status epilepticus was induced (left) or not induced (right) by KA administration. Neuropsin activity was significantly higher 4 and 6 h after KA administration only in those mice with induced status epilepticus (F(7,44)=7.902; ****P<0.0001, one-way ANOVA with Dunnett's post-hoc test). (d) Quantitative real-time PCR analysis of neuropsin mRNA in mouse hippocampus after KA administration. Data are shown as neuropsin mRNA relative to Gapdh mRNA. The expression of neuropsin mRNA was not affected by seizure activity (one-way ANOVA, F(7,30)=1.597, P=0.1746). (e) Concentration of neuropsin protein in the mouse hippocampus 4 h after PBS (white bars) or KA (black bars) administration. The amount of neuropsin protein fell slightly at 4 h after KA administration (t-test, t8=2.471; *P=0.0386 vs PBS-treated mice). Error bars indicate the SEM. Numbers inside columns indicate n. PBS, phosphate buffered saline; SEM, standard error of the mean.
Figure 2
Figure 2
Time course for the seizure score in neuropsin-knockout (KO) mice administered kainate (KA). Mice received repeated injections of KA. KA-treated neuropsin-KO mice (black circles; n=11 mice) showed progression of seizures compared with KA-treated wild-type mice (white circles; n=11 mice, two-way ANOVA, F(1,20)=5.744; *P=0.0264). Seizure score of neuropsin-KO mice was significantly higher than that of wild-type mice only at the 4 h after KA administration (*P=0.046; two-way ANOVA with the Sidak post-hoc test). Error bars indicate standard error of the mean.
Figure 3
Figure 3
Neuropsin modulates NRG1–ErbB4 signaling. (a) Western blots with control Fc protein and mouse mNRG1-Fc protein probed with an anti-Fc antibody. (b) MCF-7 cells were treated with mNRG1-Fc with or without heparin or neuropsin. Fc and mNRG1-Fc were detected with Alexa Fluor 488-conjugated anti-rabbit IgG (green, upper panels). The nuclei were labeled with DAPI (blue, lower panels). mNRG1-Fc binds to MCF-7 cells, and this binding is abolished by treatment of the cells with heparin or neuropsin. (a, b) Each show one representative result from three independent experiments. (c) Quantitative analysis of Fc (white bar) or mNRG1-Fc (black bars) immunofluorescent staining in MCF-7 cells after treatment with vehicle, heparin or neuropsin (30–54 cells; n=3 independent experiments) as shown in b. Heparin or neuropsin administration significantly reduced the immunoreactivity of mNRG1-Fc (one-way ANOVA, F(3,8)=247.0; ****P<0.0001 vs vehicle). Means (AU, arbitrary units) and the SEM are shown. ****P<0.0001; one-way ANOVA with Tukey's post-hoc test. (d) Recombinant human mNRG1 was preincubated without (Control) or with neuropsin (+Neuropsin) and then subjected to western blotting with an anti-C-terminal mNRG1 antibody. Proteolytic cleavage of mNRG1 by neuropsin results in the appearance of two major immunoreactive fragments (arrowheads), corresponding to cleaved mNRG1 C-terminal fragments. Similar results were seen in three independent experiments. (e) MCF-7 cells were treated with human mNRG1 at the indicated concentrations with or without neuropsin. Phosphorylation of p185 (ErbB), the receptor for mNRG1, was analyzed by western blotting with an anti-phosphotyrosine antibody. The β-actin control blot verified equivalent loading. Similar results were obtained in three independent experiments. (f) Nrg1 type I mRNA levels are upregulated in the hippocampus of both wild-type (*P=0.0126 vs PBS) and neuropsin-KO (*P=0.0312 vs PBS) mice 4 h after KA administration (black bars) compared with those following PBS injection (white bars) (one-way ANOVA, F(3,26)=6.654; P=0.0017). Nrg1 type I mRNA was quantified relative to the expression of Gapdh mRNA using real-time PCR. The fold change was normalized to PBS in wild-type mice. (g) Concentration of NRG1 protein, measured using ELISA, in hippocampal homogenates from wild-type or neuropsin-KO mice 4 h after PBS (white bars) or KA (black bars) administration. KA-induced upregulation of NRG1 protein levels in neuropsin-KO mice is greater than that in wild-type mice (one-way ANOVA, F(3,12)=39.14; ***P=0.0004 for the wild-type after KA administration vs neuropsin-KO after KA administration). (h) Representative western blots showing the levels of phosphorylated ErbB4 (pErbB4), total ErbB4 and β-actin in the hippocampus from wild-type or neuropsin-KO mice 4 h after PBS or KA administration. (i) Quantitative densitometric analysis of western blots. Ratios for pErbB4/ErbB4 (left) and ErbB4/β-actin (right) are shown. The fold change was normalized to PBS in wild-type mice. pErbB4 protein levels are upregulated by seizure activity in wild-type mice (one-way ANOVA, F(3,22)=9.601, ***P=0.0003 vs PBS) but not in neuropsin-KO mice (P=0.9637 vs PBS). β-actin served as the loading control. Error bars indicate the SEM. *P<0.05, **P<0.01, ***P<0.001 and ****P<0.0001; one-way ANOVA with Turkey's post-hoc test. Numbers inside columns indicate n. KA, kainate; KO, knockout; NRG1, neuregulin 1; PBS, phosphate buffered saline; SEM, standard error of the mean.
Figure 4
Figure 4
Neuropsin-KO mice show reduced cFos expression in ErbB4-positive neurons and inhibitory activity and enhanced excitatory activity after seizure. (a1, a2) Expression of cFos in ErbB4-positive and pyramidal neurons of wild-type (a1) or neuropsin-KO (a2) mice 4 h after PBS (upper panel) or KA (lower panel) administration. Fluorescent labeling of the hippocampal CA1 region shows strong cFos immunoreactivity (red) in ErbB4-positive neurons (green) in wild-type mice, but only faint staining in neuropsin-KO mice. Yellow arrows indicate ErbB4-positive neurons expressing cFos. White arrowheads indicate ErbB4-positive neurons that do not express cFos. (a3) Quantitative analysis of cFos immunofluorescent labeling of ErbB4-positive and pyramidal neurons of the wild-type (white bars) and neuropsin-KO (black bars) mice shown in a1 and a2. The number of cFos-expressing ErbB4-positive neurons in neuropsin-KO mice was significantly lower than that in wild-type mice (Mann–Whitney U test, *P=0.0286 vs wild-type); by contrast, the number of cFos-immunoreactive pyramidal neurons from neuropsin-KO mice was significantly higher than that in wild-type mice (Mann–Whitney U test, *P=0.0286 vs wild-type). Data are expressed as the mean and SEM. (a4) E/I balance, defined as the ratio between the fractions of pyramidal neurons and ErbB4-positive neurons expressing cFos, in wild-type (white bar) and neuropsin-KO (black bar) mice. The E/I balance in neuropsin-KO mice was significantly higher than that in wild-type mice (Mann–Whitney U test, *P=0.0286 vs wild-type). (b1, b2) Expression of cFos in parvalbumin (PV)-positive interneurons (arrows) and pyramidal neurons in wild-type (b1) or neuropsin-KO (b2) mice 4 h after PBS (upper panel) or KA (lower panel) administration. Fluorescent labeling of the hippocampal CA1 region shows strong cFos immunoreactivity (red) in parvalbumin-positive interneurons (green) in wild-type mice, but only faint staining in neuropsin-KO mice. Yellow arrows indicate parvalbumin-positive neurons expressing cFos. White arrowheads indicate parvalbumin-positive neurons that do not express cFos. (b3) Quantitative analysis of cFos immunofluorescent labeling in PV-positive interneurons and pyramidal neurons of wild-type (white bars) and neuropsin-KO (black bars) in the mice shown in b1 and b2. The number of cFos-expressing parvalbumin-positive interneurons in neuropsin-KO mice was significantly lower than that in wild-type mice (Mann–Whitney U test, *P=0.0286 vs wild-type); by contrast, the number of cFos-immunoreactive pyramidal neurons in neuropsin-KO mice was significantly higher than that in wild-type mice (Mann–Whitney U test, *P=0.0286 vs wild-type). Data are expressed as the mean and SEM. (b4) E/I balance, defined as the ratio between the fractions of pyramidal neurons and parvalbumin-positive interneurons expressing cFos in wild-type (white bar) and neuropsin-KO (black bar) mice. The E/I balance in neuropsin-KO mice was significantly higher than that in wild-type mice (Mann–Whitney U test, *P=0.0286 vs wild-type). Numbers inside columns indicate n. KA, kainate; KO, knockout; PBS, phosphate buffered saline; SEM, standard error of the mean.
Figure 5
Figure 5
Effect of intracerebroventricular injection of NRG1177-246 on E/I balance and KA-induced seizure in neuropsin-KO mice. (a) Expression of cFos (green) in ErbB4-positive neurons (red), parvalbumin (PV)-positive interneurons (blue) and pyramidal neurons at 4 h after KA administration in vehicle- (upper panel) or NRG1177-246-injected (lower panel) neuropsin-KO mice. Yellow arrows indicate ErbB4-positive neurons expressing cFos. White arrowheads indicate ErbB4-positive neurons that do not express cFos. Regions inside the boxes are enlarged in the inset images (scale bar, 20 μm). (b) Quantitative analysis of cFos expression in ErbB4-positive neurons, PV-positive interneurons, and pyramidal neurons in the vehicle- (white bars) and NRG1177-246-injected (black bars) neuropsin-KO mice shown in a. Significantly more ErbB4-positive neurons and parvalbumin-positive interneurons were immunoreactive for cFos in NRG1177-246-injected neuropsin-KO mice than in vehicle-injected mice (Mann–Whitney U test, *P=0.0286 vs vehicle); by contrast, the number of cFos-immunoreactive pyramidal neurons in NRG1177-246-injected neuropsin-KO mice was significantly lower than that in vehicle-injected mice (Mann–Whitney U test, *P=0.0286 vs vehicle). (c) E/I balance, defined as the ratio between the fractions of pyramidal neurons and parvalbumin-positive interneurons expressing cFos, in vehicle- (white bar) and NRG1177-246-injected (black bar) neuropsin-KO mice. The E/I balance in NRG1177-246-injected neuropsin-KO mice was significantly lower than that in vehicle-injected mice (Mann–Whitney U test, *P=0.0286 vs vehicle). Numbers inside the columns indicate n. (d) Time course of the seizure score in vehicle- or NRG1177-246-injected neuropsin-KO mice after KA administration. The seizure score for NRG1177-246-injected mice (black circles; n=5 mice) was significantly lower than that for vehicle-injected mice (white circles; n=5 mice) only at 4 h after KA administration (F(1,8)=1.134; *P=0.019; two-way ANOVA with the Sidak post-hoc test). The arrow denotes the point of vehicle or NRG1177-246 injection. Error bars indicate the SEM. E/I balance, excitation-inhibition balance; KA, kainate; KO, knockout; NRG1, neuregulin 1.
Figure 6
Figure 6
Disrupted slow gamma oscillations in neuropsin-KO mice. (a, b) Representative local field potential traces (30–50 Hz) (a) and power spectra (b) of KA-induced slow gamma oscillations in wild-type mice after vehicle (gray) or NRG1177-246 injection (blue) and in neuropsin-KO mice after vehicle (black) or NRG1177-246 injection (red). (c) Time course for the mean power (and SEM) (30–50 Hz) of KA-induced slow gamma oscillations in wild-type mice after vehicle (white circles; n=6 mice) or NRG1177-246 injection (blue triangles; n=6 mice) and in neuropsin-KO mice after vehicle (black circles; n=6 mice) or NRG1177-246 injection (red triangles; n=6 mice). The power of the slow gamma oscillations in the CA1 region in neuropsin-KO mice was less than that in wild-type mice, but recovered after injection of NRG1177-246 (F(3,20)=6.343, P=0.0034; two-way ANOVA). Significant differences between wild-type and neuropsin-KO mice were observed at 45–60 min after vehicle injection (45 min, **P=0.0044; 50 min, **P=0.0067; 55 min, *P=0.0347; 60 min, *P=0.0459; two-way ANOVA with the Sidak post-hoc test). Significant differences between wild-type mice were seen from 30 to 70 min after injection of vehicle or NRG1177-246 (30 min, ***P=0.0002; 35 min, ****P<0.0001; 40 min, ****P<0.0001; 45 min, ****P<0.0001; 50 min, ***P=0.0005; 55 min, **P=0.0082; 60 min, **P=0.0082; 65 min, *P=0.0117; 70 min, *P=0.0462; two-way ANOVA with the Sidak post-hoc test). There were significant differences between neuropsin-KO mice at 45–60 min post-injection with vehicle or NRG1177-246 (45 min, #P=0.0145; 50 min, #P=0.0329; 55 min, ##P=0.0075; 60 min, #P=0.0183; two-way ANOVA with the Sidak post-hoc test). NRG1177-246 or vehicle was injected during the time period indicated by the bar. (d) Bar graph showing the mean (and SEM) peak frequency of KA-induced slow gamma oscillations in wild-type mice and neuropsin-KO mice after injection of vehicle (white bar) or NRG1177-246 (black bar). No difference in the peak frequency of slow gamma oscillations was detected between the groups (F(3,20)=0.6128, P=0.6146; one-way ANOVA with Tukey's post-hoc test). Numbers inside columns indicate n. KA, kainate; KO, knockout; NRG1, neuregulin 1; SEM, standard error of the mean.

Similar articles

Cited by

References

    1. Froemke RC. Plasticity of cortical excitatory-inhibitory balance. Annu Rev Neurosci 2015; 38: 195–219. - PMC - PubMed
    1. Klausberger T, Somogyi P. Neuronal diversity and temporal dynamics: the unity of hippocampal circuit operations. Science 2008; 321: 53–57. - PMC - PubMed
    1. Sohal VS, Zhang F, Yizhar O, Deisseroth K. Parvalbumin neurons and gamma rhythms enhance cortical circuit performance. Nature 2009; 459: 698–702. - PMC - PubMed
    1. Cardin JA, Carlen M, Meletis K, Knoblich U, Zhang F, Deisseroth K et al. Driving fast-spiking cells induces gamma rhythm and controls sensory responses. Nature 2009; 459: 663–667. - PMC - PubMed
    1. Wulff P, Ponomarenko AA, Bartos M, Korotkova TM, Fuchs EC, Bahner F et al. Hippocampal theta rhythm and its coupling with gamma oscillations require fast inhibition onto parvalbumin-positive interneurons. Proc Natl Acad Sci USA 2009; 106: 3561–3566. - PMC - PubMed

Publication types

MeSH terms

LinkOut - more resources