. 2017 Mar 7;12(3):e0173428.
doi: 10.1371/journal.pone.0173428. eCollection 2017.

Changes in diagnosed diabetes, obesity, and physical inactivity prevalence in US counties, 2004-2012

Affiliations

Changes in diagnosed diabetes, obesity, and physical inactivity prevalence in US counties, 2004-2012

Linda S Geiss et al. PLoS One. .

Abstract

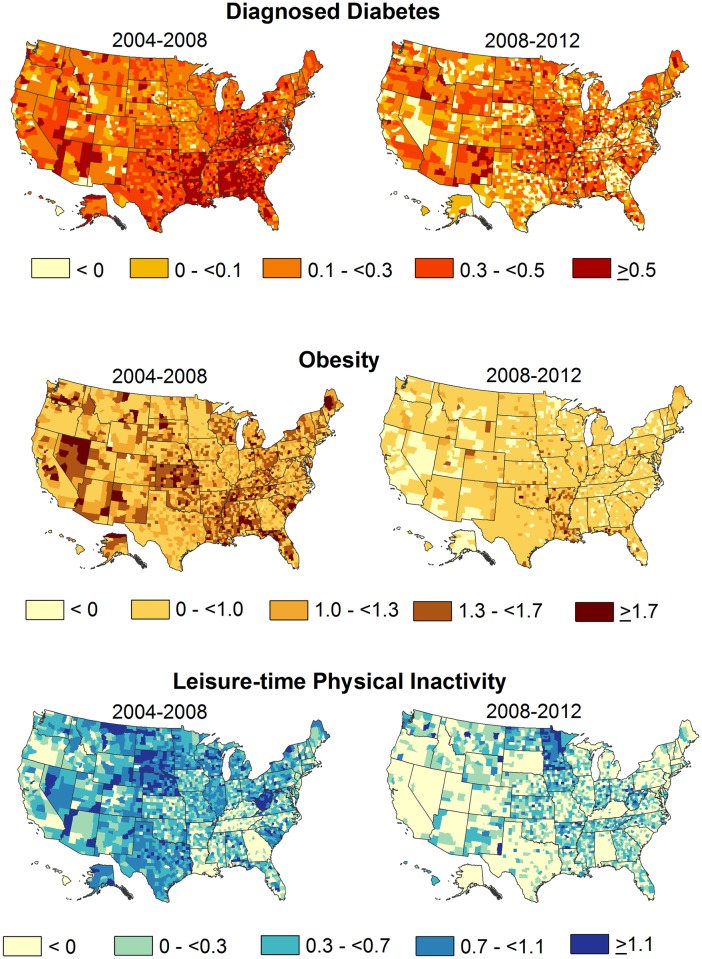
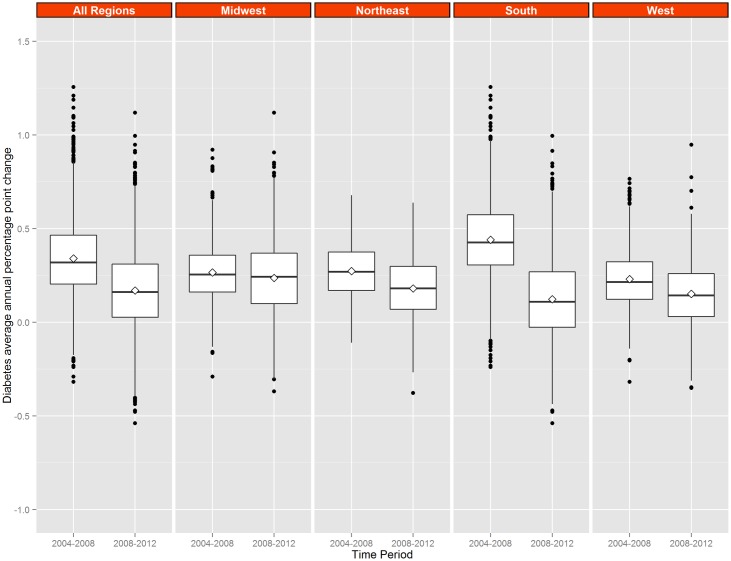
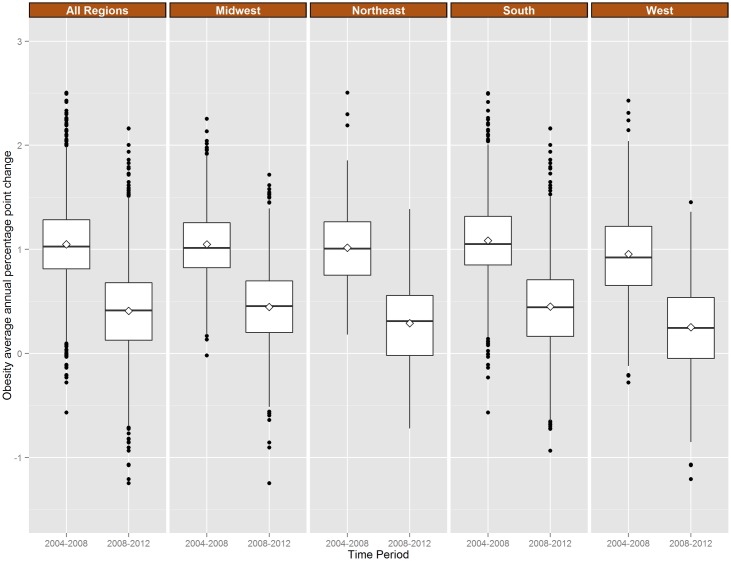
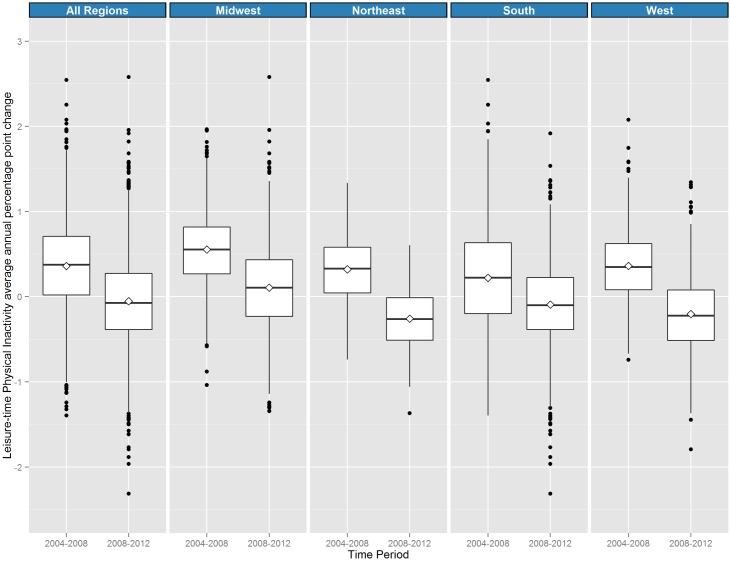
Recent studies suggest that prevalence of diagnosed diabetes in the United States reached a plateau or slowed around 2008, and that this change coincided with obesity plateaus and increases in physical activity. However, national estimates can obscure important variations in geographic subgroups. We examine whether a slowing or leveling off in diagnosed diabetes, obesity, and leisure time physical inactivity prevalence is also evident across the 3143 counties of the United States. We used publicly available county estimates of the age-adjusted prevalence of diagnosed diabetes, obesity, and leisure-time physical inactivity, which were generated by the Centers for Disease Control and Prevention (CDC). Using a Bayesian multilevel regression that included random effects by county and year and applied cubic splines to smooth these estimates over time, we estimated the average annual percentage point change (APPC) from 2004 to 2008 and from 2008 to 2012 for diabetes, obesity, and physical inactivity prevalence in each county. Compared to 2004-2008, the median APPCs for diabetes, obesity, and physical inactivity were lower in 2008-2012 (diabetes APPC difference = 0.16, 95%CI 0.14, 0.18; obesity APPC difference = 0.65, 95%CI 0.59, 0.70; physical inactivity APPC difference = 0.43, 95%CI 0.37, 0.48). APPCs and APPC differences between time periods varied among counties and U.S. regions. Despite improvements, levels of these risk factors remained high with most counties merely slowing rather than reversing, which suggests that all counties would likely benefit from reductions in these risk factors. The diversity of trajectories in the prevalence of these risk factors across counties underscores the continued need to identify high risk areas and populations for preventive interventions. Awareness of how these factors are changing might assist local policy makers in targeting and tracking the impact of efforts to reduce diabetes, obesity and physical inactivity.


Conflict of interest statement

Competing Interests: The authors have declared that no competing interests exist. KK’s affiliation with Northrop Grumman does not alter our adherence to PLOS ONE policies on sharing data and/or materials.

Figures

Fig 1
Fig 1. Average Annual Percentage Point Change (AAPC) in diagnosed diabetes, obesity, and physical inactivity prevalence, US counties, 2004–2008 and 2008–2012.
Fig 2
Fig 2. Distribution of county average Annual Percentage Point Change (APPC) in diagnosed diabetes, by Census region, 2004–2008 and 2008–2012.
Northeast region includes Connecticut, Maine, Massachusetts, New Hampshire, New Jersey, New York, Rhode Island, Vermont, and Pennsylvania; Midwest region includes Illinois, Indiana, Iowa, Kansas, Michigan, Minnesota, Missouri, Nebraska, North Dakota, Ohio, South Dakota, and Wisconsin; South region includes Alabama, Arkansas, Delaware, District of Columbia, Florida, Georgia, Kentucky, Louisiana, Maryland, Mississippi, North Carolina, Oklahoma, South Carolina, Tennessee, Texas, Virginia, and West Virginia. The West region includes Arizona, Colorado, Idaho, Montana, Nevada, New Mexico, Utah, Wyoming, Alaska, California, Hawaii, Oregon, and Washington.
Fig 3
Fig 3. Distribution of county average Annual Percentage Point Change (APPC) in diagnosed obesity, by Census region, 2004–2008 and 2008–2012.
Northeast region includes Connecticut, Maine, Massachusetts, New Hampshire, New Jersey, New York, Rhode Island, Vermont, and Pennsylvania; Midwest region includes Illinois, Indiana, Iowa, Kansas, Michigan, Minnesota, Missouri, Nebraska, North Dakota, Ohio, South Dakota, and Wisconsin; South region includes Alabama, Arkansas, Delaware, District of Columbia, Florida, Georgia, Kentucky, Louisiana, Maryland, Mississippi, North Carolina, Oklahoma, South Carolina, Tennessee, Texas, Virginia, and West Virginia. The West region includes Arizona, Colorado, Idaho, Montana, Nevada, New Mexico, Utah, Wyoming, Alaska, California, Hawaii, Oregon, and Washington.
Fig 4
Fig 4. Distribution of county average Annual Percentage Point Change (APPC) in physical inactivity prevalence, by Census region, 2004–2008 and 2008–2012.
Northeast region includes Connecticut, Maine, Massachusetts, New Hampshire, New Jersey, New York, Rhode Island, Vermont, and Pennsylvania; Midwest region includes Illinois, Indiana, Iowa, Kansas, Michigan, Minnesota, Missouri, Nebraska, North Dakota, Ohio, South Dakota, and Wisconsin; South region includes Alabama, Arkansas, Delaware, District of Columbia, Florida, Georgia, Kentucky, Louisiana, Maryland, Mississippi, North Carolina, Oklahoma, South Carolina, Tennessee, Texas, Virginia, and West Virginia. The West region includes Arizona, Colorado, Idaho, Montana, Nevada, New Mexico, Utah, Wyoming, Alaska, California, Hawaii, Oregon, and Washington.

References

    1. Geiss LS, Wang J, Cheng YJ, Thompson TJ, Barker L, Li Y, et al. Prevalence and incidence trends for diagnosed diabetes among adults aged 20 to 79 years, United States, 1980–2012. JAMA. 2014;312(12):1218–26. Epub 2014/09/24. 10.1001/jama.2014.11494 - DOI - PubMed
    1. Menke A, Casagrande S, Geiss L, Cowie CC. Prevalence of and Trends in Diabetes Among Adults in the United States, 1988–2012. JAMA. 2015;314(10):1021–9. Epub 2015/09/09. 10.1001/jama.2015.10029 - DOI - PubMed
    1. Centers for Disease Control and Prevention. National Diabetes Surveillance System 2012 [cited 2012 12/10/2012]. www.cdc.gov/diabetes/statistics.
    1. Flegal KM, Carroll MD, Kit BK, Ogden CL. Prevalence of obesity and trends in the distribution of body mass index among US adults, 1999–2010. JAMA. 2012;307(5):491–7. Epub 2012/01/19. 10.1001/jama.2012.39 - DOI - PubMed
    1. Ogden CL, Carroll MD, Kit BK, Flegal KM. Prevalence of obesity among adults: United States, 2011–2012. NCHS data brief. 2013;(131):1–8. Epub 2013/10/25. - PubMed

Publication types