Integrative Spatial Data Analytics for Public Health Studies of New York State
- PMID: 28269834
- PMCID: PMC5333201
Integrative Spatial Data Analytics for Public Health Studies of New York State
Abstract
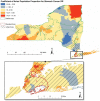
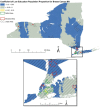
Increased accessibility of health data made available by the government provides unique opportunity for spatial analytics with much higher resolution to discover patterns of diseases, and their correlation with spatial impact indicators. This paper demonstrated our vision of integrative spatial analytics for public health by linking the New York Cancer Mapping Dataset with datasets containing potential spatial impact indicators. We performed spatial based discovery of disease patterns and variations across New York State, and identify potential correlations between diseases and demographic, socio-economic and environmental indicators. Our methods were validated by three correlation studies: the correlation between stomach cancer and Asian race, the correlation between breast cancer and high education population, and the correlation between lung cancer and air toxics. Our work will allow public health researchers, government officials or other practitioners to adequately identify, analyze, and monitor health problems at the community or neighborhood level for New York State.
Figures


Similar articles
-
Public domain small-area cancer incidence data for New York State, 2005-2009.Geospat Health. 2016 Apr 18;11(1):304. doi: 10.4081/gh.2016.304. Geospat Health. 2016. PMID: 27087033 Free PMC article.
-
Extended follow-up and spatial analysis of the American Cancer Society study linking particulate air pollution and mortality.Res Rep Health Eff Inst. 2009 May;(140):5-114; discussion 115-36. Res Rep Health Eff Inst. 2009. PMID: 19627030
-
Linking air pollution data and adverse birth outcomes: environmental public health tracking in New York State.J Public Health Manag Pract. 2015 Mar-Apr;21 Suppl 2:S68-74. doi: 10.1097/PHH.0000000000000171. J Public Health Manag Pract. 2015. PMID: 25621449
-
Evidence-Based Conceptual Collection of Methods for Spatial Epidemiology and Analysis to Enhance Cancer Surveillance and Public Health.Int J Environ Res Public Health. 2022 Oct 6;19(19):12765. doi: 10.3390/ijerph191912765. Int J Environ Res Public Health. 2022. PMID: 36232065 Free PMC article. Review.
-
Epidemiology of cancer in the United States.Prim Care. 1992 Sep;19(3):419-41. Prim Care. 1992. PMID: 1410056 Review.
Cited by
-
Mining co-occurrence and sequence patterns from cancer diagnoses in New York State.PLoS One. 2018 Apr 26;13(4):e0194407. doi: 10.1371/journal.pone.0194407. eCollection 2018. PLoS One. 2018. PMID: 29698405 Free PMC article.
-
Public and Population Health Informatics: The Bridging of Big Data to Benefit Communities.Yearb Med Inform. 2018 Aug;27(1):199-206. doi: 10.1055/s-0038-1667081. Epub 2018 Aug 29. Yearb Med Inform. 2018. PMID: 30157524 Free PMC article. Review.
-
Spatio-temporal Analysis for New York State SPARCS Data.AMIA Jt Summits Transl Sci Proc. 2017 Jul 26;2017:483-492. eCollection 2017. AMIA Jt Summits Transl Sci Proc. 2017. PMID: 28815148 Free PMC article.
-
Amplifying Domain Expertise in Clinical Data Pipelines.JMIR Med Inform. 2020 Nov 5;8(11):e19612. doi: 10.2196/19612. JMIR Med Inform. 2020. PMID: 33151150 Free PMC article.
References
-
- Environmental Facilities and Cancer Mapping [Internet] Health.ny.gov. 2016 [cited 9 March 2016]. Available from: https://www.health.ny.gov/statistics/cancer/environmental_facilities/map...
-
- Statewide Planning and Research Cooperative System [Internet] Health.ny.gov. 2016 [cited 9 March 2016]. Available from: https://www.health.ny.gov/statistics/sparcs/
-
- Dijkstra A, Janssen F, De Bakker M, Bos J, Lub R, Van Wissen LJ, Hak E. Using spatial analysis to predict health care use at the local level: a case study of type 2 diabetes medication use and its association with demograpHic change and socioeconomic status. PloS one. 2013 Aug 30;8(8):e72730. - PMC - PubMed
-
- Kauhl B, Heil J, Hoebe CJ, Schweikart J, Krafft T, Dukers-Muijrers NH. The Spatial Distribution of Hepatitis C Virus Infections and Associated Indicators—An Application of a Geographically Weighted Poisson Regression for Evidence-Based Screening Interventions in Hotspots. PloS one. 2015 Sep 9;10(9):e0135656. - PMC - PubMed
MeSH terms
LinkOut - more resources
Full Text Sources
