. 2017 Mar 7;16(1):55.
doi: 10.1186/s12943-017-0626-7.

MDM4 actively restrains cytoplasmic mTORC1 by sensing nutrient availability

Affiliations

MDM4 actively restrains cytoplasmic mTORC1 by sensing nutrient availability

Francesca Mancini et al. Mol Cancer. .

Abstract

Background: Many tumor-related factors have shown the ability to affect metabolic pathways by paving the way for cancer-specific metabolic features. Here, we investigate the regulation of mTORC1 by MDM4, a p53-inhibitor with oncogenic or anti-survival activities depending on cell growth conditions.

Method: MDM4-mTOR relationship was analysed through experiments of overexpression or silencing of endogenous proteins in cell culture and using purified proteins in vitro. Data were further confirmed in vivo using a transgenic mouse model overexpressing MDM4. Additionally, the Cancer Genome Atlas (TCGA) database (N = 356) was adopted to analyze the correlation between MDM4 and mTOR levels and 3D cultures were used to analyse the p53-independent activity of MDM4.

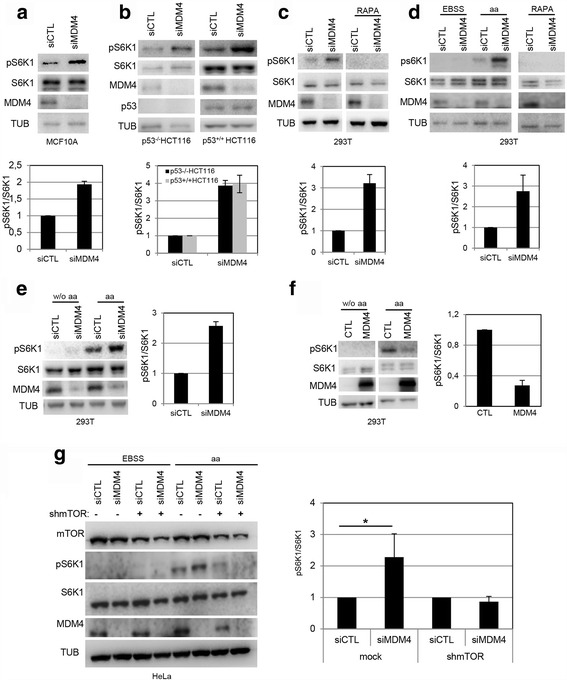
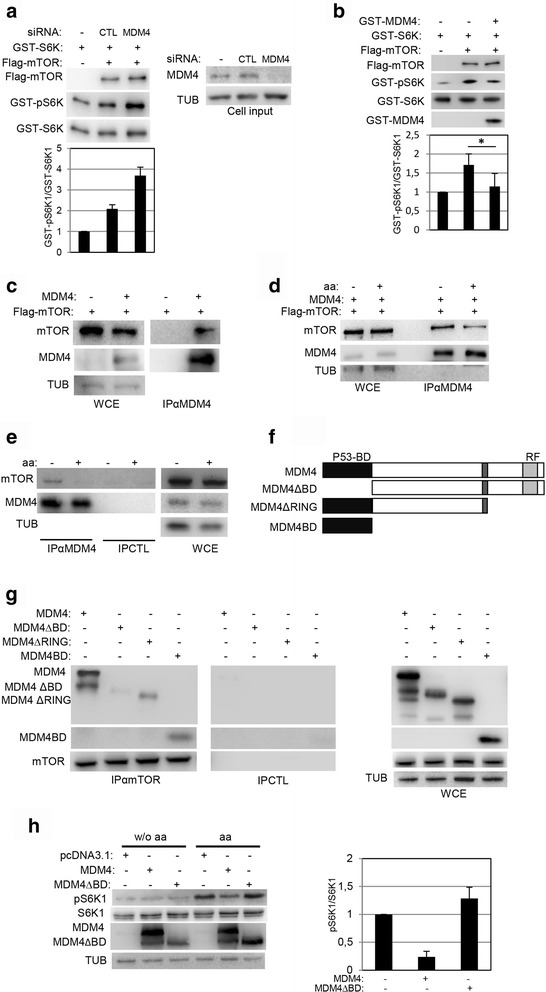
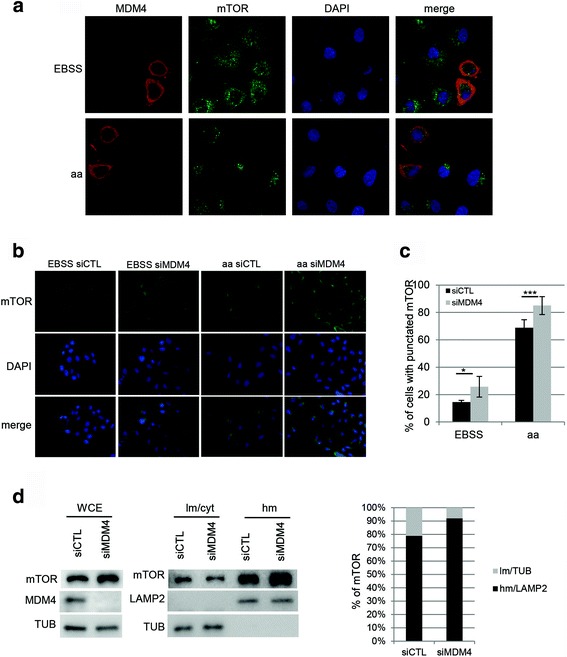
Results: Following nutrient deprivation, MDM4 impairs mTORC1 activity by binding and inhibiting the kinase mTOR, and contributing to maintain the cytosolic inactive pool of mTORC1. This function is independent of p53. Inhibition of mTORC1 by MDM4 results in reduced phosphorylation of the mTOR downstream target p70S6K1 both in vitro and in vivo in a MDM4-transgenic mouse. Consistently, MDM4 reduces cell size and proliferation, two features controlled by p70S6K1, and, importantly, inhibits mTORC1-mediated mammosphere formation. Noteworthy, MDM4 transcript levels are significantly reduced in breast tumors characterized by high mTOR levels.

Conclusion: Overall, these data identify MDM4 as a nutrient-sensor able to inhibit mTORC1 and highlight its metabolism-related tumor-suppressing function.

Keywords: Aminoacid; MDM4; Nutrient deprivation; mTOR; p53.


Figures

Fig 1
Fig 1
MDM4 inhibits S6K1 phosphorylation. a Representative Wb analysis of the indicated proteins in MCF10A cells transfected with siCTL or siMDM4 and collected after 48 h (hrs). Histogram in the lower panel shows the ratio of densitometric values of phosphorylated S6K1 (pS6K1) to S6K1. The ratio pS6K1/S6K1 from siCTL lane was arbitrarily set to 1. Mean ± SD of two independent biological replicates is shown (N = 2). b Wb analysis of the indicated proteins in p53−/−HCT116 and p53+/+HCT116 cells transfected as in (a). Histogram as in (a) (N = 2). c Wb analysis of the indicated proteins in 293 T cells transfected with siMDM4 or siCTL and after 24 h treated with Rapamycin (RAPA, 40nM) for additional 24 h. Histogram as in (a) (N = 2). d Wb analysis of the indicated proteins in 293 T cells transfected as in (c) and after 48 h treated with EBSS for 50’ and then in presence or absence of amino acids mixture (aa) for 30’, or with RAPA for 1 h. Histogram as in (a) (N = 2). e Wb analysis of the indicated proteins in 293 T cells transfected as in (c). After 48 h, cells were grown in medium deprived of amino acids (w/o aa) for 3 h, and in absence or presence of aa for the last 10’. Histogram as in (a) (N = 2). f Wb analysis of the indicated proteins in 293 T cells transfected with pcDNA3.1-MDM4 (MDM4) or control vector (CTL) and after 24 h treated as in (e) (the two panels derive from the same blot). Histogram as in (a). The ratio pS6K1/S6K1 from CTL lane was arbitrarily set to 1 (N = 2). g Wb analysis of the indicated proteins in Hela cells transfected with siMDM4 or siCTL and with shcontrol vector (Mock) or shmTOR for 48 h, then treated with EBSS for 50’, and for additional 30’ with aa. Histogram as in (a). (N = 3, * = p < 0.05, two‐tailed unpaired t‐test)
Fig 2
Fig 2
a Wb analysis of the indicated proteins in p53 −/− MEFs and p53 −/− Mdm4 −/−MEFs treated with EBSS for 50’ and then with complete growth medium (CM) for the indicated time points. Histogram reports the ratio of densitometric values of phosphorylated S6K1 (pS6K1) to S6K1. The ratio pS6K1/S6K1 from p53 −/− MEFs lane at 30’ was arbitrarily set to 1. Mean ± SD of two independent biological replicates is shown (N = 2). b Wb analysis of the indicated proteins in the liver from four control mice (WT) and four MDM4 transgenic mice (TG) treated with saline solution (−) or Leucine (+) (Leu, 120 mg/kg). Histogram as in (a) The ratio pS6K1/S6K1 from wt (CTL) untreated sample was arbitrarly set to 1. Mean ± SD is shown (N = 4) (* = p < 0.05, two‐tailed unpaired t‐test)
Fig 3
Fig 3
MDM4 binds and inhibits mTOR kinase activity. a Wb analysis of indicated proteins used for in vitro kinase assay (left panel). Flag-mTOR and GST-S6K were overexpressed an purified from HeLa cells. Right panel shows the levels of MDM4 in the cell input used for the in vitro kinase assay. Histogram in the lower panel shows the ratio of densitometric values of pS6K1 to S6K1. The ratio of pS6K1/S6K1 from siCTL lane was arbitrarily set to 1. Mean ± SD of two independent biological replicates is shown. b Wb analysis of the indicated proteins from in vitro kinase assay. Immunoprecipitated Flag-mTOR and GST-p70S6K1 (GST-S6K) were incubated with GST-MDM4 (purified from bacteria) for 10’ before the kinase assay. Histogram reports data as in (a) (N = 4) c Wb of indicated protein in co-immunocomplexes from HeLa cells transfected with the indicated plasmids. 500 μg of whole cell extract (WCE) was immunoprecipitated with anti-MDM4 antibody C82 (IPαMDM4, left panel). Right panel shows analysis of 1/10 of WCE. d Wb of indicated protein in co-immunocomplexes from HeLa cells transfected as in (c) and after 24 h grown in EBSS (−) for 1 h and then in absence or presence of the aa for additional 15’. e Wb of indicated protein in co-immunocomplexes from HeLa cells grown in EBSS for 50’ (−) and then in absence or presence of the aa for additional 15’. 1 mg of WCE was immunoprecipitated with anti-MDM4 antibody C82 (IPαMDM4) or Ig control (IPCTL). Right panel shows analysis of 1/15 of WCE. f Scheme of MDM4 deletion mutants. P53-BD means p53-binding domain, RF Ring Finger domain. g Wb of indicated protein in co-immunocomplexes from 293 T cells transfected with the indicated plasmids. 500 μg of WCE were immunoprecipitated with anti-mTOR antibody (IPαmTOR) or control Ig (IPCTL). Right panel shows the analysis of 1/10 of WCE. h Wb analysis of the indicated proteins in 293 T cells transfected with the indicated plasmids. After 48 h cells were grown in the medium without aa for 3 h and then in absence (w/o aa) or presence of aa for the last 15’. Histogram as in (a) (N = 2)
Fig 4
Fig 4
MDM4 interacts with cytoplasmic mTOR. a Representative pictures of immunofluorescence of HeLa cells transiently transfected with MDM4 and after 24 h treated with EBSS for 50’ and with aa for the last 15’. Endogenous mTOR is stained in green, MDM4 in red. DNA in blue (by DAPI). Merge shows the overlap of the signals. b Representative pictures of immunofluorescence of HeLa cells transfected with siCTL or siMDM4 and after 48 h treated with EBSS for 50’ and with aa for the last 15’. Endogenous mTOR is stained in green, DNA in blue (by DAPI). Merge shows the overlap of the signals. c Percentage of cells showing mTOR punctuated staining. Mean ± SD of three independent biological replicates is shown (** = p < 0.01; *** = p < 0.001 two‐tailed unpaired t‐test). d Wb analysis of the indicated proteins in HeLa cells transfected with siMDM4 or siCTL. After 48 h, cell lysates were fractionated in light membrane/cytosol (lm/cyt) and heavy membrane (hm) fractions. Left panel shows WCE. Histogram shows the percentage (%) of mTOR signal in the lm (light bar) and hm (black bar) fractions corrected for the respective loading control. mTOR signal in the lm + hm fractions was arbitrarily set to 100%
Fig 5
Fig 5
MDM4 regulates cell size and cell proliferation in a mTOR-dependent manner. a, b Forward scatter analysis (FSC-H) of p53−/−HCT116, p53+/+HCT116 (a) and MCF10A cells (b) transfected with siMDM4 or siCTL and after for 48 h analysed by flow cytometry. Mean ± SD of three independent biological replicates is shown (N = 3). c FSC-H of p53 −/−MEFs and p53 −/− Mdm4 −/−MEFs (N = 3). d FSC-H of 293 T cells transfected with siMDM4 or siCTL and after 24 h treated with RAPA (40nM) for additional 24 h (N = 3). e Cell viability by Cell Titer Blue colorimetric assay of 293 T cells treated as in (d) (N = 3). f Evaluation of viable cells by Trypan blue in 293 T cells transfected with siMDM4 or siCTL and after 24 h treated with RAPA or transfected with siS6K1 for additional 24 h (N = 3, * = p < 0.05, ** = p < 0.01, two‐tailed unpaired t‐test)
Fig 6
Fig 6
MDM4 regulates cell tumor cell growth . a, b Linear regression analysis between mTOR and MDM4 mRNA expression levels in Atlas breast cancer primary tumors characterized by mutated p53 (N = 151, R 2 = 0,11) or wild type p53 (wt TP53) (N = 375, R 2 = 0,02). c Wb analysis of the indicated proteins in MDA-MB-231 cells transfected with siMDM4 or siCTL and collected after 48 h. d Representative pictures of mammosphere formation in MDA-MB-231 treated as indicated in (c). e Quantification of mammosphere treated as in (d). Mean ± SD of three independent biological replicates is shown (* = p < 0.05 two‐tailed unpaired t‐test)

References

    1. Lenos K, Jochemsen AG. Functions of MDMX in the modulation of the p53-response. J Biomed Biotechnol. 2011;2011:876173. doi: 10.1155/2011/876173. - DOI - PMC - PubMed
    1. Marine JC, Francoz S, Maetens M, Wahl G, Toledo F, Lozano G. Keeping p53 in check: essential and synergistic functions of Mdm2 and Mdm4. Cell Death Differ. 2006;13:927–934. doi: 10.1038/sj.cdd.4401912. - DOI - PubMed
    1. Pant V, Xiong S, Iwakuma T, Quintas-Cardama A, Lozano G. Heterodimerization of Mdm2 and Mdm4 is critical for regulating p53 activity during embryogenesis but dispensable for p53 and Mdm2 stability. Proc Natl Acad Sci U S A. 2011;108:11995–12000. doi: 10.1073/pnas.1102241108. - DOI - PMC - PubMed
    1. Shadfan M, Lopez-Pajares V, Yuan ZM. MDM2 and MDMX: alone and together in regulation of p53. Transl Cancer Res. 2012;1:88–89. - PMC - PubMed
    1. Xiong S, Pant V, Suh YA, Van Pelt CS, Wang Y, Valentin-Vega YA, Post SM, Lozano G. Spontaneous tumorigenesis in mice overexpressing the p53-negative regulator Mdm4. Cancer Res. 2010;70:7148–7154. doi: 10.1158/0008-5472.CAN-10-1457. - DOI - PMC - PubMed

MeSH terms

Substances