. 2017 Mar 7;12(1):24.
doi: 10.1186/s13024-017-0167-y.

Blood cholesterol in late-life and cognitive decline: a longitudinal study of the Chinese elderly

Affiliations

Blood cholesterol in late-life and cognitive decline: a longitudinal study of the Chinese elderly

Chaoran Ma et al. Mol Neurodegener. .

Abstract

Background: Previous studies regarding the lipid-cognition relation in older adults are limited and have generated mixed results. We thus examined whether higher blood cholesterol concentrations were associated with faster cognitive decline in a community-based longitudinal study of Chinese elderly.

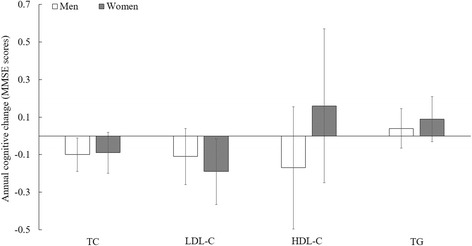
Methods: The study included 1,159 Chinese adults aged over 60 years (women: 48.7%, mean age: 79.4 years), who were free of dementia, Parkinson disease and stroke at the baseline. Blood concentrations of total cholesterol (TC), high-density lipoprotein cholesterol (HDL-C), low-density lipoprotein cholesterol (LDL-C), and triglycerides (TG), were assessed at the baseline. Global cognitive functions were assessed using the Chinese Mini-Mental State Examination (MMSE) at in 2009, 2012 and 2014. Association between blood cholesterol and repeated cognitive function was analyzed with linear mixed models, adjusting for sociodemographic information, behavior and lifestyle, depression symptoms, physical examination, hypertension, and laboratory indexes.

Results: Higher baseline TC and LDL-C concentrations were significantly associated with greater cognitive decline. Adjusted mean difference in cognitive decline rate, comparing two extreme quartiles, was 0.28 points (MMSE score) per year (95% confident interval (CI): -0.54,-0.02; P-trend = 0.005) for TC and 0.42 points per year (95% CI: -0.69, -0.16; P-trend = 0.006) for LDL-C. In a subgroup analysis, the associations between all lipids and cognitive decline appeared to be more pronounced among individuals aged 100 years or older (n = 90), relative to others.

Conclusions: Higher blood concentrations of TC and LDL-C in late-life were associated with faster global cognitive decline.

Keywords: Cognitive function; Lipid; MMSE.


Figures

Fig. 1
Fig. 1
Mean difference in annual cognitive change for each mmol/L increment of lipid concentrations, stratified by age a. Abbreviation: TC = total cholesterol; LDL-C = low density lipoprotein cholesterol; HDL-C = high density lipoprotein cholesterol; TG = triglyceride. P interaction > 0.50 for all, suggesting that the association between lipids and cognitive decline was not modified by age. aAdjusted for age, sex, education (illiteracy, 1–6 years, or ≥6 years), smoking status (non-smoker and smoker (0.7–20.4, 20.5–44.4, or 44.5–220 pack-year)), alcohol intake (non-drinker and drinker (0.4–2.11, 2.12–4.67, or 4.68–67.7 servings/d)), physical activities (yes/no), depression symptoms (yes/no), BMI (<17.5, 17.5–23.0, 23.0–27.9, or ≥28.0 kg/m2), waist circumference (50–73, 74–80, 81–88, or 89–155 cm), hypertension (yes/no), plasma glucose (0.15–3.93, 3.94–4.68, 4.69–5.41, or 5.42–36.04 mmol/L), C-reactive protein (<1, 1–2.9, or ≥3 mg/L) and uric acid (women: <240, 240–360, or ≥360; men: <240, 240–420, or ≥420 μmol/L)
Fig. 2
Fig. 2
Mean difference in annual cognitive change for each mmol/L increment of lipid concentrations, stratified by sex a. Abbreviation: TC = total cholesterol; LDL-C = low density lipoprotein cholesterol; HDL-C = high density lipoprotein cholesterol; TG = triglyceride.P interaction > 0.50 for all, suggesting that the association between lipids and cognitive decline was not modified by sex. a Adjusted for age, sex, education (illiteracy, 1–6 years, or ≥6 years), smoking status (non-smoker and smoker (0.7–20.4, 20.5–44.4, or 44.5–220 pack-year)), alcohol intake (non-drinker and drinker (0.4–2.11, 2.12–4.67, or 4.68–67.7 servings/d)), physical activities (yes/no), depression symptoms (yes/no), BMI (<17.5, 17.5–23.0, 23.0–27.9, or ≥28.0 kg/m2), waist circumference (50–73, 74–80, 81–88, or 89–155 cm), hypertension (yes/no), plasma glucose (0.15–3.93, 3.94–4.68, 4.69–5.41, or 5.42–36.04 mmol/L), C-reactive protein (<1, 1–2.9, or ≥3 mg/L) and uric acid (women: <240, 240–360, or ≥360; men: <240, 240–420, or ≥420 μmol/L)

References

    1. Association As 2015 Alzheimer's disease facts and figures. Alzheimers Dement. 2015;11(3):332–84. doi: 10.1016/j.jalz.2015.02.003. - DOI - PubMed
    1. Roberts R, Knopman DS. Classification and epidemiology of MCI. Clin Geriatr Med. 2013;29(4):753–72. doi: 10.1016/j.cger.2013.07.003. - DOI - PMC - PubMed
    1. Rodriguez JL, Ferri CP, Acosta D, Guerra M, Huang Y, Jacob KS, et al. Prevalence of dementia in Latin America, India, and China: a population-based cross-sectional survey. Lancet. 2008;372(9637):464–74. doi: 10.1016/S0140-6736(08)61002-8. - DOI - PMC - PubMed
    1. Kaffashian S, Dugravot A, Nabi H, Batty GD, Brunner E, Kivimäki M, et al. Predictive utility of the Framingham general cardiovascular disease risk profile for cognitive function evidence from the Whitehall II study. Eur Heart J. 2011;32(18):2326–32. doi: 10.1093/eurheartj/ehr133. - DOI - PMC - PubMed
    1. Kivipelto M, Helkala EL, Hänninen T, Laakso MP, Hallikainen M, Alhainen K, et al. Midlife vascular risk factors and late-life mild cognitive impairment A population-based study. Neurology. 2001;56(12):1683–9. doi: 10.1212/WNL.56.12.1683. - DOI - PubMed