. 2017 Feb 1;31(3):241-246.
doi: 10.1101/gad.292169.116.

Cbx3 maintains lineage specificity during neural differentiation

Affiliations

Cbx3 maintains lineage specificity during neural differentiation

Chengyang Huang et al. Genes Dev. .

Abstract

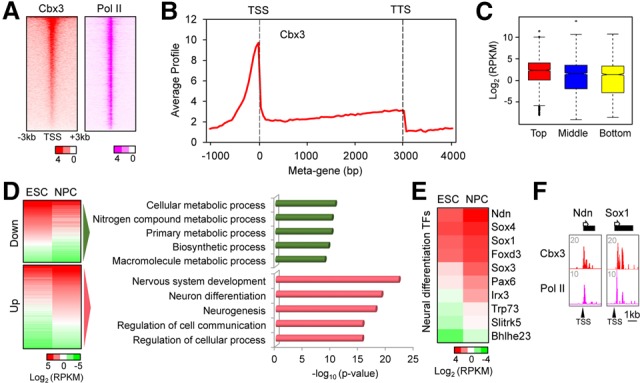
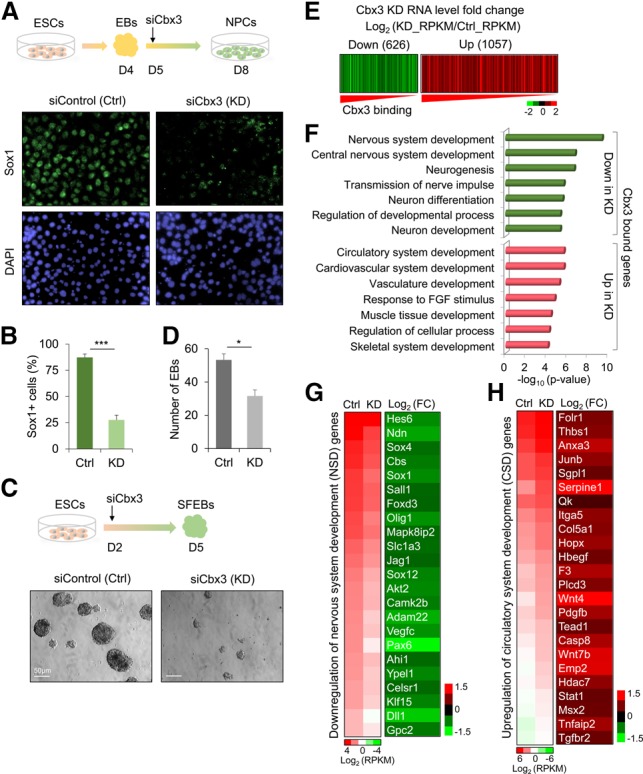
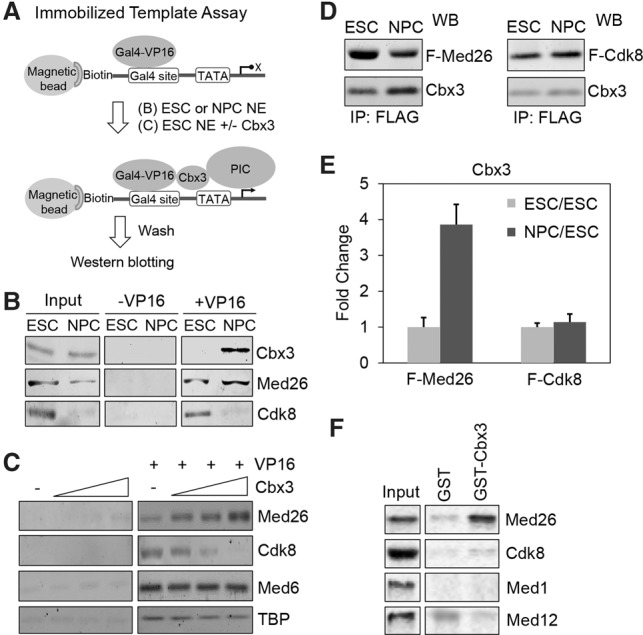
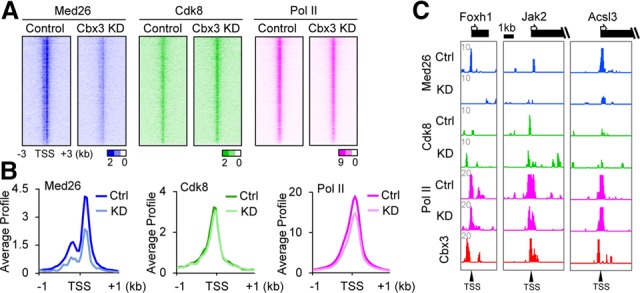
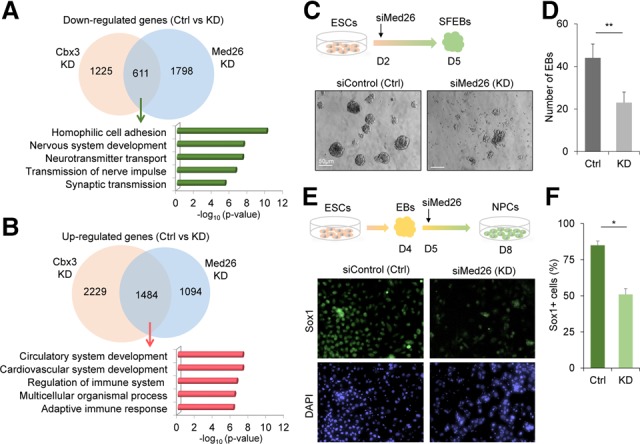
Chromobox homolog 3 (Cbx3/heterochromatin protein 1γ [HP1γ]) stimulates cell differentiation, but its mechanism is unknown. We found that Cbx3 binds to gene promoters upon differentiation of murine embryonic stem cells (ESCs) to neural progenitor cells (NPCs) and recruits the Mediator subunit Med26. RNAi knockdown of either Cbx3 or Med26 inhibits neural differentiation while up-regulating genes involved in mesodermal lineage decisions. Thus, Cbx3 and Med26 together ensure the fidelity of lineage specification by enhancing the expression of neural genes and down-regulating genes specific to alternative fates.

Keywords: Cbx3; Med26; embryonic stem cell; mesoderm; neural precursor; preinitiation complex.


Figures

Figure 1.
Figure 1.
Association of Cbx3 with promoters during neural differentiation. (A) Heat map of Cbx3 and Pol II enrichment at NPC promoters. P-values of enrichment were plotted and ranked by Cbx3. (B) Metagene profile of Cbx3 enrichment in NPCs. The Y-axis is the average signal from 50-base-pair windows. (C) Box plot of gene expression level in high (red), middle (blue), and bottom (yellow) Cbx3-bound genes. Log2 expression levels are reads per kilobase per million mapped reads (RPKM) from NPC RNA sequencing (RNA-seq) data. Bound genes contained Cbx3 within a ±1-kb region flanking the transcription start site (TSS). (D, left) Gene expression heat maps of Cbx3-bound and either down-regulated or up-regulated genes during differentiation from ESCs to NPCs. (Right) Gene ontology analysis for Cbx3-bound and down genes or up genes. Regulated genes displayed a >1.5-fold change in NPCs versus ESCs. (E) The RNA-seq heat map shows Cbx3-bound up-regulated neural differentiation transcription factors (TFs) from the term “nervous system development” in D. (F) Browser track examples of Cbx3 and Pol II cobound transcription factor promoters in NPCs.
Figure 2.
Figure 2.
Cbx3 knockdown decreases neural and up-regulates mesodermal gene expression. (A) Cbx3 knockdown (Cbx3 KD) inhibits Sox1+ NPC generation. (Top panel) EBs formed from ESCs in medium without leukemia-inhibiting factor (−LIF). On day 4, EBs were dissociated and plated with ITSF medium for monolayer NPC generation. One day after initiating monolayer differentiation, control siRNA or Cbx3 siRNAs were transfected. (Bottom panel) Sox1 immunostaining (green) in control or Cbx3 knockdown. DAPI (blue) marks nuclei. (B) Percentage of Sox1+ versus DAPI+ cells 72 h after siRNA. (***) P < 0.005, Student's t-test. (C) SFEB formation assay for ESC neural differentiation in control (Ctrl) and Cbx3 knockdown. EBs were formed in neural induction medium. On day 2 after induction, siControl or siCbx3 RNA was transfected; total EBs were determined on day 5. (D) Quantification of EBs 3 d after siRNA transfection. (*) P < 0.05, Student's t-test. (E) Heat map of Cbx3-bound and down-regulated (green; <1.5-fold) or up-regulated (red; >1.5-fold) genes in Cbx3 knockdown versus control cells. Log2 (KD_RPKM/Ctrl_RPKM) for RNA level fold changes was plotted and ranked by Cbx3 enrichment. (F) GO analysis for 626 down-regulated genes and 1057 up-regulated genes from E. (G) Heat maps display RNA level decreases and fold change (FC) for the term “nervous system development” in F. (H) Heat maps show RNA level increase and fold change for the term “circulatory system development” in F.
Figure 3.
Figure 3.
Cbx3 regulates recruitment of Med26 to the PIC in vitro. (A) Schematic of the immobilized template PIC capture assay using ESC or NPC nuclear extracts (NE) plus or minus Gal4-VP16 activator (see the Materials and Methods). (B) Recruitment of Cbx3, Med26, and Cdk8 in the ESC PIC or NPC PIC by Western blotting. (C). ESC nuclear extract was incubated with increasing amounts of purified Cbx3 in the immobilized template PIC capture assay. Western blots show Med26, Cdk8, Med6, and TBP recruitment. (D) Western blots (WB) comparing the amounts of Cbx3 from purified Flag-tagged Med26 (F-Med26) and Flag-tagged Cdk8 (F-Cdk8) in ESCs and NPCs. (E) Quantification of fold change of Cbx3 amounts in F-Med26 Mediator and F-Cdk8 Mediator during differentiation from ESCs to NPCs, respectively. (F) Binding of in vitro transcribed and translated 35S-labeled Med26, Cdk8, Med1, and Med12 to glutathione-sepharose bound GST-Cbx3 or GST.
Figure 4.
Figure 4.
Genome-wide analysis of Cbx3 knockdown on Med26 promoter binding. (A) Heat maps of Med26, Cdk8, and Pol II at promoters in control or Cbx3 knockdown cells. P-values of enrichment were plotted and ranked by Cbx3 enrichment near the TSS. (B) Average gene profiles of Med26, Cdk8, and Pol II in control or Cbx3 knockdown NPCs. ChIP-seq signals for average distributions were plotted by significant peaks ±1 kb around the TSS. P-values for differences between control and Cbx3 knockdown were P < 2.2 × 10⁻¹⁶, P = 4.67 × 10−05, and P < 2.2 × 10⁻¹⁶, calculated by Wilcoxon rank-sum test. (C) Browser tracks show examples of Med26-, Cdk8-, and Pol II-binding changes around TSSs of neural lineage genes.
Figure 5.
Figure 5.
Med26 is involved in Cbx3-regulated neural differentiation. (A,B) Venn diagrams of overlap between down-regulated (A) or up-regulated (B) genes upon Cbx3 or Med26 knockdown shown above GO analysis for overlapping genes. (C) EB formation assay for neural differentiation analysis upon Med26 knockdown. ESCs (1 × 10⁵ cells) were dissociated into single cells to form EBs in neural induction medium. On day 2 after induction, siRNA control or Med26 siRNA (Med26 knockdown) were transfected. The total number of EBs was determined on day 5. (D) Quantification of the EB number 72 h after siRNA treatments. (**) P < 0.01, Student's t-test. (E) Med26 knockdown inhibits Sox1+ NPC generation. On day 5 of differentiation, siControl or siMed26 was transfected into the cells. Immunostaining for Sox1+ cells was performed on day 8. (F) Quantification of percentage of Sox1-positive cells versus DAPI-positive cells for the immunostaining. (*) P < 0.05, Student's t-test.

References

    1. Allen BL, Taatjes DJ. 2015. The Mediator complex: a central integrator of transcription. Nat Rev Mol Cell Biol 16: 155–166. - PMC - PubMed
    1. Beard C, Hochedlinger K, Plath K, Wutz A, Jaenisch R. 2006. Efficient method to generate single-copy transgenic mice by site-specific integration in embryonic stem cells. Genesis 44: 23–28. - PubMed
    1. Brustle O, Spiro AC, Karram K, Choudhary K, Okabe S, McKay RD. 1997. In vitro-generated neural precursors participate in mammalian brain development. Proc Natl Acad Sci 94: 14809–14814. - PMC - PubMed
    1. Canzio D, Larson A, Narlikar GJ. 2014. Mechanisms of functional promiscuity by HP1 proteins. Trends Cell Biol 24: 377–386. - PMC - PubMed
    1. Chen XF, Lehmann L, Lin JJ, Vashisht A, Schmidt R, Ferrari R, Huang C, McKee R, Mosley A, Plath K, et al. 2012. Mediator and SAGA have distinct roles in Pol II preinitiation complex assembly and function. Cell Rep 2: 1061–1067. - PMC - PubMed

Publication types

MeSH terms