. 2017 Mar 29;37(13):3661-3670.
doi: 10.1523/JNEUROSCI.2390-16.2016. Epub 2017 Mar 7.

Saccadic Suppression Is Embedded Within Extended Oscillatory Modulation of Sensitivity

Affiliations

Saccadic Suppression Is Embedded Within Extended Oscillatory Modulation of Sensitivity

Alessandro Benedetto et al. J Neurosci. .

Abstract

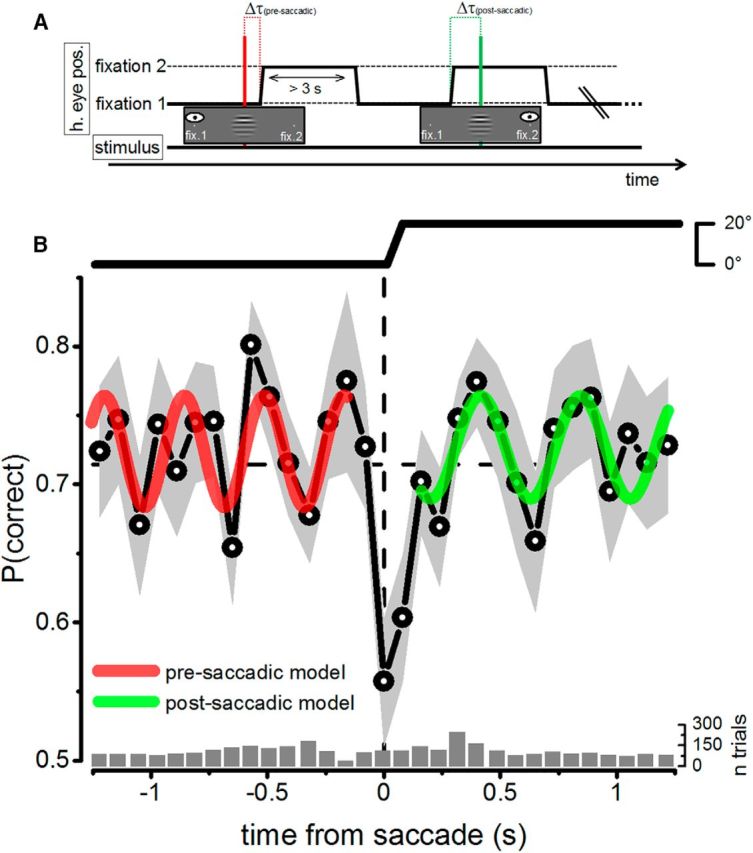
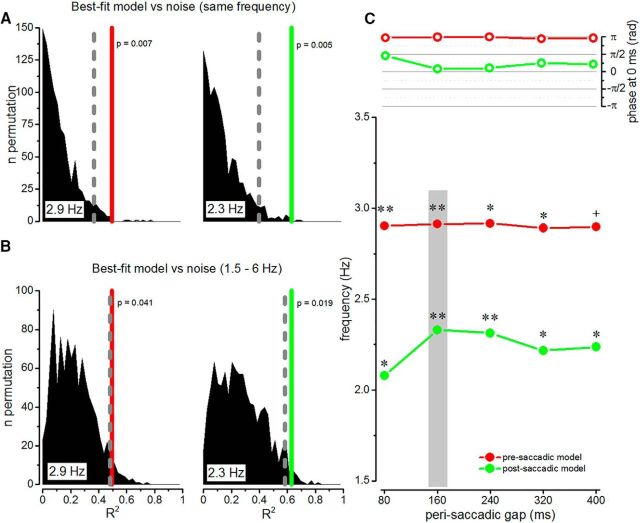
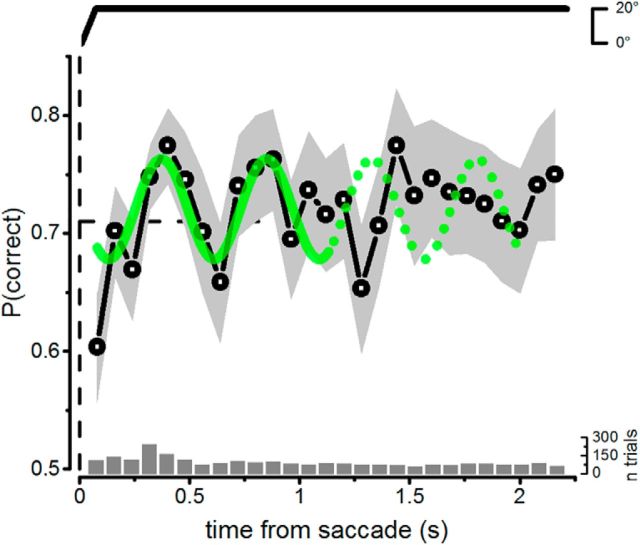
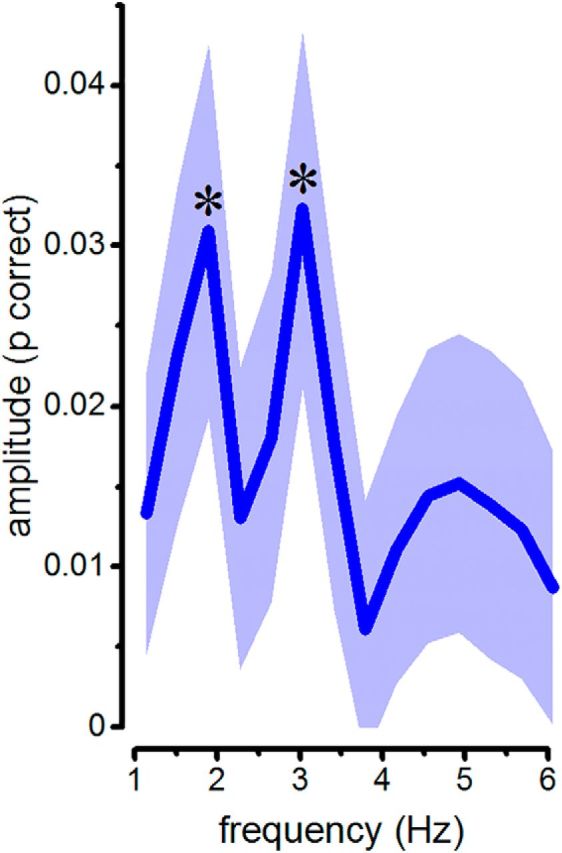
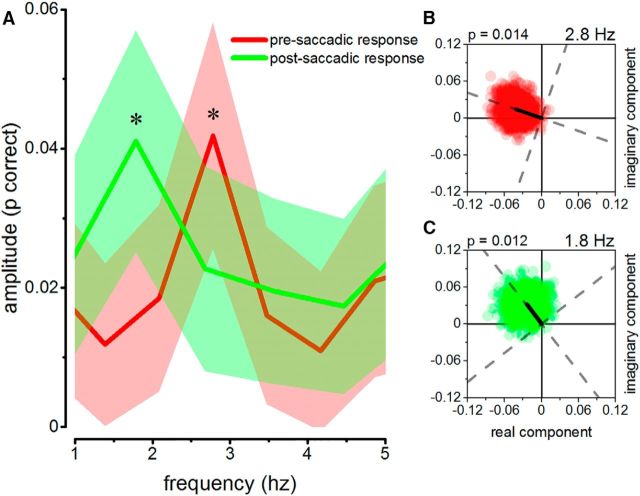
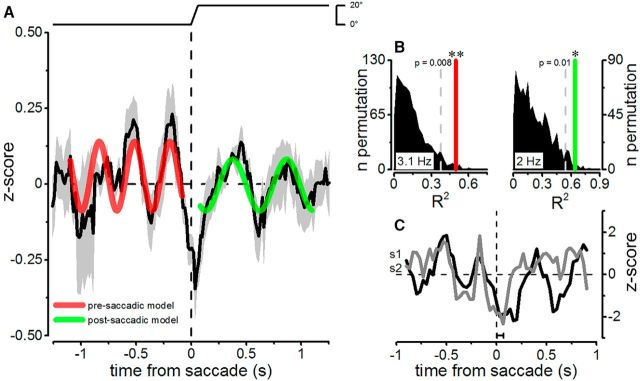
Action and perception are intimately coupled systems. One clear case is saccadic suppression, the reduced visibility around the time of saccades, which is important in mediating visual stability; another is the oscillatory modulation of visibility synchronized with hand action. To suppress effectively the spurious retinal motion generated by the eye movements, it is crucial that saccadic suppression and saccadic onset be temporally synchronous. However, the mechanisms that determine this temporal synchrony are unknown. We investigated the effect of saccades on contrast discrimination sensitivity over a long period stretching over >1 s before and after saccade execution. Human subjects made horizontal saccades at will to two stationary saccadic targets separated by 20°. At a random interval, a brief Gabor patch was displayed between the two fixations in either the upper or lower visual field and the subject had to detect its location. Strong saccadic suppression was measured between -50 and 50 ms from saccadic onset. However, the suppression was systematically embedded in a trough of oscillations of contrast sensitivity that fluctuated rhythmically in the delta range (at ∼3 Hz), commencing ∼1 s before saccade execution and lasting for up to 1 s after the saccade. The results show that saccadic preparation and visual sensitivity oscillations are coupled and the coupling might be instrumental in temporally aligning the initiation of the saccade with the visual suppression.SIGNIFICANCE STATEMENT Saccades are known to produce a suppression of contrast sensitivity at saccadic onset and an enhancement after saccadic offset. Here, we show that these dynamics are systematically embedded in visual oscillations of contrast sensitivity that fluctuate rhythmically in the delta range (at ∼3 Hz), commencing ∼1 s before saccade execution and lasting for up to 1 s after the saccade. The results show that saccadic preparation and visual sensitivity oscillations are coupled and the coupling might be instrumental in aligning temporally the initiation of the saccade with the visual suppression.

Keywords: action and perception; contrast sensitivity; eye movements; saccadic suppression; sensorimotor integration; visual oscillations.


Figures

Figure 1.
Figure 1.
A, Illustration of the experimental procedure. Participants performed saccades at their own pace to stationary saccadic targets (fixation 1 and fixation 2). At random delay from the saccadic onset (Δt), a brief Gabor stimulus with a contrast increment was presented in its upper or lower side and participants were asked to report the location of the increment. B, Presaccadic and postsaccadic contrast discrimination performance as a function of time from saccadic onset (aggregate observer, pooling together the single trial data of eight individual subjects). The bar plot shows the number of observations for each bin (106 ± 38). The gray area represents ±1 SEM from bootstrapping; thick lines represent the best sinusoidal fit to the data for presaccadic responses (in red at around 3 Hz) and for postsaccadic responses (in green at around 2 Hz). Dashed vertical and horizontal lines report the time from saccadic onset and the median probability of correct response, respectively. Top trace shows the mean horizontal eye position.
Figure 2.
Figure 2.
A, R2 distribution obtained by fitting the random shuffled data with the sinusoidal functions from Figure 1 with amplitude and phases as free parameters (perisaccadic gap set to 160 ms); thick lines mark the R2 for the presaccadic model (red, 2.9 Hz; p = 0.007) and the postsaccadic model (green, 2.3 Hz; p = 0.005). Dashed lines mark 0.95 probability; B, Same analysis as reported in A, but with an R2 permuted distribution obtained by best fitting the random shuffled data with frequency as a free parameter. The best fit was statistically higher than noise level for both presaccadic response (red, p = 0.041) and the postsaccadic response (green, p = 0.019). C, Best fitting frequency and phase of the aggregate data as function of different perisaccadic gaps Phase is calculated with respect to a 0 ms origin and is reported for a cosine function. Asterisks indicate significant points following the procedure in A (0.1 > + > 0.05 > * > 0.01 > ** > 0.001).
Figure 3.
Figure 3.
Postsaccadic contrast discrimination performance as function of delay from the onset of the previous saccade. The gray area represents ±1 SEM from bootstrapping; thick line represents the best sinusoidal fit of Figure 1B (green curves); dotted line shows that, after about the first second, the model does not fit the dataset well. Note that the first 1.5 s corresponds to the postsaccadic data of Figure 1. Data from saccades with latency <3 s are not included. Dashed vertical and horizontal lines report the time from saccadic onset and the median probability of correct response, respectively. Top trace is the mean horizontal eye position.
Figure 4.
Figure 4.
FFT spectral analysis for the aggregate observer. Amplitude spectra of the signal ±1 SEM are shown. The local maxima at 1.9 and 3 Hz are the only to reach statistical significance (1.9 Hz: p = 0.006; 3 Hz: p = 0.004). Asterisks indicate the significance after FDR correction (0.1 > + > 0.05 > * > 0.01).
Figure 5.
Figure 5.
A. FFT mean amplitude spectra ±1 SEM for presaccadic responses (red curves) and postsaccadic responses (green curve). B, C, 2D bootstrap analysis performed for the presaccadic response at 2.8 Hz (B, p = 0.014) and the postsaccadic response at 1.8 Hz (C, p = 0.012). The black vectors show the average amplitudes and phases at 2.8 and 1.8 Hz. The phases are calculated respect to 0 ms origin and reported for a cosine function. Asterisks indicate significance (0.1 > + > 0.05 > * > 0.01 > ** > 0.001).
Figure 6.
Figure 6.
Horizontal microsaccadic frequency and SEM as a function of time from saccadic onset for group-level data (n = 8) calculated in bin of 20 ms. The thick vertical line represents the saccadic onset, thin vertical lines delimit perisaccadic boundaries. The microsaccadic rate decays rapidly in the first 120 ms after saccadic onset, being nearly constant before and after saccadic execution. The top trace shows a mean horizontal eye position.
Figure 7.
Figure 7.
A, z-scores averaged across subjects (n = 8) as a function of delay from saccadic onset. The gray area represents ±1 SEM; thick lines represent the best sinusoidal fit to the data for presaccadic responses (in red at 3.1 Hz) and for postsaccadic responses (in green at 2 Hz). Dashed vertical and horizontal lines indicate the time from saccadic onset and the median probability of correct response, respectively. The top trace shows mean horizontal eye position. B, R2 distribution obtained by fitting the random shuffled data with the sinusoidal functions from A with amplitude and phases as free parameters. Dashed lines mark 0.95 probability; thick lines mark the R2 for the presaccadic model (left, 3.1 Hz, p = 0.008) and the postsaccadic model (right, 2 Hz, p = 0.01). Asterisks indicate significant points (0.05 > * > 0.01 > ** > 0.001). C, z-scores as a function of time from saccadic onset for two representative subjects.

References

    1. Ball T, Schreiber A, Feige B, Wagner M, Lücking CH, Kristeva-Feige R (1999) The role of higher-order motor areas in voluntary movement as revealed by high-resolution EEG and fMRI. Neuroimage 10:682–694. 10.1006/nimg.1999.0507 - DOI - PubMed
    1. Benedetto A, Spinelli D, Morrone MC (2016) Rhythmic modulation of visual contrast discrimination triggered by action. Proc Biol Sci 283: pii: 20160692. 10.1098/rspb.2016.0692 - DOI - PMC - PubMed
    1. Benjamini Y, Hochberg Y (1995) Controlling the false discovery rate: a practical and powerful approach to multiple testing. J R Stat Soc Ser B 57:289–300.
    1. Binda P, Cicchini GM, Burr DC, Morrone MC (2009) Spatiotemporal distortions of visual perception at the time of saccades. J Neurosci 29:13147–13157. 10.1523/JNEUROSCI.3723-09.2009 - DOI - PMC - PubMed
    1. Bosman CA, Womelsdorf T, Desimone R, Fries P (2009) A microsaccadic rhythm modulates gamma-band synchronization and behavior. J Neurosci 29:9471–9480. 10.1523/JNEUROSCI.1193-09.2009 - DOI - PMC - PubMed

Publication types

LinkOut - more resources