. 2017 Mar 21;114(12):3175-3180.
doi: 10.1073/pnas.1618088114. Epub 2017 Mar 7.

Phosphoproteins in extracellular vesicles as candidate markers for breast cancer

Affiliations

Phosphoproteins in extracellular vesicles as candidate markers for breast cancer

I-Hsuan Chen et al. Proc Natl Acad Sci U S A. .

Abstract

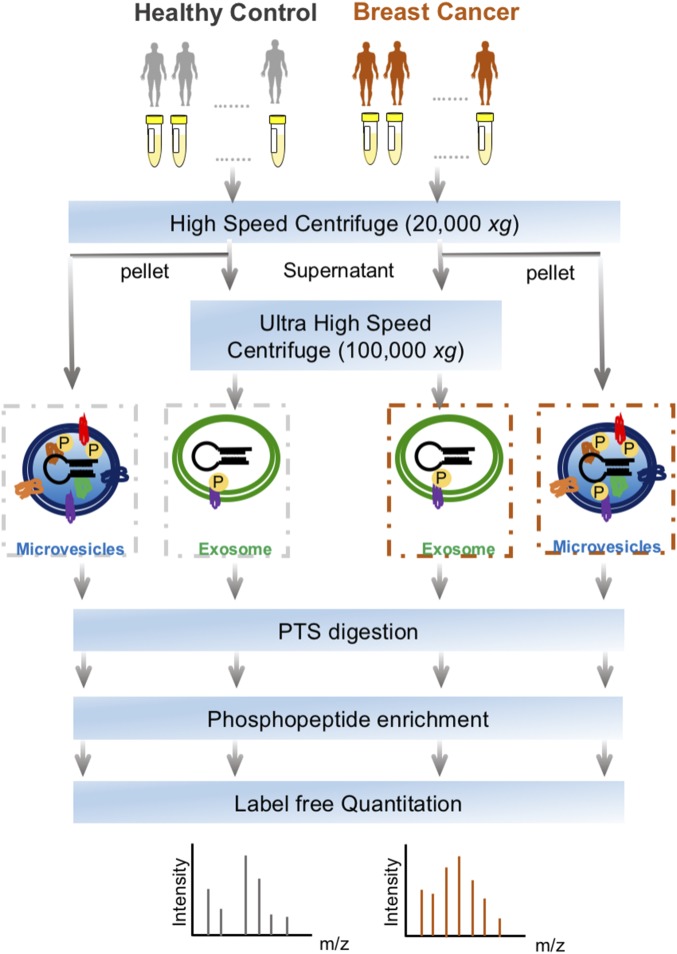
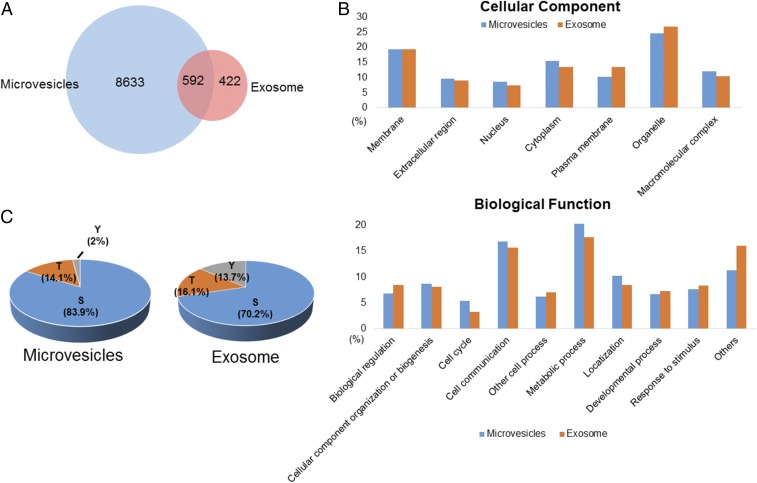
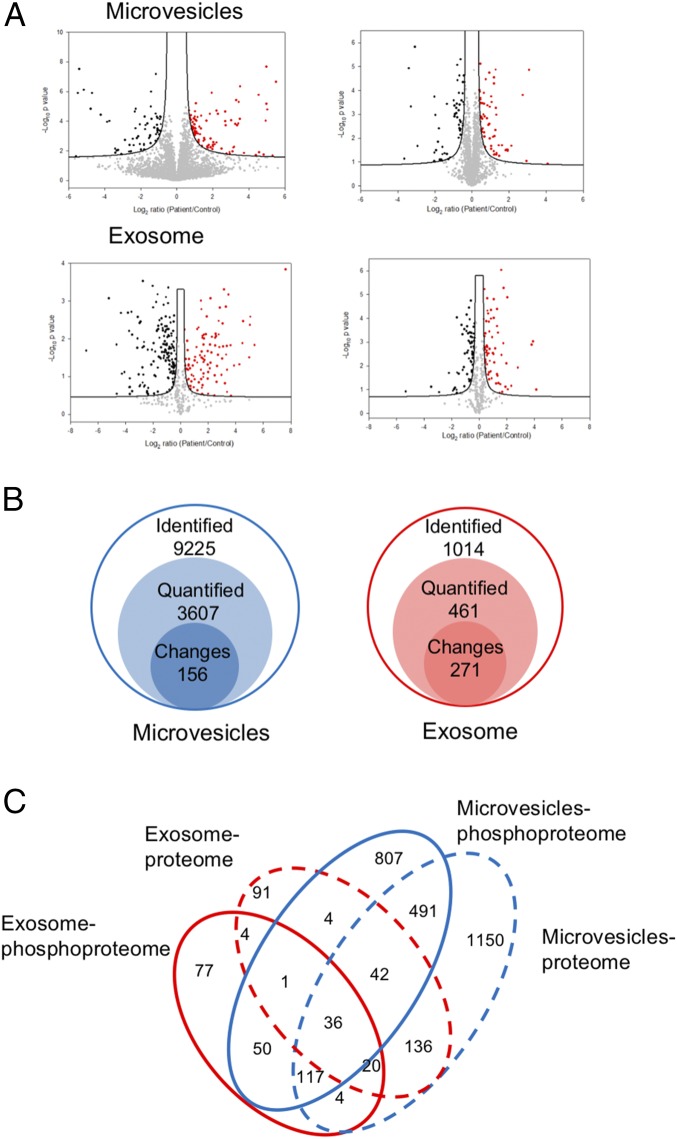
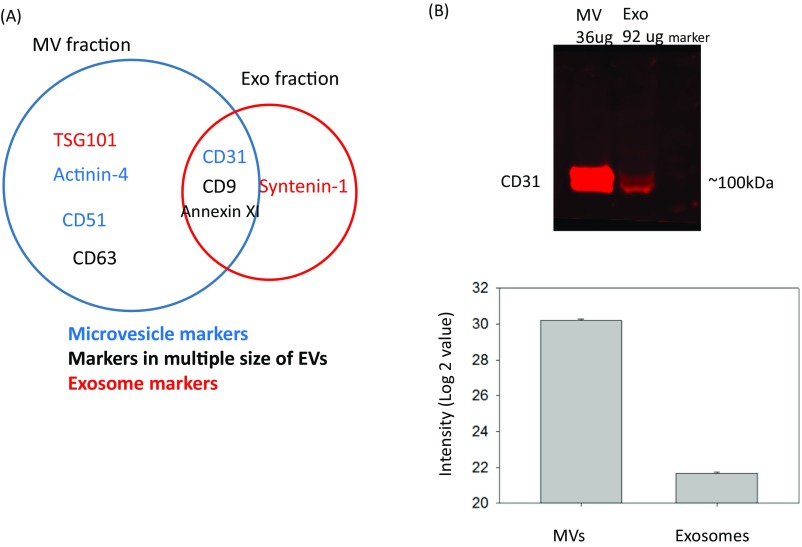
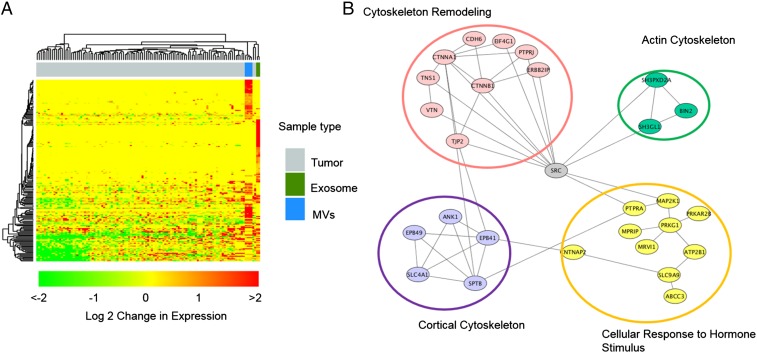
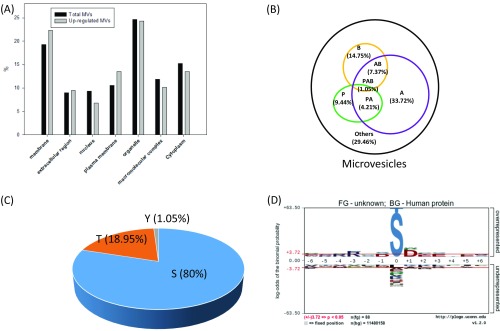
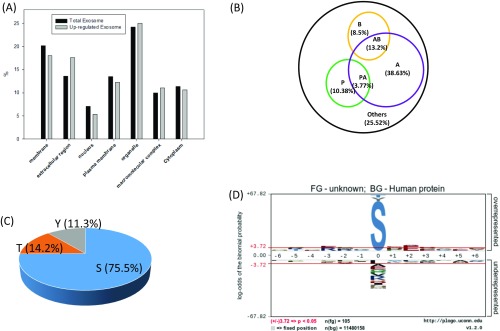
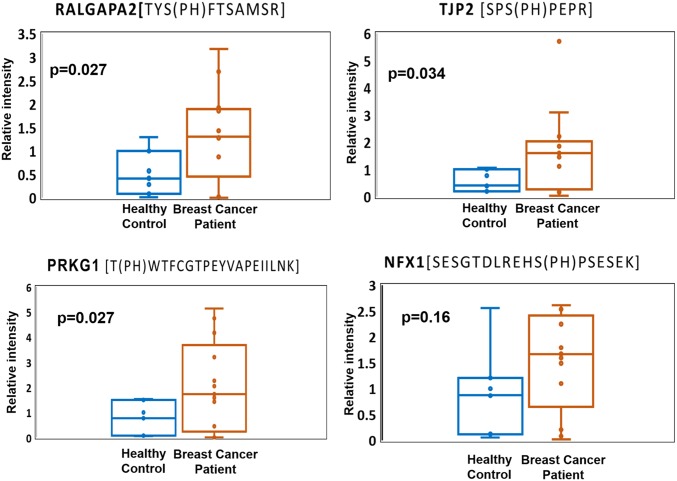
The state of protein phosphorylation can be a key determinant of cellular physiology such as early-stage cancer, but the development of phosphoproteins in biofluids for disease diagnosis remains elusive. Here we demonstrate a strategy to isolate and identify phosphoproteins in extracellular vesicles (EVs) from human plasma as potential markers to differentiate disease from healthy states. We identified close to 10,000 unique phosphopeptides in EVs isolated from small volumes of plasma samples. Using label-free quantitative phosphoproteomics, we identified 144 phosphoproteins in plasma EVs that are significantly higher in patients diagnosed with breast cancer compared with healthy controls. Several biomarkers were validated in individual patients using paralleled reaction monitoring for targeted quantitation. This study demonstrates that the development of phosphoproteins in plasma EV as disease biomarkers is highly feasible and may transform cancer screening and monitoring.

Keywords: biomarker; extracellular vesicles; mass spectrometry; phosphoproteins; proteomics.


Conflict of interest statement

A.B.I. and W.A.T. are cofounders of Tymora Analytical Operations.

Figures

Fig. 1.
Fig. 1.
The workflow for EVs phosphoproteomics of plasma samples from patients with breast cancer and healthy controls. EVs including microvesicles and exosomes were isolated through sequential high-speed centrifugation, followed by protein extraction, phase transfer surfactant digestion, and phosphopeptide enrichment for LC-MS analyses.
Fig. 2.
Fig. 2.
(A) The Venn diagram showing the number of unique phosphopeptides identified in microvesicles and exosomes. (B) Classification of the identified phosphoproteins based on cellular component and biological function. (C) The distribution of serine/threonine/tyrosine (S/T/Y) phosphopeptides in microvesicles and exosomes.
Fig. S1.
Fig. S1.
(A) The bar chart showing the number of unique phosphopeptides identified in microvesicles and exosomes. The values indicated the mean identification numbers of technical replicates, the error bar shows the SD between replicates. (B) Classification of the identified phosphoproteins based on cellular component and biological function. The values indicated the mean of technical replicates; the error bar shows the SD between replicates.
Fig. S2.
Fig. S2.
(A) Classification of phosphosites based on kinase specificities (P, proline-directed; A, acidophilic; B, basophilic; others). (B) The summary of motifs were extracted from the sequence windows of identified probability >0.75 phosphorylation sites by pLogo.
Fig. 3.
Fig. 3.
(A) The volcano plots representing the quantitative analyses of the phosphoproteomes (Left) and proteomes (Right) of microvesicles and exosomes in patients with breast cancer vs. in healthy controls. Significant changes in proteins and phosphosites in breast cancer that were identified through a permutation-based FDR t test (FDR = 0.05; S0 = 0.2), based on three technical replicates. The significant up-regulated proteins and phosphosites are colored in red, and down-regulated are colored in black. (B) The numbers of identified phosphopeptides (class 1), quantified phosphosites (class 2), and significantly changed phosphosites (class 3) in label-free quantification. See supplementary figures and Dataset S1 for more detailed information. (C) The Venn diagram showing the protein overlap between phosphoproteomes and proteomes in microvesicles and exosome.
Fig. S3.
Fig. S3.
(A) The Venn diagram showing the common EVs markers present in MVs and exosome fractions through proteomic analyses. (B) Western blotting (WB) and MS data showing the purity of EV isolation. Two EV fractions were collected and analyzed by WB using antibody against CD 31, which is considered an endothelial-derived microvesicles marker. A total of 36 μg protein was used in MV fraction, and considering exosomes may possibly contain some plasma proteins, around 2.5-fold of protein amount of exosome fraction was used. MS data were extracted from two EV fractions, and the bar chart showed the intensity mean value with error bar of control and patient replicates.
Fig. 4.
Fig. 4.
(A) The hierarchical clustering analysis of up-regulated phosphopeptides conveys the overlap between EVs in this study and breast cancer tissues by Mertins et al. (20). The top bars show the clustering of different samples, and gray represents the tumor samples analyzed by Mertins et al., whereas blue bars are replicates of MV analysis and cobalt green are exosome analyses in this study. The fold change is shown in log 2 value. (B) The STRING network analysis of up-regulated phosphoproteins in EVs.
Fig. S4.
Fig. S4.
(A) Comparison of cellular components of MV phosphopeptides that showed an increase in patients with cancer, with those of total phosphopeptides identified in MV. (B–D) Motif and the distribution of S/T/Y phosphopeptides that showed increase in patients with cancer in microvesicles.
Fig. S5.
Fig. S5.
(A) Comparison of cellular components of exosome phosphopeptides that showed increase in patients with cancer with those of total phosphopeptides identified in exosome. (B–D) Motif and the distribution of S/T/Y phosphopeptides that showed increase in patients with cancer in exosomes.
Fig. 5.
Fig. 5.
Four potential markers were validated in 13 patients with breast cancer and seven healthy individuals, using PRM. Three potential markers, RALGAPA2, PRKG1, and TJP2, show significant difference (P < 0.05) in patients with breast cancer compared with healthy controls.

References

    1. Hunter T. Signaling--2000 and beyond. Cell. 2000;100(1):113–127. - PubMed
    1. Kabuyama Y, Resing KA, Ahn NG. Applying proteomics to signaling networks. Curr Opin Genet Dev. 2004;14(5):492–498. - PubMed
    1. Iliuk AB, Arrington JV, Tao WA. Analytical challenges translating mass spectrometry-based phosphoproteomics from discovery to clinical applications. Electrophoresis. 2014;35(24):3430–3440. - PMC - PubMed
    1. Melo SA, et al. Glypican-1 identifies cancer exosomes and detects early pancreatic cancer. Nature. 2015;523(7559):177–182. - PMC - PubMed
    1. Gonzales PA, et al. Large-scale proteomics and phosphoproteomics of urinary exosomes. J Am Soc Nephrol. 2009;20(2):363–379. - PMC - PubMed

Publication types