. 2017 Mar 21;114(12):3157-3162.
doi: 10.1073/pnas.1701746114. Epub 2017 Mar 7.

Engineered erythrocytes covalently linked to antigenic peptides can protect against autoimmune disease

Affiliations

Engineered erythrocytes covalently linked to antigenic peptides can protect against autoimmune disease

Novalia Pishesha et al. Proc Natl Acad Sci U S A. .

Erratum in

Abstract

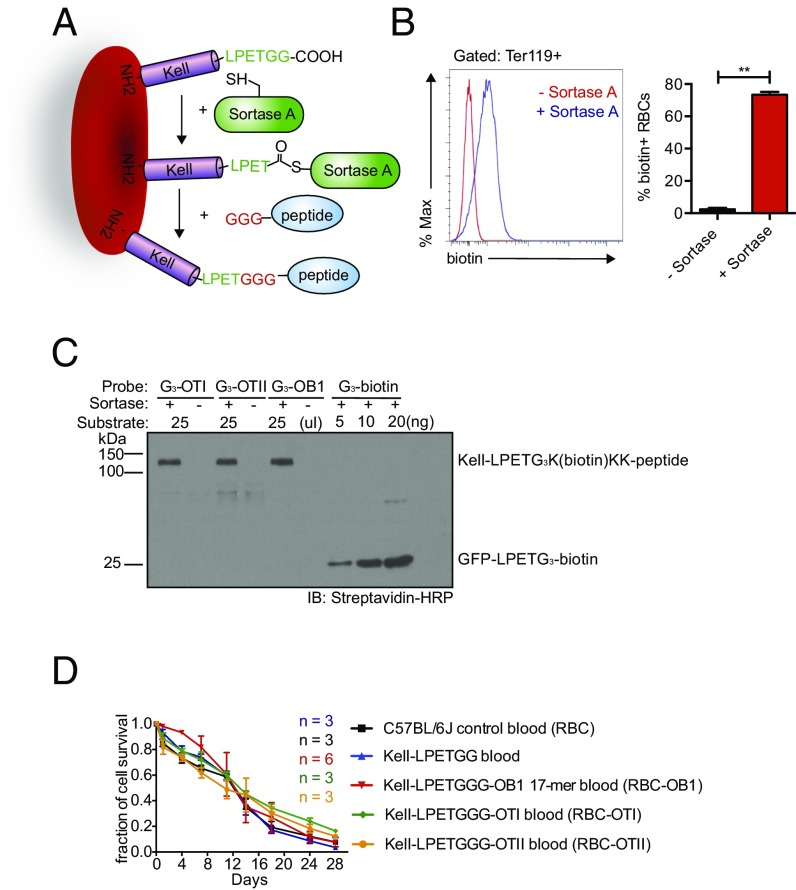
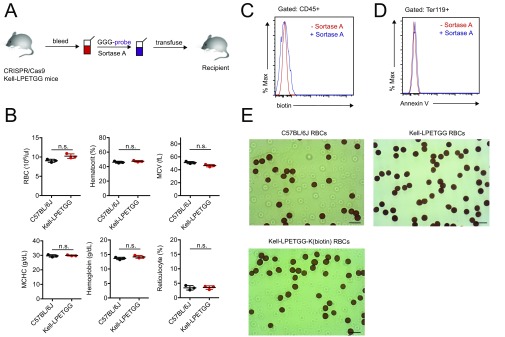
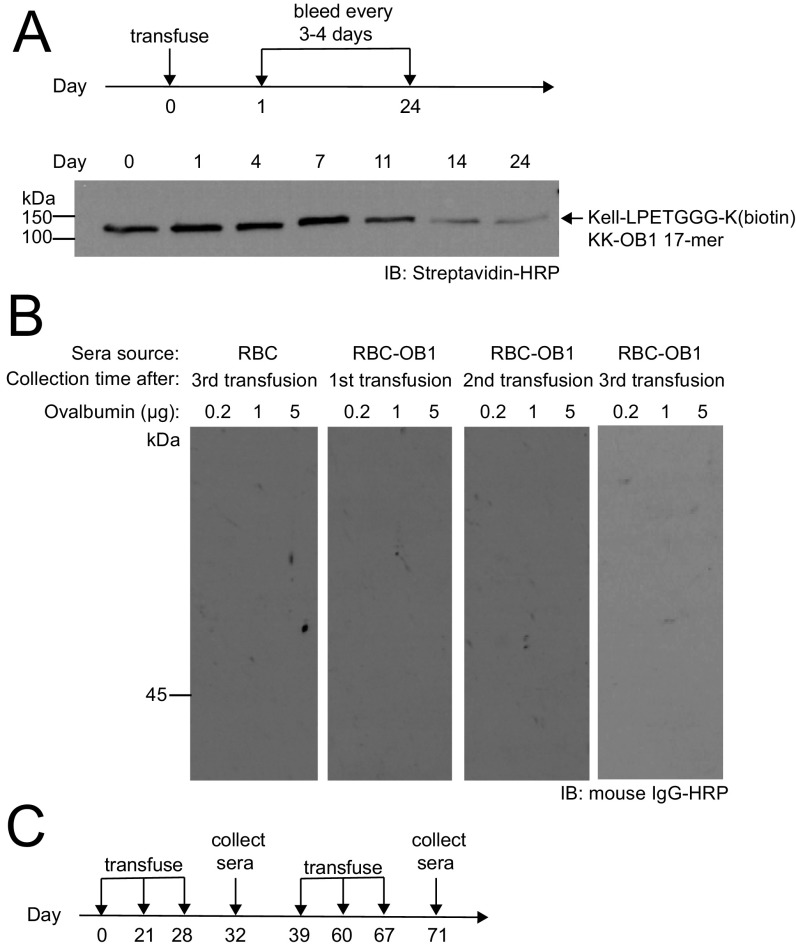
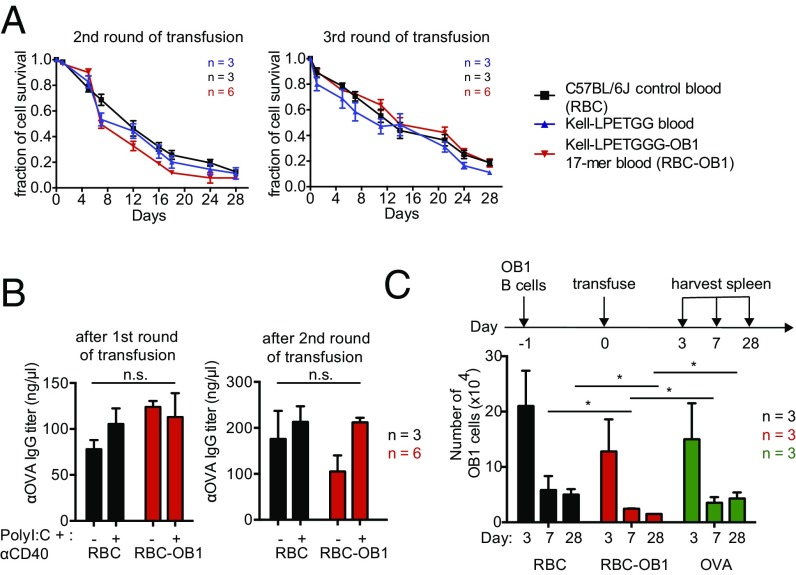
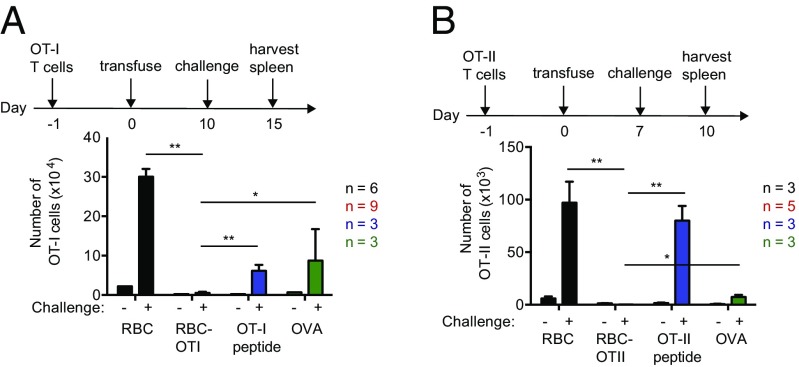
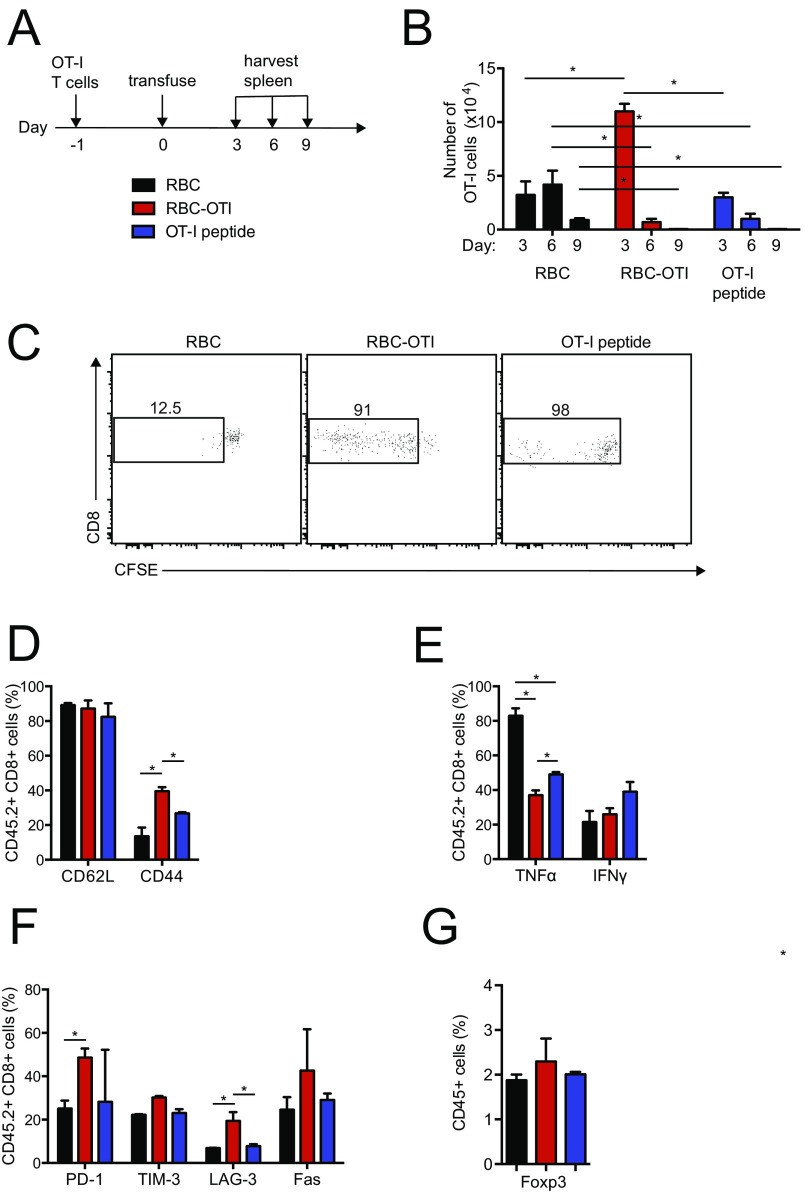
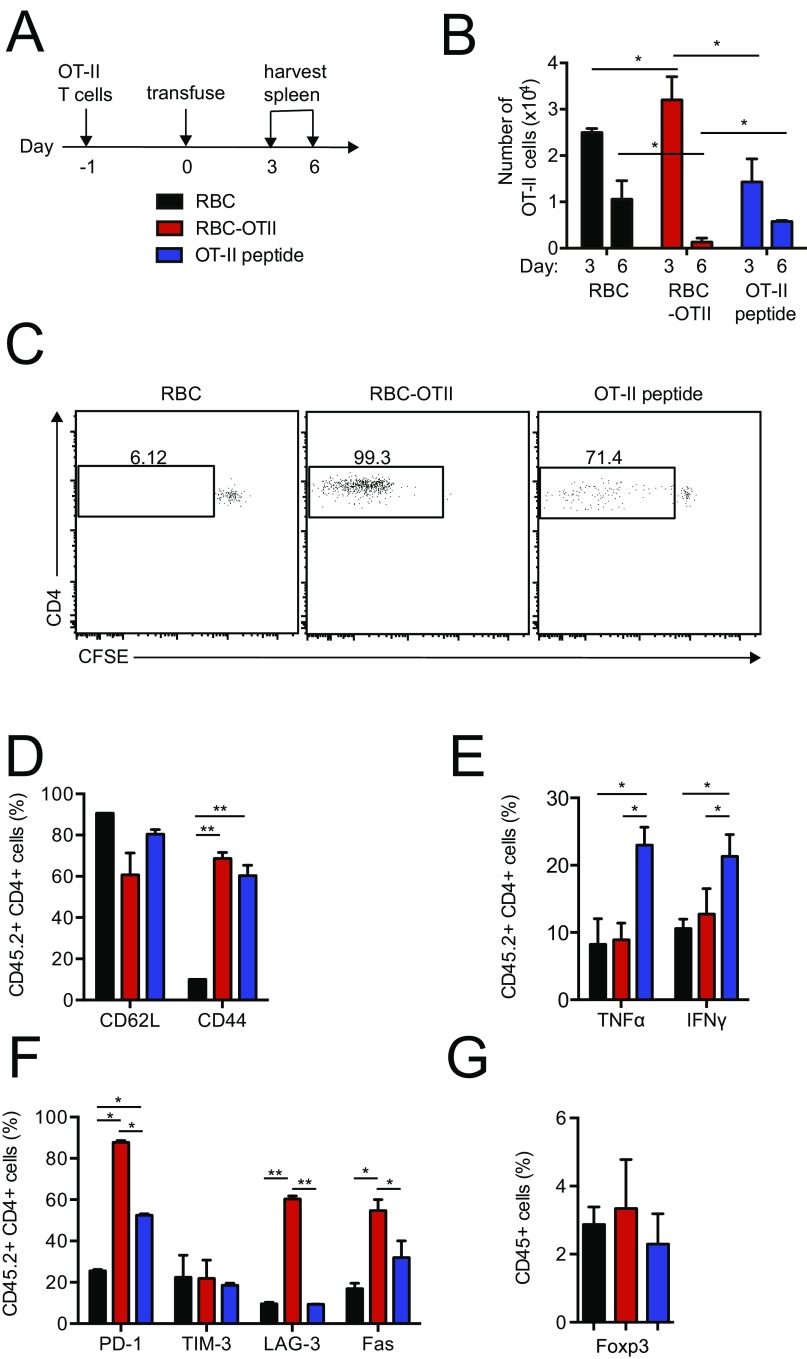
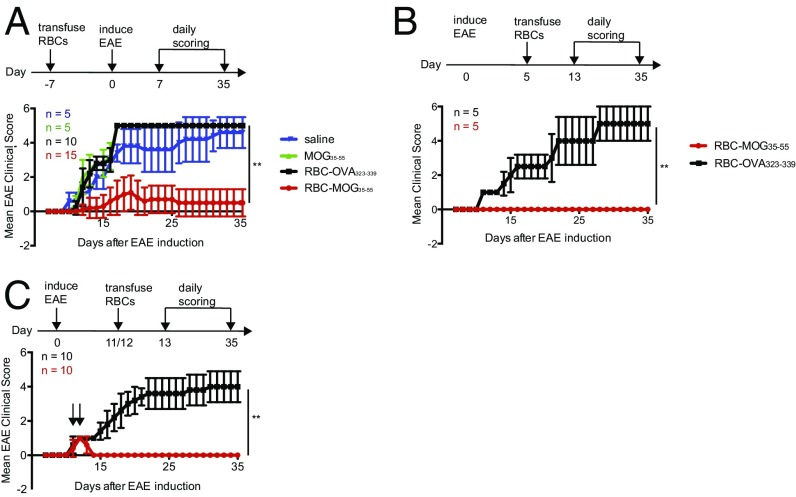
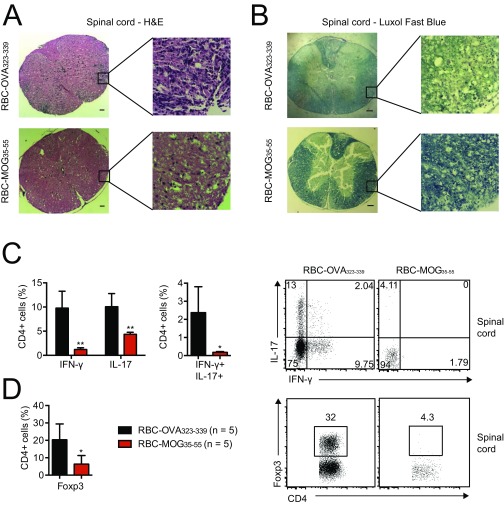
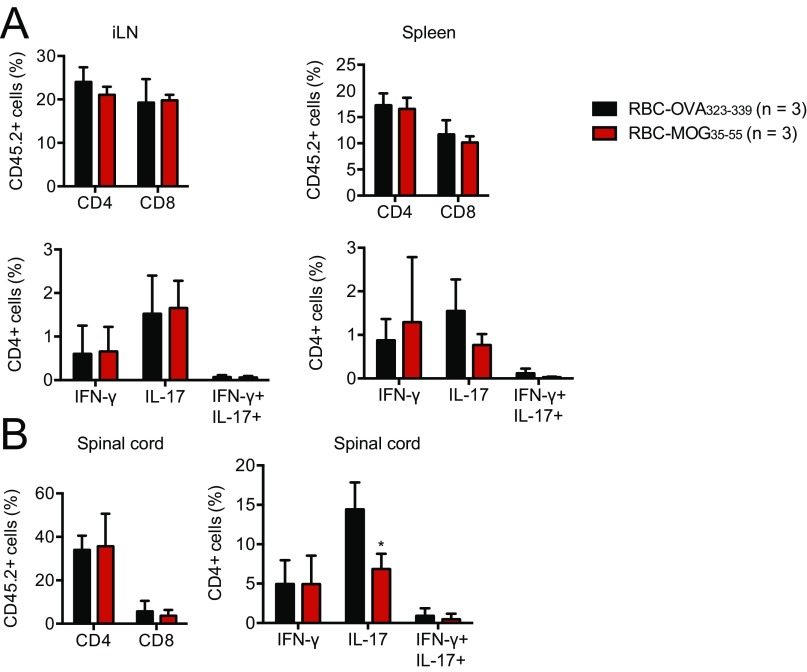
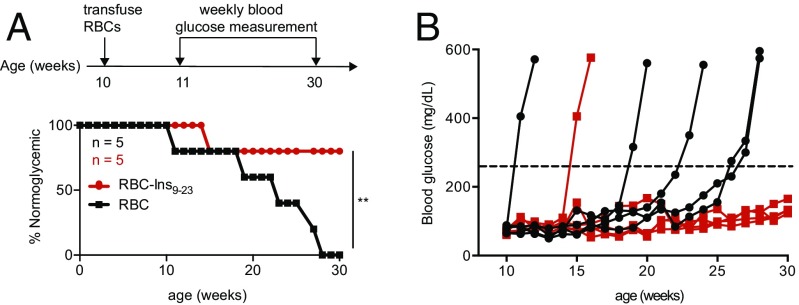
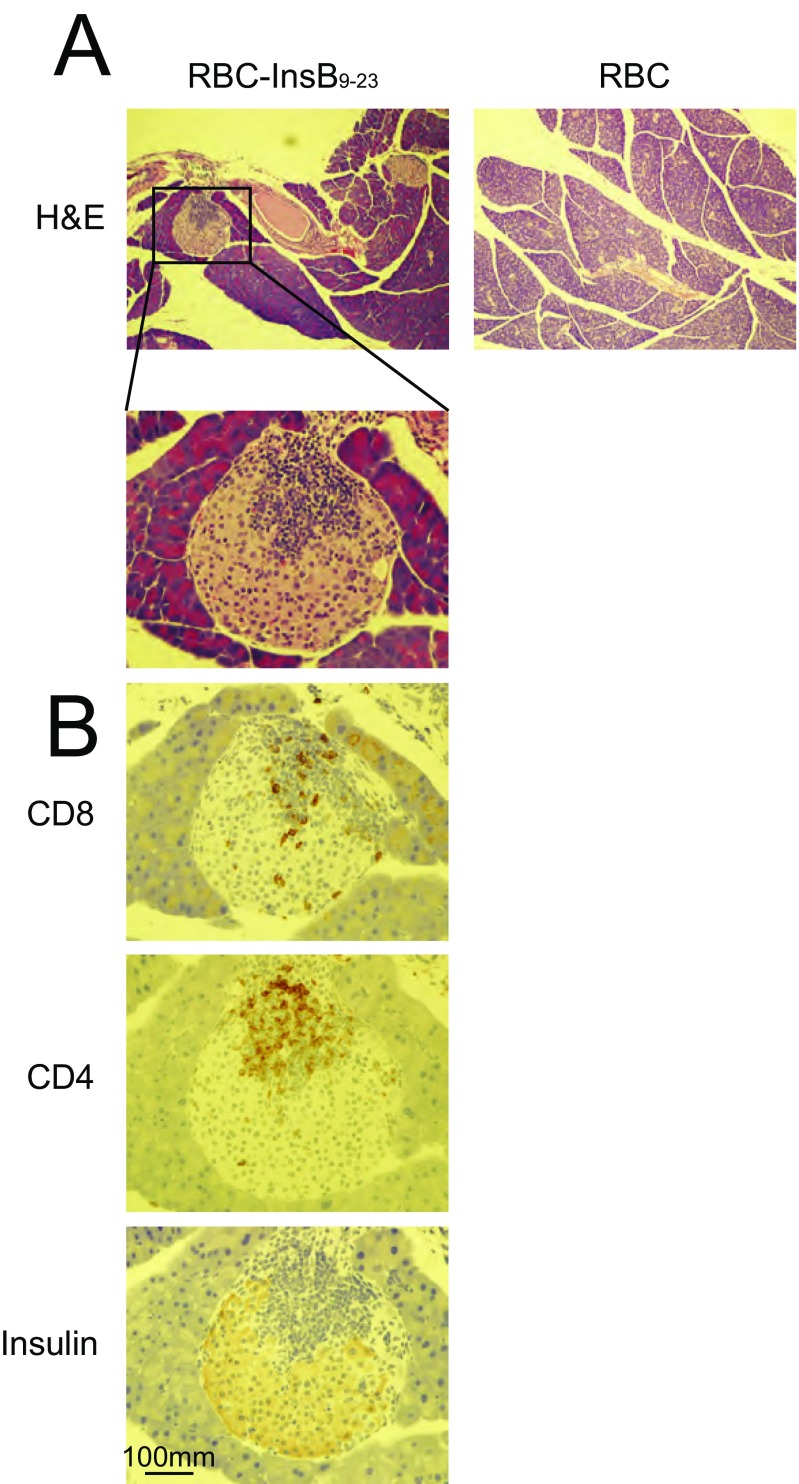
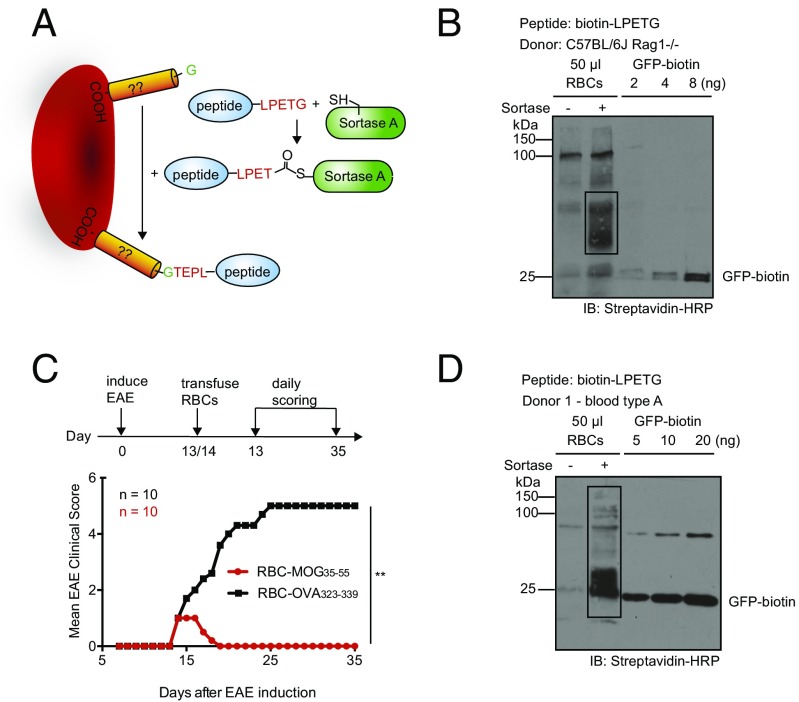
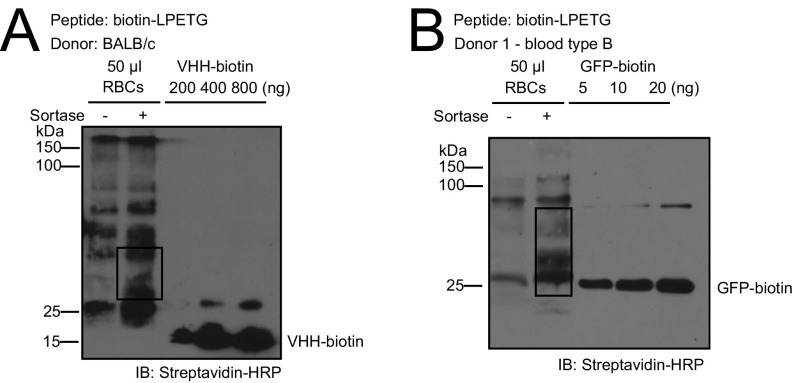
Current therapies for autoimmune diseases rely on traditional immunosuppressive medications that expose patients to an increased risk of opportunistic infections and other complications. Immunoregulatory interventions that act prophylactically or therapeutically to induce antigen-specific tolerance might overcome these obstacles. Here we use the transpeptidase sortase to covalently attach disease-associated autoantigens to genetically engineered and to unmodified red blood cells as a means of inducing antigen-specific tolerance. This approach blunts the contribution to immunity of major subsets of immune effector cells (B cells, CD4+ and CD8+ T cells) in an antigen-specific manner. Transfusion of red blood cells expressing self-antigen epitopes can alleviate and even prevent signs of disease in experimental autoimmune encephalomyelitis, as well as maintain normoglycemia in a mouse model of type 1 diabetes.

Keywords: antigen-specific tolerance; autoimmune diseases; engineered red blood cells; sortase.


Conflict of interest statement

Conflict of interest statement: H.L.P. serves as a paid consultant and owns equity in Rubies, a company that seeks to apply modified red blood cells for treatment of disease. H.F.L. and H.L.P. serve as advisors and have equity in Rubius, a biotechnology company that seeks to exploit but does not provide financial support for the technology described in this paper.

Figures

Fig. 1.
Fig. 1.
Designs and characterization of engineered RBCs. (A) Schematic for Kell C-terminal sortase labeling with GGG-carrying antigens peptides. (B) Evaluation and quantification of mature Kell-LPETGG RBCs for sortase labeling by incubation of RBCs with biotin-containing probes in the presence or absence Sortase A. Cytofluorimetry was performed with anti-TER119, a RBC surface marker, and antibiotin antibodies. (n = 3; **P < 0.01, unpaired t test with Holm–Sidak adjustment). (C) Quantification of sortase labeling of Kell-LPETGG RBCs with different biotin-containing peptides by immunoblotting (IB) using streptavidin-HRP. GFP-biotin carrying a single biotin/mole of GFP was used a reference. (D) CFSE-labeled RBCs from C57BL/6J and Kell-LPETGG mice were transfused into recipient mice. Kell-LPETGG blood samples were also subjected to sortagging with the three different OVA-derived peptides before transfusion. RBC survival in the circulation was tracked via CFSE fluorescence by flow cytometry.
Fig. S1.
Fig. S1.
(A) Overall experimental scheme. (B) Complete blood count of homozygous Kell-LPETG mice indicate normal RBC number, hematocrit, mean corpuscular volume, mean corpuscular hemoglobin concentration (MCHC), hemoglobin content, and reticulocyte number. (C) Surface labeling of Kell-LPETG RBCs with GGG-biotin as characterized by flow cytometry. Because Kell protein is a RBC-specific protein, none of the other hematopoietic cell subsets, CD45+ cells, were sortagged with GGG-biotin. (D) No increase of Annexin V, a death cell marker, staining upon sortagging. (E) Benzidine staining reveals normal morphology of engineered RBCs. (Scale bars, 10 μm.)
Fig. S2.
Fig. S2.
(A) RBC-OB1 blood sample (25 μL) from the consecutive bleeding (as in Fig. 1D) were further characterized by Western blot. Clearance of biotinylated Kell transmembrane proteins are in agreement with the overall RBC clearance rate as indicated by the disappearance of the biotin signal. (B) CFSE-labeled RBCs from C57BL/6J and Kell-LPETGG mice were transfused into recipient mice. One set of Kell-LPETGG blood samples were also subjected to sortagging with OB1 peptides before transfusion. Following the first transfusion (as in Fig. 1D), the same cohort is subjected to two more transfusions with a 1 wk gap between each transfusion (as in Fig. 2A). Western blot against OVA proteins indicates no antibody response upon repeated transfusions of RBC-OB1 into C57BL/6J. (C) Overall RBC and RBC-OB1 transfusion schedule into BALB/c mice in Fig. 2B.
Fig. 2.
Fig. 2.
OB1 peptide-decorated RBCs blunt responses of OB1-specific B cells. (A) CFSE-labeled RBCs from C57BL/6J and Kell-LPETGG mice were transfused into recipient mice. One set of Kell-LPETGG blood samples were also subjected to sortagging with OB1 peptides before transfusion. Following the first transfusion (as in Fig. 1D), the same cohort is subjected to two more transfusions with a 1-wk gap between each transfusion. RBC survival in the circulation was tracked via CFSE fluorescence by flow cytometry. Repeated transfusions of sortagged RBCs into C57BL/6J mice do not induce faster clearance. (B) A cohort of BALB/c mice was transfused with either C57BL/6J or RBC-OB1. OVA-specific IgG titers at the end of each transfusion were measured by ELISA. (C) Flow cytometry of the total number of adoptively transferred OB1 B cells in spleen, harvested 3, 7, and 28 d after RBC, RBC-OB1, or OVA transfusion. *P < 0.05; ns, not significant.
Fig. 3.
Fig. 3.
Engineered RBCs blunt responses of OVA-specific CD4 and CD8 T-cell responses. (A) Total number of OT-I T cells in spleen following a challenge with saline (−) or OT-I peptide/CFA (+) at day 10. (B) Absolute number of OT-II T cells in spleen, 3 d after challenge with saline (−) or OVA/CFA (+) at day 7. Data are shown as mean ± SD and represent at least two independent experiments. Statistically significant differences are indicated by asterisks: *P < 0.05; **P < 0.01 (unpaired t test with Holm–Sidak adjustment).
Fig. S3.
Fig. S3.
(A) Experimental scheme. (B) The numerical kinetics of splenic OT-I T cells in the adoptive transfer model. RBC–OT-I leads to OT-I T-cell disappearance after an early spurt of proliferation as analyzed by flow cytometry. (C) CFSE-dilution indicates the proliferation of OT-I T cells at day 3 upon treatment administration. Frequency of splenic (D) CD44+ and CD62L+ OT-I T cells, (E) IFN-γ+ and TNF-α+ OT-I T cells, and (F) PD-1+, TIM-3+, LAG-3+, and Fas+ OT-I T cells in the spleen at day 3 upon transfusion. (G) Frequency of splenic Foxp3+ CD4+ regulatory T cells at day 15 after CFA/OT-I peptide challenge. *P < 0.05.
Fig. S4.
Fig. S4.
(A) Experimental scheme. (B) The numerical kinetics of splenic OT-II T cells in the adoptive transfer model. RBC–OT-II leads to OT-I T-cell disappearance after an early spurt of proliferation as analyzed by flow cytometry. (C) CFSE-dilution indicates the proliferation of OT-II T cells at day 3 upon treatment administration. Frequency of splenic (D) CD44+ and CD62L+ OT-II T cells, (E) IFN-γ+ and TNF-α+ OT-II T cells, and (F) PD-1+, TIM-3+, LAG-3+, and Fas+ OT-II T cells in the spleen at day 3 upon transfusion. (G) Frequency of splenic Foxp3+ CD4+ regulatory T cells at day 10 after CFA/OVA challenge. *P < 0.05; **P < 0.01.
Fig. 4.
Fig. 4.
Engineered RBCs in EAE mouse models. (A) Mean EAE clinical scores of mice subjected to transfusion with RBC-MOG35–55, RBC-OVA323–339, unconjugated MOG35–55 peptide, or saline at 7 d before induction of EAE. Mean clinical scores of mice subjected to therapy by transfusion of RBC-MOG35–55 (or RBC-OVA323–339 as control) into (B) mice at preclinical stage and (C) mice with a clinical EAE score of 1; the black arrows indicate time of RBC administration. **P < 0.01, two-way ANOVA with repeated measures. All pair-wise comparisons were performed; RBC-MOG35–55 was shown to be significantly different from other treatment groups.
Fig. S5.
Fig. S5.
(A) H&E and (B) Luxol fast blue staining of spinal cord sections from MOG35–55-immunized mice that prophylactically received RBC-MOG35–55 or RBC-OVA323–339; these images visualize immune-cell infiltration and demyelination, respectively. (Scale bars, 100 μm.) (C) Flow cytometry analysis of CD4+ lymphocyte infiltrates into the spinal cord of diseased and protected mice at day 15–18 after immunization. (D) Frequency of Foxp3+ CD4+ regulatory T cells in the spinal cord at day 15–18 after immunization. *P < 0.05; **P < 0.01.
Fig. S6.
Fig. S6.
Flow cytometry analyses of (A) CD4+ and CD8+ composition as well as Th1 and Th17 response in the spleen and inguinal lymph nodes a day after RBC-MOG35–55 or RBC-OVA323–339 treatment. (B) Flow cytometry analysis of lymphocyte infiltrates in the spinal cord of diseased and protected mice a day after RBC-MOG35–55 or RBC-OVA323–339 treatment. *P < 0.05.
Fig. 5.
Fig. 5.
Engineered RBCs in T1D mouse models. (A) Schematic for prophylactic T1D treatment. Blood glucose levels were measured to monitor T1D progression in NOD mice, considered diabetic when glucose levels were >250 mg/dL, **P < 0.01 (log-rank test). (B) Individual blood glucose level measurement in mice treated with RBC or RBC-InsB9–23.
Fig. S7.
Fig. S7.
(A) H&E and (B) CD4, CD8, and insulin staining of pancreas sections from NOD/ShiltJ mice treated with RBC or RBC-Ins9–23. (Scale bar, 100 μm.) (Magnification: A, 10×; A, Inset, 40×.)
Fig. 6.
Fig. 6.
Translatability of engineered RBCs in human system. (A) Schematic for sortagging of endogenous RBC membrane proteins containing a suitably exposed N-terminal glycine with LPETGG-equipped peptide. (B) Installation of biotin-LPETGG peptide onto endogenous sortase substrates on mouse RBCs, analyzed by SDS PAGE followed by immunoblotting using streptavidin-HRP. Endogenous biotinylated substrates are boxed. (C) Mean EAE clinical scores of mice subjected to therapy by transfusion of C57BL6/J RBCs from Rag2−/− mice, sortagged with MOG35–55-LPETGG (or C57BL6/J RBCs Rag2−/− as control) into mice with clinical EAE score of 1; time of RBC administration is indicated by the black arrow. **P < 0.01, two-way ANOVA with repeated measures. (D) Installation of biotin-LPETGG peptide onto endogenous sortase substrates on human RBCs type A, analyzed by SDS PAGE followed by immunoblotting using streptavidin-HRP. Endogenous biotinylated substrates are boxed.
Fig. S8.
Fig. S8.
Installation of biotin-LPETGG peptide onto endogenous sortase substrates on (A) BALB/c mouse RBCs and (B) human RBCs type B, analyzed by SDS PAGE followed by immunoblotting using Streptavidin-HRP. Endogenous biotinylated substrates are boxed.

Comment in

References

    1. Feldmann M, Steinman L. Design of effective immunotherapy for human autoimmunity. Nature. 2005;435(7042):612–619. - PubMed
    1. Liblau RS, et al. Intravenous injection of soluble antigen induces thymic and peripheral T-cells apoptosis. Proc Natl Acad Sci USA. 1996;93(7):3031–3036. - PMC - PubMed
    1. Miller SD, Turley DM, Podojil JR. Antigen-specific tolerance strategies for the prevention and treatment of autoimmune disease. Nat Rev Immunol. 2007;7(9):665–677. - PubMed
    1. Luo X, Miller SD, Shea LD. Immune tolerance for autoimmune disease and cell transplantation. Annu Rev Biomed Eng. 2016;18:181–205. - PMC - PubMed
    1. Cremel M, Guérin N, Horand F, Banz A, Godfrin Y. Red blood cells as innovative antigen carrier to induce specific immune tolerance. Int J Pharm. 2013;443(1-2):39–49. - PubMed

Publication types