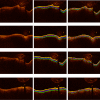
. 2017 Jan 30;8(2):1203-1220.
doi: 10.1364/BOE.8.001203. eCollection 2017 Feb 1.

Deep feature learning for automatic tissue classification of coronary artery using optical coherence tomography

Affiliations

Deep feature learning for automatic tissue classification of coronary artery using optical coherence tomography

Atefeh Abdolmanafi et al. Biomed Opt Express. .

Abstract

Kawasaki disease (KD) is an acute childhood disease complicated by coronary artery aneurysms, intima thickening, thrombi, stenosis, lamellar calcifications, and disappearance of the media border. Automatic classification of the coronary artery layers (intima, media, and scar features) is important for analyzing optical coherence tomography (OCT) images recorded in pediatric patients. OCT has been known as an intracoronary imaging modality using near-infrared light which has recently been used to image the inner coronary artery tissues of pediatric patients, providing high spatial resolution (ranging from 10 to 20 μm). This study aims to develop a robust and fully automated tissue classification method by using the convolutional neural networks (CNNs) as feature extractor and comparing the predictions of three state-of-the-art classifiers, CNN, random forest (RF), and support vector machine (SVM). The results show the robustness of CNN as the feature extractor and random forest as the classifier with classification rate up to 96%, especially to characterize the second layer of coronary arteries (media), which is a very thin layer and it is challenging to be recognized and specified from other tissues.

Keywords: (100.0100) Image processing; (100.2960) Image analysis; (100.4996) Pattern recognition, neural networks; (110.0110) Imaging systems; (110.2960) Image analysis; (110.4500) Optical coherence tomography.


Figures
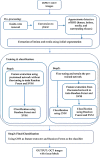
Fig. 1
Fig. 1
Flowchart of the tissue classification algorithm. The process of training, feature extraction, and classification using pre-trained CNN just as feature generator is shown in step 1 and fine-tuning the network to use it as the classifier as well as feature extractor to train Random Forest and SVM is demonstrated in step 2. Step 3 show our final decision to select the optimal classification algorithm based on measured classification accuracy, sensitivity, and specificity at each step of the work and for each classifier.
Fig. 2
Fig. 2
Pre-processing steps in order from left to right: original image, converting to planar representation, and extracting the region of interest by removing all the background.
Fig. 3
Fig. 3
Peak detection and image quantization. Red circles show the peaks in the image profile; yellow, blue, and green are used to display intima, intima-media, and media borders, respectively.
Fig. 4
Fig. 4
Initial segmentation of one frame for four different patients. From left to right: Planar representation of the original image, manual segmentation, initial segmentation. Yellow, blue, and green dots show intima, intima-media, and media borders, respectively.
Fig. 5
Fig. 5
Tissue classification accuracy for all 26 sequences of intravascular OCT images at each step of fine-tuning the network from fc8 to the first convolutional layer to find the optimal depth of fine-tuning.
Fig. 6
Fig. 6
Performance of CNN, Random Forest, and SVM based on classification accuracy for each patient. Fine-tuning is performed from fc8 to the third convolutional layer for CNN. Features are extracted from fc7 (the last fully connected layer just before the classification layer) of the pre-trained and fine-tuned network to train Random Forest and SVM.
Fig. 7
Fig. 7
Performance of Random Forest, and SVM based on classification accuracy for each patient. CNN is used as feature extractor for our dataset. Features are extracted from fc7 (the last fully connected layer just before the classification layer) of the pre-trained network to train Random Forest and SVM. The performance of RF and SVM compared against the best performance of the CNN as the classifier in our experiments when the network is fine-tuned from fc8 to the third convolutional layer.
Fig. 8
Fig. 8
Classification results for one frame of five different patients. From left to right for each patient: original image converted to planar representation, initial segmentation, intima (red), and media (green)

References

    1. Dionne A., Ibrahim R., Gebhard C., Bakloul M., Selly J.-B., Leye M., Déry J., Lapierre C., Girard P., Fournier A., Dahdah N., “Coronary wall structural changes in patients with kawasaki disease: new insights from optical coherence tomography (oct),” J. Am. Heart Assoc. 4, e001939 (2015).10.1161/JAHA.115.001939 - DOI - PMC - PubMed
    1. Regar E., Ligthart J., Bruining N., van Soest G., “The diagnostic value of intracoronary optical coherence tomography,” Herz. 36, 417–429 (2011).10.1007/s00059-011-3487-7 - DOI - PubMed
    1. Preim B., Bartz D., Visualization in Medicine: Theory, Algorithms, and Applications (Morgan Kaufmann, 2007).
    1. Ferrante G., Presbitero P., Whitbourn R., Barlis P., “Current applications of optical coherence tomography for coronary intervention,” Int. J. Cardiol. 165, 7–16 (2013).10.1016/j.ijcard.2012.02.013 - DOI - PubMed
    1. Bezerra H. G., Costa M. A., Guagliumi G., Rollins A. M., Simon D. I., “Intracoronary optical coherence tomography: a comprehensive review: clinical and research applications,” JACC: Cardiovascular Interventions 2, 1035–1046 (2009). - PMC - PubMed