Review
. 2017 Mar 7;22(3):415.
doi: 10.3390/molecules22030415.

Hydrogen Atomic Positions of O-H···O Hydrogen Bonds in Solution and in the Solid State: The Synergy of Quantum Chemical Calculations with ¹H-NMR Chemical Shifts and X-ray Diffraction Methods

Affiliations
Review

Hydrogen Atomic Positions of O-H···O Hydrogen Bonds in Solution and in the Solid State: The Synergy of Quantum Chemical Calculations with ¹H-NMR Chemical Shifts and X-ray Diffraction Methods

Michael G Siskos et al. Molecules. .

Abstract

The exact knowledge of hydrogen atomic positions of O-H···O hydrogen bonds in solution and in the solid state has been a major challenge in structural and physical organic chemistry. The objective of this review article is to summarize recent developments in the refinement of labile hydrogen positions with the use of: (i) density functional theory (DFT) calculations after a structure has been determined by X-ray from single crystals or from powders; (ii) ¹H-NMR chemical shifts as constraints in DFT calculations, and (iii) use of root-mean-square deviation between experimentally determined and DFT calculated ¹H-NMR chemical shifts considering the great sensitivity of ¹H-NMR shielding to hydrogen bonding properties.

Keywords: DFT; NMR; X-ray diffraction; chemical shifts; hydrogen bonding.


Conflict of interest statement

The authors declare no conflict of interest.

Figures

Figure 1
Figure 1
Bond lengths of the investigated structures. (a) X-ray determined values (vertical axis) plotted against quantum-chemically optimized ones (horizontal axis); (b) Quantum-chemically optimized values (horizontal axis) vs. the available neutron diffraction data. Covalent C–H (left), N–H (middle), O–H, S–H, and B–H (right) bond lengths are considered. Reprinted, with permission, from [24]. Copyright 2012, by The American Chemical Society.
Figure 2
Figure 2
Neutron diffraction X–H bond length data compared both to X-ray-data (light gray circles) and quantum-chemically optimized values (purple circles). Values for X = C, N, O, S, B are given. Reprinted, with permission, from [24]. Copyright 2012, by The American Chemical Society.
Scheme 1
Scheme 1
Tautomeric equilibrium of dibenzoylmethane.
Figure 3
Figure 3
Effects of temperature on the O–H and O···H distances of dibenzoylmethane. X-ray (open triangles) and neutron diffraction (open circles) data [61] are plotted along with DFT optimized O–H and O···H bond lengths (filled triangles) [24]. Error bars are plotted for the neutron-derived data, while those for X-ray data have been left out for clarity, and dotted lines serve only as guides to the eye [56]. Reprinted, with permission, from [24]. Copyright 2012, by The American Chemical Society.
Figure 4
Figure 4
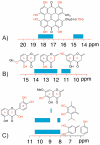
Classification of the chemical shifts of the –OH groups in DMSO-d6 on the basis of the structure of the molecule and the nature of the substituent in the rings. (AC) are the regions of 14–20 ppm, 10–15 ppm, and 8–10.5 ppm, respectively. Reprinted, with permission, from [67]. Copyright 2014, by MDPI.
Figure 5
Figure 5
Chemical formulas of phenol (1), 4-methylcatechol (2), and genkwanin (3).
Figure 6
Figure 6
Calculated (at the GIAO DFT/B3LYP/6-311++G(2d,p) level of theory) vs. experimental values of the chemical shifts of the –OH protons of phenol, 4-methylcatehol and genkwanin (Figure 5) in DMSO (yellow), acetone (green), CH3CN (red), and CHCl3 (blue), with minimization of the complexes with a single solvent molecule at the DFT/B3LYP/6-31+G(d) (A) and DFT/B3LYP/6-311++G(d,p); (B) level of theory. Adopted, with permission, from [46]. Copyright 2013, The Royal Society of Chemistry.
Figure 7
Figure 7
Histogram of the errors Δ(δexp − δcal) of the calculated (at the GIAO DFT/B3LYP/6-311++G(2d,p) level of theory) 1H OH chemical shifts with minimization of the complexes with a single solvent molecule at the DFT/B3LYP/6-31+G(d) and DFT/B3LYP/6-311++G(d,p) level of theory. Reprinted, with permission, from [46]. Copyright 2013, The Royal Society of Chemistry.
Figure 8
Figure 8
The effect of conformation of the C-7 OCH3 and C-4′ OH groups on the chemical shifts of the C-4′ OH and C-5 OH protons for the 1:1 complexes of (a) genkwanin + DMSO; (b) genkwanin + Me2CO; (c) genkwanin + MeCN, and (d) genkwanin + CHCl3, with the use of DFT/B3LYP/6-31+G(d) (data in blue) and DFT/B3LYP/6-311++G(d,p) (data in red), level of theory. Adopted, with permission, from [46]. Copyright 2013, The Royal Society of Chemistry.
Figure 9
Figure 9
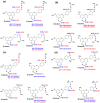
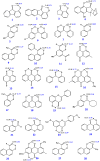
Chemical formulas of phenol compounds exhibiting intramolecular O–H···O hydrogen bonds and ionic complexes with intramolecular and intermolecular O–H···O hydrogen bonds. The data in black and blue are the computed 1H chemical shifts, ppm, with minimization of the structures at the B3LYP/6-31+G(d) and M06-2X/6-31+G(d) level of theory, respectively (see Table 1). Reprinted, with permission, from [47]. Copyright 2015, The Royal Society of Chemistry.
Figure 9
Figure 9
Chemical formulas of phenol compounds exhibiting intramolecular O–H···O hydrogen bonds and ionic complexes with intramolecular and intermolecular O–H···O hydrogen bonds. The data in black and blue are the computed 1H chemical shifts, ppm, with minimization of the structures at the B3LYP/6-31+G(d) and M06-2X/6-31+G(d) level of theory, respectively (see Table 1). Reprinted, with permission, from [47]. Copyright 2015, The Royal Society of Chemistry.
Figure 10
Figure 10
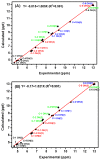
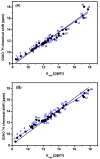
Calculated (at the GIAO/B3LYP/6-311G+(2d,p) level of theory with CPCM in CHCl3) vs. experimental chemical shifts of the OH protons of the compounds 1–35 of Figure 9 with minimization of the structures at the M06-2X/6-31+G(d) (A) and B3LYP/6-31+G(d) (B) level of theory, respectively. The blue line corresponds to the linear fit and the black line to the linear fit through the zero. Reprinted, with permission, from [47]. Copyright 2015, The Royal Society of Chemistry.
Figure 11
Figure 11
Calculated (at the GIAO/B3LYP/6-311G+(2d,p) level of theory with CPCM in CHCl3) vs. experimental chemical shifts of the OH protons of the compounds 1–43 of Figure 9 with minimization of the structures at the M06-2X/6-31+G(d) (A) and B3LYP/6-31+G(d) (B) level of theory, respectively. The blue line corresponds to the linear fit and the black line to the linear fit through the zero. Reprinted, with permission, from [47]. Copyright 2015, The Royal Society of Chemistry.
Figure 12
Figure 12
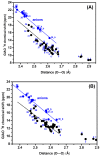
Calculated 1H chemical shifts [at the GIAO DFT/B3LYP/6-311+G(2d,p) level of theory with CPCM (CHCl3)] vs. O···O distances of the compounds of Figure 9 with minimization of the structures at the M06-2X/6-31+G(d) (A) and B3LYP/6-31+G(d) (B) level of theory. The notation b refers to the bent complex (see text and Table 1). Reprinted, with permission, from [47]. Copyright 2015, The Royal Society of Chemistry.
Figure 13
Figure 13
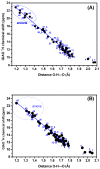
Calculated (at the GIAO/B3LYP/6-311+ G(2d,p) level of theory with CPCM in CHCl3) OH proton chemical shifts vs. calculated (O)H···O distances, Å, of the compounds of Figure 9 with minimization of the structures at the M06-2X/6-31+G(d) (A) and B3LYP/6-31+ G(d) (B) level of theory. The notation b refers to the bent complex (see text and Table 1). Reprinted, with permission, from [47]. Copyright 2015, The Royal Society of Chemistry.
Figure 14
Figure 14
Calculated, at the GIAO/B3LYP/6-311+G(2d,p) level of theory with CPCM in CHCl3, OH proton chemical shifts vs. calculated elongation of the O–H bond, Å, of the structures of the compounds of Figure 9 optimized at the M06-2X/6-31+G(d) level of theory. The notation b refers to the bent complex (see text and Table 1). Adopted, with permission, from [47]. Copyright 2015, The Royal Society of Chemistry.
Figure 15
Figure 15
Calculated, at the GIAO DFT/B3LYP/6-311+G(2d,p) level of theory with CPCM in CHCl3, chemical shifts of the compounds of Figure 9 with minimization of structures at the M06-2X/6-31+G(d) level of theory) vs. stabilization energy (Second Order Perturbation Theory Analysis) between the lone pairs of the oxygen of the carbonyl group with the σ* antibonding orbital of the H-O bond) (lone pair 1 in black, R2 = 0.946, lone pair 2 in green, R2 = 0.575, and the sum in blue, R2 = 0.921). Reprinted, with permission, from [47]. Copyright 2015, The Royal Society of Chemistry.
Figure 16
Figure 16
Plot of calculated Wiberg bond order of the intramolecular O···H(O) hydrogen bond of the compounds 1–35 of Scheme 3 vs. GIAO calculated 1H chemical shifts. The minimization of the structures and the NBO analysis were performed at the M06-2X/6-31+G(d) level of theory. Adopted, with permission, from [47]. Copyright 2015, The Royal Society of Chemistry.
Figure 17
Figure 17
Solvent dependent equilibrium of the 7,14-dioxo tautomer of hypericin HyH, Q7,14 (1), and its anionic form Hy (1a).
Figure 18
Figure 18
Variable temperature gradient 1H-NMR spectra of hypericin in acetone-d6 (neutral form (1), Figure 17), number of scans 128, 754 and 1952 for A, B and C, respectively. The asterisk denotes an unknown compound. Adopted, with permission, from [101]. Copyright 2002, by Elsevier Science Ltd.
Figure 19
Figure 19
(A) Calculated (δcalc, ppm) (at the GIAO B3LYP/6-311+G(2d,p) level of theory) vs. experimental values (δexp, ppm) of the 1H-NMR chemical shifts of neutral hypericin + 1 molecule of acetone with minimization of the structures at the B3LYP/6-31+G(d) (CPCM) (a) and at the TPSSh/TZVP (CPCM) (b), level of theory, respectively; (B) Calculated (δcalc, ppm) (at the GIAO B3LYP/6-311+G(2d,p) level of theory) vs. experimental values (δexp, ppm) of the 1H-NMR chemical shifts of neutral hypericin + 2 molecules of acetone with minimization of the structures at the B3LYP/6-31+G(d) (CPCM) (a) and at the TPSSh/TZVP (CPCM) (b) level of theory, respectively. Reprinted, with permission, from [50]. Copyright 2016, by Elsevier Science Ltd
Figure 20
Figure 20
Hydrogen bonded dimer of flurbiprofen (Form 1) based on the published X-ray structure [106], but with adjustment of the hydrogen atoms as obtained by computation. Reprinted, with permission, from [105]. Copyright 2005, The Royal Society of Chemistry.
Figure 21
Figure 21
Experimental and simulated, using geometries with only the proton positions relaxed, 1H-NMR spectrum of flurbiprofen in the solid state. Reprinted, with permission, from [105]. Copyright 2005, The Royal Society of Chemistry.
Figure 22
Figure 22
Calculated (δcalc) (at the GIAO DFT B3LYP/6-31 +G(2d,p) level of theory) vs. experimental values (δexp) of the 1H-NMR chemical shifts of hypericinate with minimization of the structure at the TPSSh/TZVP (IEF-PCM) level of theory, (a) and with the use of the X-ray structure [78] as input geometry; (b) Reprinted, with permission, from [50]. Copyright 2016, by Elsevier Science Ltd.

References

    1. Jeffrey G.A., Saenger S.W. Hydrogen Bonding in Biological Structures. Springer Verlag; Berlin, Germany: 1991.
    1. Jeffrey G.A. An Introduction to Hydrogen Bonding. Oxford University Press; New York, NY, USA: 1997.
    1. Scheider S. Hydrogen Bonding: A Theoretical Perspective. Oxford University Press; New York, NY, USA: 1997.
    1. Perrin C.L., Nielson J.B. “Strong” hydrogen bonds in chemistry and biology. Annu. Rev. Phys. Chem. 1997;48:511–544. doi: 10.1146/annurev.physchem.48.1.511. - DOI - PubMed
    1. Alkorta I., Rozas I., Elguero J. Non-conventional hydrogen bonds. Chem. Soc. Rev. 1998;27:163–170. doi: 10.1039/a827163z. - DOI