. 2017 Mar 8:8:14665.
doi: 10.1038/ncomms14665.

Defined chromosome structure in the genome-reduced bacterium Mycoplasma pneumoniae

Affiliations

Defined chromosome structure in the genome-reduced bacterium Mycoplasma pneumoniae

Marie Trussart et al. Nat Commun. .

Abstract

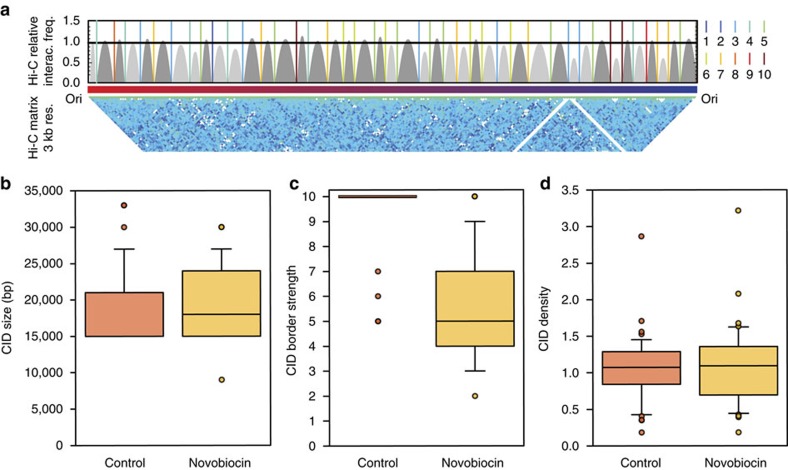
DNA-binding proteins are central regulators of chromosome organization; however, in genome-reduced bacteria their diversity is largely diminished. Whether the chromosomes of such bacteria adopt defined three-dimensional structures remains unexplored. Here we combine Hi-C and super-resolution microscopy to determine the structure of the Mycoplasma pneumoniae chromosome at a 10 kb resolution. We find a defined structure, with a global symmetry between two arms that connect opposite poles, one bearing the chromosomal Ori and the other the midpoint. Analysis of local structures at a 3 kb resolution indicates that the chromosome is organized into domains ranging from 15 to 33 kb. We provide evidence that genes within the same domain tend to be co-regulated, suggesting that chromosome organization influences transcriptional regulation, and that supercoiling regulates local organization. This study extends the current understanding of bacterial genome organization and demonstrates that a defined chromosomal structure is a universal feature of living systems.


Conflict of interest statement

The authors declare no competing financial interests.

Figures

Figure 1
Figure 1. Hi-C matrix and 3D models of the M. pneumoniae chromosome reveal a global symmetry with Ori and midpoint located at the two opposite poles.
(a) Normalized HpaII Hi-C contact map of M. pneumoniae, in stationary phase at a 10 kb resolution. The frequency of interactions between a given pair of bins is found at the intersection of the row and column corresponding to those bins. The colour of the contact map, from blue to red, indicates the log2 contact frequency. The bar underneath indicates position along the genome, with Ori being located at a genome coordinate of 0 and midpoint located at ∼ 400 kb. (b) Simplified genomic map showing the gene distribution across the chromosome, with black lines delimitating the genes. The colour indicates the strand position, with pink being the − strand and green the + strand. (c) A 3D density map representation of the 516 superimposed model structures from the first cluster of M. pneumoniae genome models. A central model, referred to as the centroid, is the model that is closest to the mean x,y,z coordinates of all the other models. This centroid is shown as a coloured tube starting with particle 1 in blue and ending with particle 82 in red, and uses the same colour code as the bar in a. The Ori and midpoint particles are highlighted with red and purple circles, respectively. The lighter colour represents the space occupied by all the models in the cluster, that is, the variability across the cluster.
Figure 2
Figure 2. Validation of chromosome dimensions and occupancy by DAPI staining and EM imaging.
(a) A DAPI-stained image showing the subcellular localization of DNA in M. pneumoniae. Scale bar, 1 μm. (b) Comparison of the estimated lengths and widths of both the DAPI and the estimated chromosome models in nanometre. Boxplot distribution and median values of length (775 nm) and width (482 nm) over 900 cells, here shown in orange, are estimated from the DAPI images. Boxplot distribution and median values of length (874 nm) and width (568 nm), estimated over 1,000 chromosome models are shown in blue. (c) Quick-freeze deep-etch replica TEM imaging of a M. pneumoniae cell. Scale bar, 200 nm. (d) Distribution and median volume of a M. pneumoniae cell based on electron microscopy over 25 cells (0.075 μm3; in yellow), on an estimation over 1,000 chromosome models (0.074 μm3; in blue), and on DAPI-based three-dimensional super-resolution microscopy over 130 cells (0.042 μm3; in orange).
Figure 3
Figure 3. Validation of 3D models with super-resolution imaging.
(a, top) FISH imaging with red (Alexa Fluor 568) indicating the genomic probes Ori, right, Midpoint, left, N1, N2 and N3, respectively, and green (Alexa Fluor 488) representing the P1 adhesin attachment organelle protein. Scale bar, 200 nm. (bottom) Boxplot distribution and median distances estimated between the genomic probes and AO over ∼50–70 cells. (b) Ori-midpoint, N1-midpoint, right-midpoint, N2-midpoint, N3-midpoint and left-midpoint estimated distances from chromosome models in the x axis and experimental FISH imaging in the y axis. Black lines indicate the variability within the estimated distribution. (c) 2D map representation of the chromosomal models from the first cluster shown in blue, with x and y coordinate positions shown in the x axis and y axis, respectively. Ori, left, right and midpoint positions across the first cluster of chromosome models are shown in red, pink, purple and green, respectively.
Figure 4
Figure 4. The M. pneumoniae chromosome is partitioned into domains of co-expressed genes.
(a) Hi-C HpaII filtered and normalized contact map at 3 kb resolution, rotated 45° with domain density plots. Each domain is represented by a grey-filled arc and delimited by a coloured line. The height of the domain is proportional to the relative number of interactions in this domain given its size. The colour code from blue to red, numbered 1–10, indicates the border strength or confidence score of the identification of domains. The y axis displays the relative Hi-C interaction frequencies and the horizontal line at y=1 indicates the expected frequency, given the domain size. If the Hi-C relative interaction frequency inside the CID is higher than 1, that is, higher than expected according to its size, then the domain is coloured in dark grey. Dashed grey rectangle has been zoomed-in in b. (b) Zoom-in region from a of three consecutive domains. Domain border are represented by grey lines in the Hi-C matrix. (c) Absolute mean co-expression distribution of gene pairs, when both genes are located within the same domain as shown in green, or genes between two different domains as shown in blue. Co-expression refers to the degree by which genes change in the same direction under different perturbations, between all pairs (i,j) of genes. Here, we compared the absolute mean co-expression of pairs of genes within and between domains. (d) Detailed absolute mean co-expression distribution across the 44 domains. Point sizes are proportional to border strength. The colour depicts, as before, the two cases of gene pairs within the same domain, shown in green, and gene pairs between different domains, shown in blue. (e) Absolute mean co-expression distribution as a function of genomic distance, with distances between gene pairs smaller than 30 kb for the same two cases as in b and any gene pairs across the whole genome, as shown in white.
Figure 5
Figure 5. Inhibiting supercoiling decreases the sharpness of domain borders.
(a) Same as Fig. 4a, but with Hi-C HpaII Novobiocin-treated contact map at 3 kb resolution. (bd) Boxplot distributions and median values of CID size, border strength and density distribution in wild-type (orange) and Novobiocin-treated (yellow) cells. The CID density is computed as the sum of all the Hi-C interactions in a domain divided by the expected number of interactions, where the expected number of interactions is computed as an average for each genomic distance. The units of the CID density are thus interactions normalized by the genomic distance.
Figure 6
Figure 6. Models of bacterial chromosome organization.
Models of nucleoid organization with Ori and Ter represented by red and purple circles. (a) Model of the E. coli genome with the four macro-domains Ori, Ter, left, right, represented by circles in red, purple, pink and blue, respectively. (b) Model of the B. subtilis genome adapted from ref. . (c) 3D models of the M. pneumoniae genome conformation.

Similar articles

Cited by

References

    1. Cremer T. & Cremer C. Chromosome territories, nuclear architecture and gene regulation in mammalian cells. Nat. Rev. Genet. 2, 292–301 (2001). - PubMed
    1. Misteli T. Beyond the sequence: cellular organization of genome function. Cell 128, 787–800 (2007). - PubMed
    1. Dorman C. J. Genome architecture and global gene regulation in bacteria: making progress towards a unified model? Nat. Rev. Microbiol. 11, 349–355 (2013). - PubMed
    1. Baranello L., Levens D., Gupta A. & Kouzine F. The importance of being supercoiled: how DNA mechanics regulate dynamic processes. Biochim. Biophys. Acta 1819, 632–638 (2012). - PMC - PubMed
    1. Dillon S. C. & Dorman C. J. Bacterial nucleoid-associated proteins, nucleoid structure and gene expression. Nat. Rev. Microbiol. 8, 185–195 (2010). - PubMed

Publication types

MeSH terms