. 2017 Mar 8:7:43936.
doi: 10.1038/srep43936.

Plasmalogen biosynthesis is spatiotemporally regulated by sensing plasmalogens in the inner leaflet of plasma membranes

Affiliations

Plasmalogen biosynthesis is spatiotemporally regulated by sensing plasmalogens in the inner leaflet of plasma membranes

Masanori Honsho et al. Sci Rep. .

Abstract

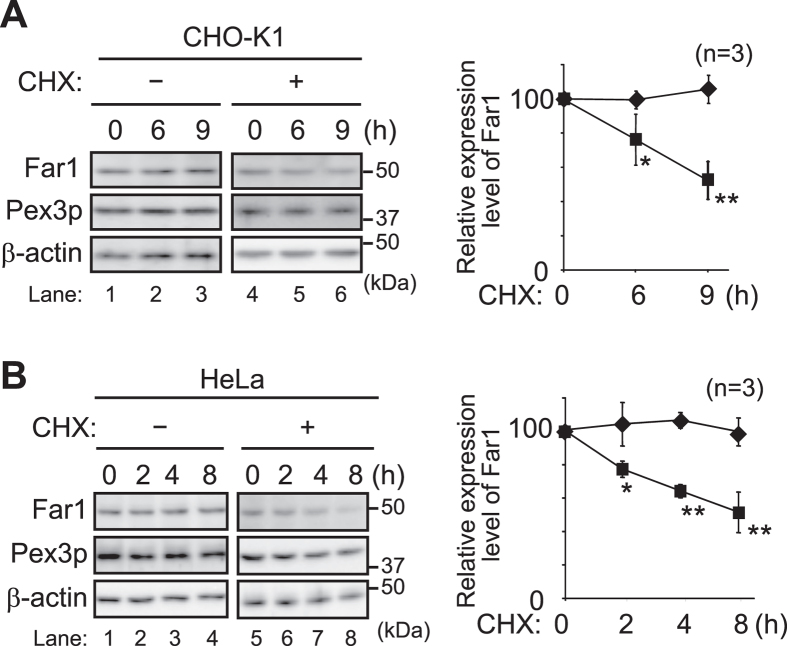
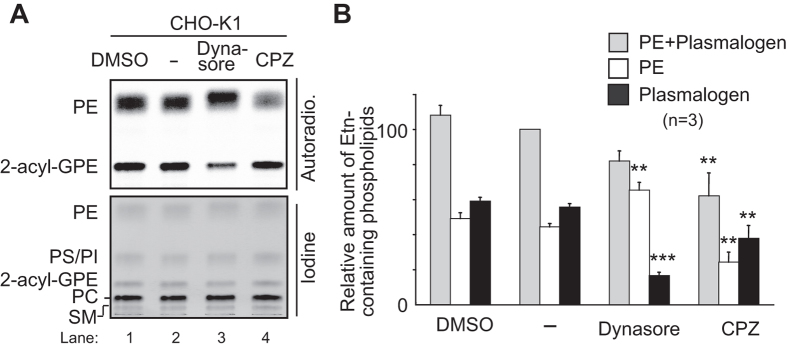
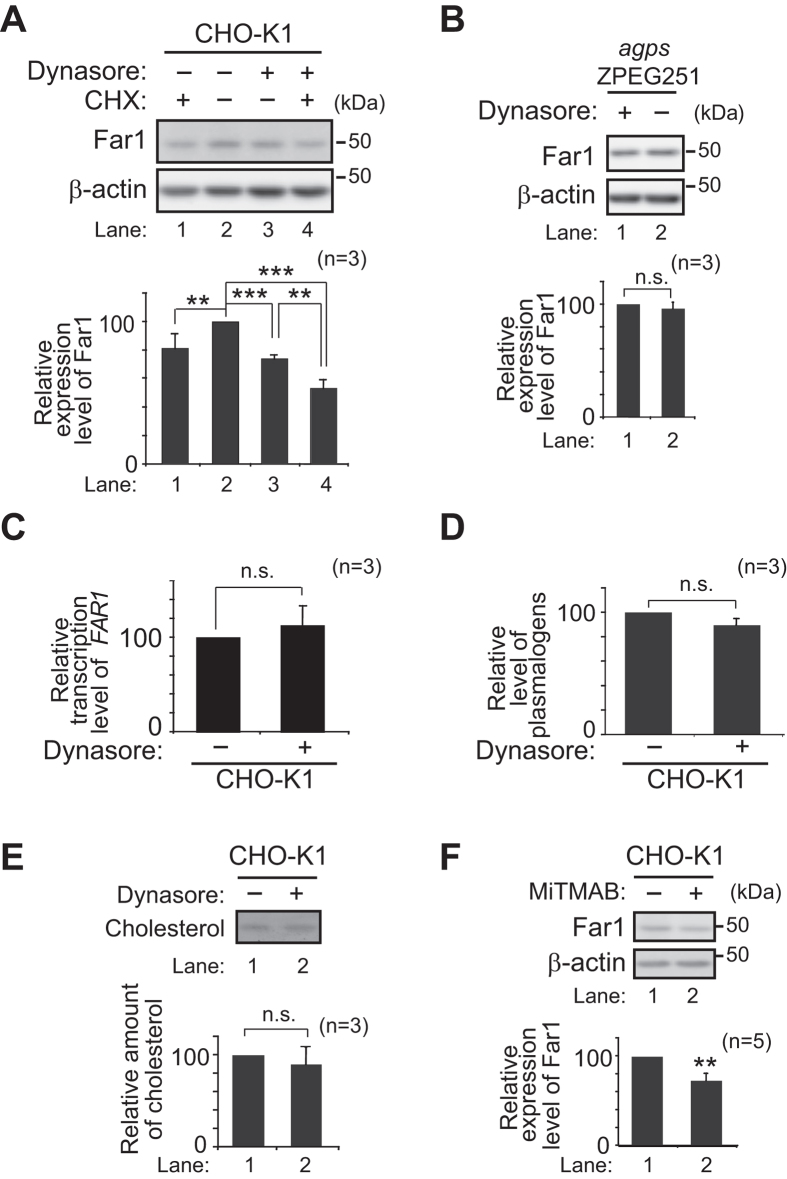
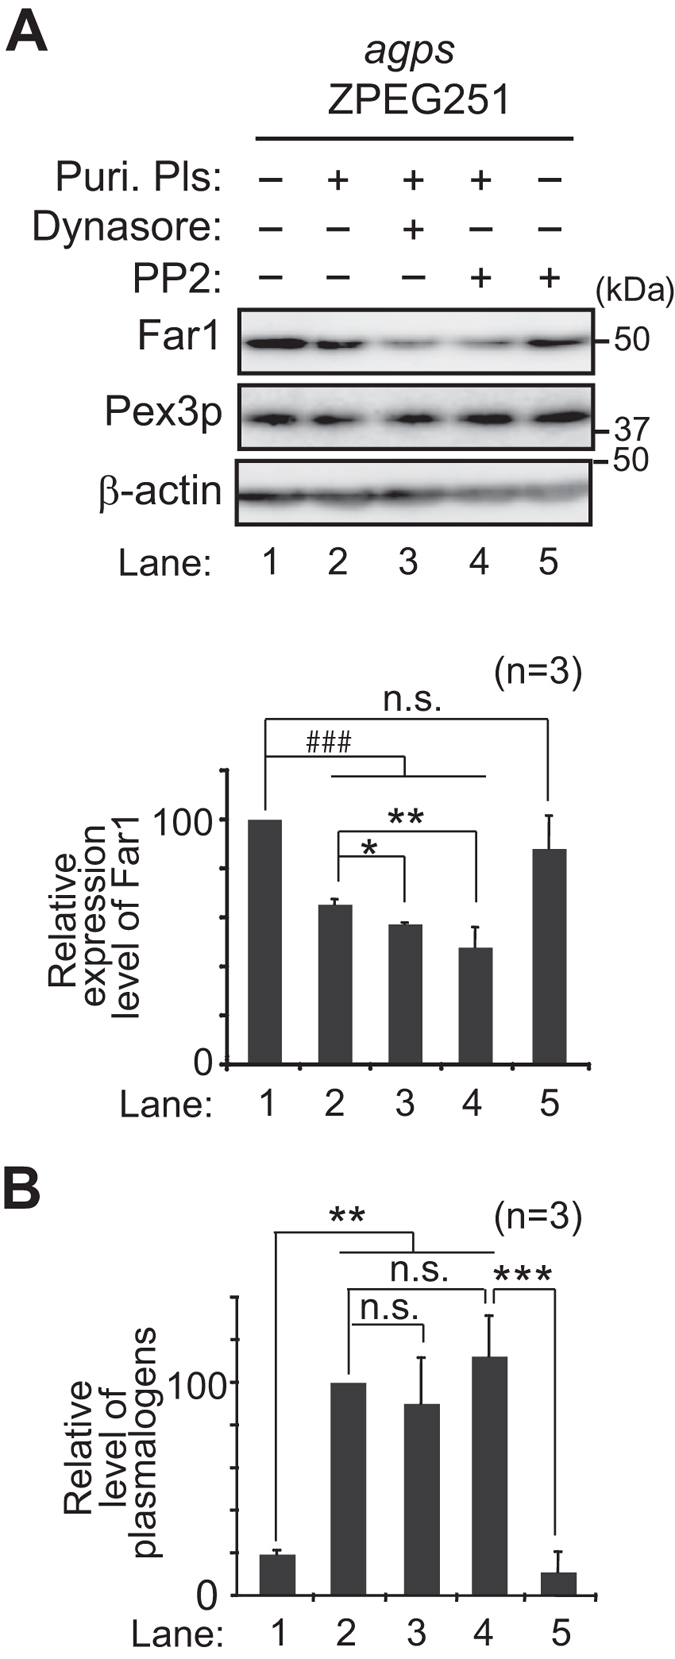
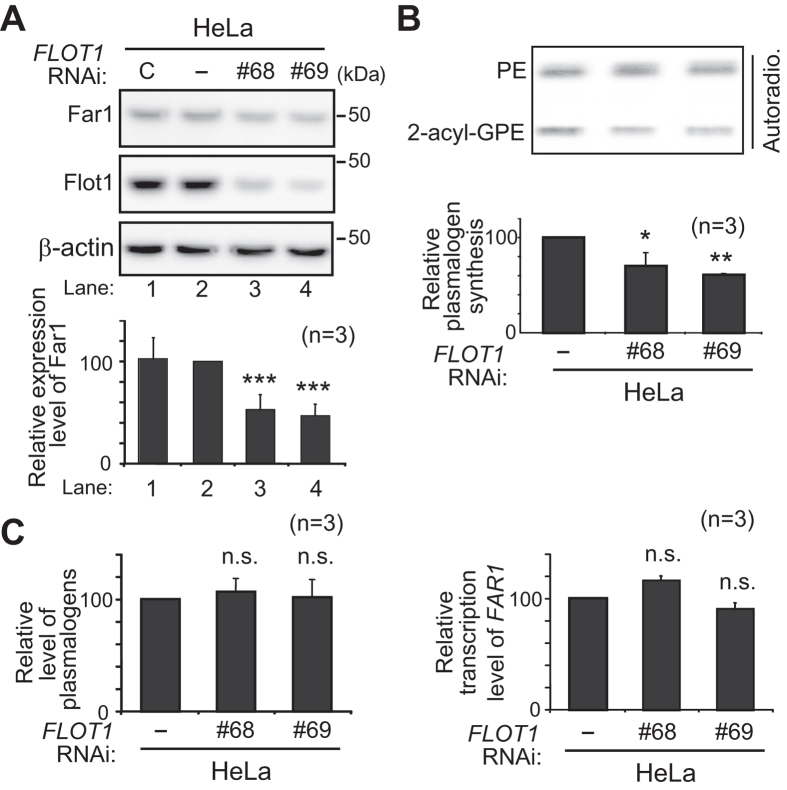
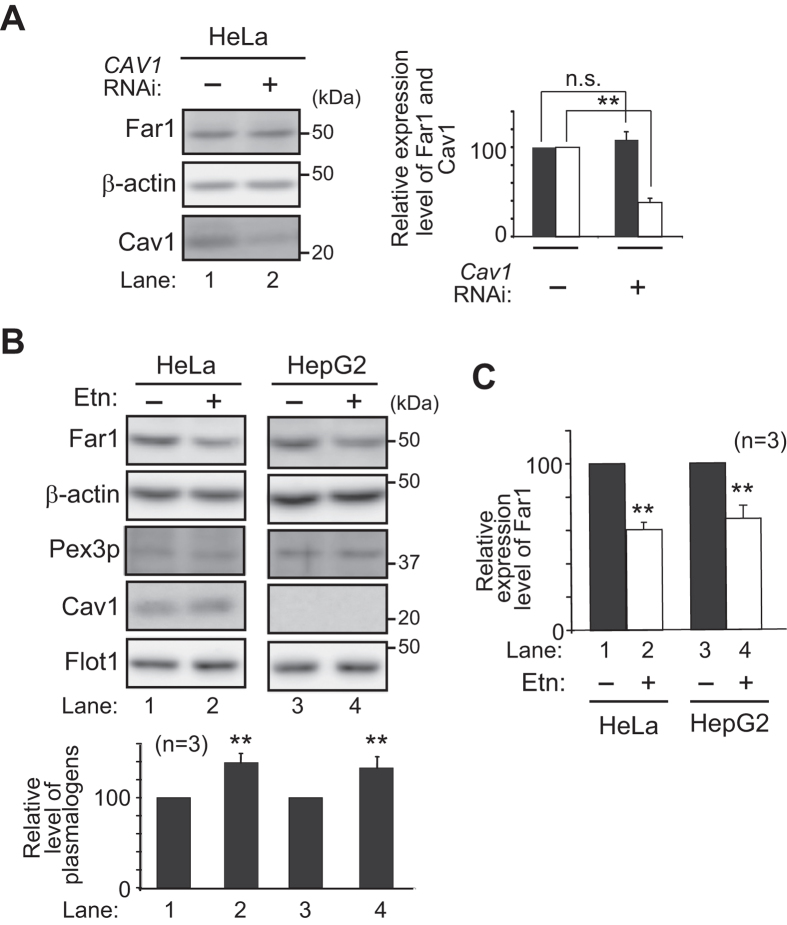
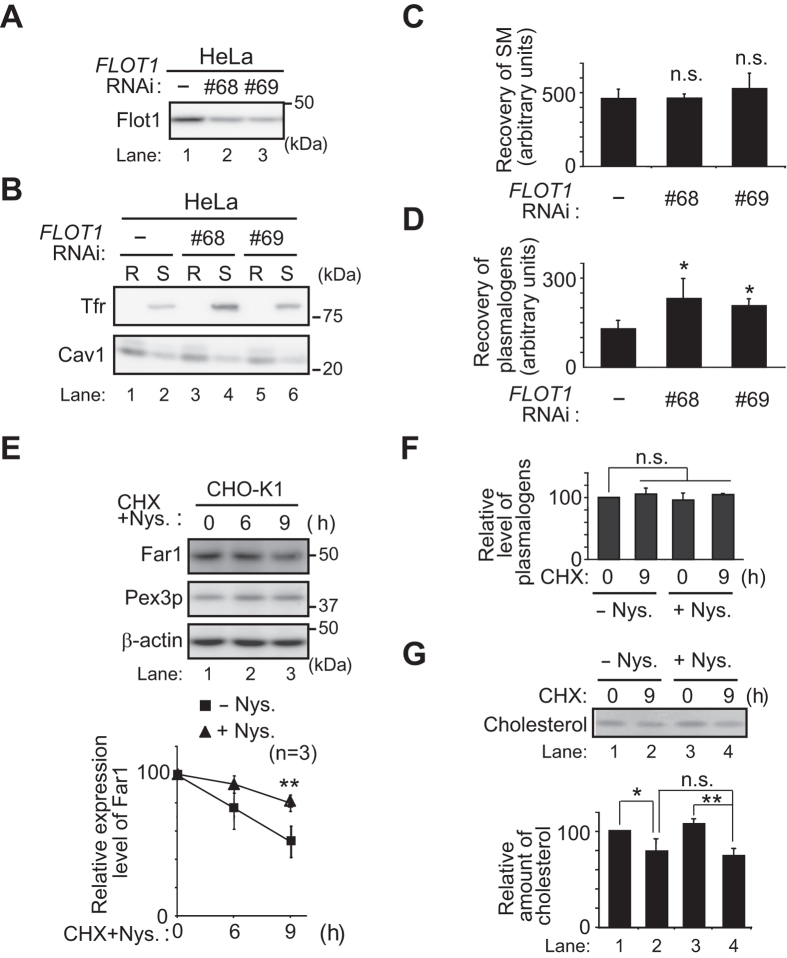
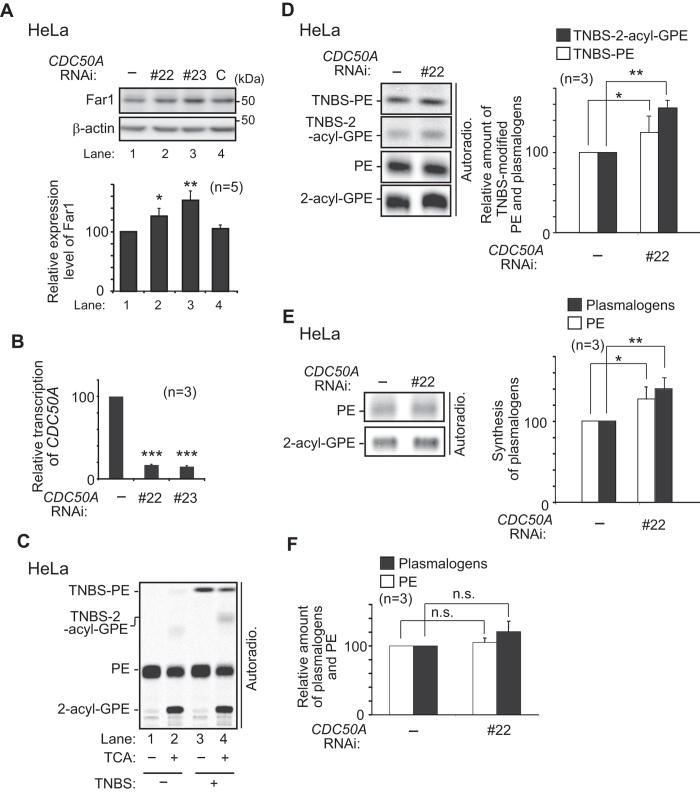
Alkenyl ether phospholipids are a major sub-class of ethanolamine- and choline-phospholipids in which a long chain fatty alcohol is attached at the sn-1 position through a vinyl ether bond. Biosynthesis of ethanolamine-containing alkenyl ether phospholipids, plasmalogens, is regulated by modulating the stability of fatty acyl-CoA reductase 1 (Far1) in a manner dependent on the level of cellular plasmalogens. However, precise molecular mechanisms underlying the regulation of plasmalogen synthesis remain poorly understood. Here we show that degradation of Far1 is accelerated by inhibiting dynamin-, Src kinase-, or flotillin-1-mediated endocytosis without increasing the cellular level of plasmalogens. By contrast, Far1 is stabilized by sequestering cholesterol with nystatin. Moreover, abrogation of the asymmetric distribution of plasmalogens in the plasma membrane by reducing the expression of CDC50A encoding a β-subunit of flippase elevates the expression level of Far1 and plasmalogen synthesis without reducing the total cellular level of plasmalogens. Together, these results support a model that plasmalogens localised in the inner leaflet of the plasma membranes are sensed for plasmalogen homeostasis in cells, thereby suggesting that plasmalogen synthesis is spatiotemporally regulated by monitoring cellular level of plasmalogens.


Conflict of interest statement

The authors declare no competing financial interests.

Figures

Figure 1
Figure 1. Plasmalogen-iduced degradation of Far1 in wild-type cells.
CHO-K1 (A) and HeLa (B) cells were cultured in the presence (+) or absence (−) of CHX for the indicated time. Expression level of Far1 at each time point in the absence (diamond) or presence (square) of CHX was assessed. Peroxisomal membrane protein Pex3p and β–actin for a loading control were detected with respective specific antibodies (left panels). Molecular masses were indicated on the right, using the migration of standard mass markers. Relative amounts of Far1 at each time point were represented by taking as 100 those at the time point of CHX addition in respective cells (right panels). *p < 0.05, **p < 0.01; Student’s t test compared with the expression level of Far1 at each time point in the absence of CHX. Data of unprocessed original blots are available in Supplementary Fig. S2.
Figure 2
Figure 2. Dynasore reduces plasmalogen synthesis.
(A) CHO-K1 cells were incubated with DMSO, Dynasore, or CPZ for 30 min and further metabolically labelled with 14C-Etn for 5 h in the absence (−) and presence of each inhibitor. The biosynthesis of PE and plasmalogen (2-acyl-GPE) were detected with a FLA-5000 imaging analyser (upper panel). Total cellular level of phospholipids including PE, PS, phosphatidylinositol (PI), plasmalogens, phosphatidylcholine (PC), and SM were detected with iodine vapor (lower panel). Note that biosynthesis of plasmalogens was specifically reduced in the presence of Dynasore. (B) Biosynthesis of PE (open bar), plasmalogens (dark grey bar), PE plus plasmalogens (light grey bar) was represented by taking the amounts of PE plus plasmalogens as 100 in mock-treated (−) CHO-K1. Statistical analysis was performed by one-way ANOVA with Dunnett’s post hoc test as compared with the synthesis of respective lipids in mock-treated cells. *p < 0.05, **p < 0.01, and ***p < 0.001.
Figure 3
Figure 3. Expression level of Far1 is reduced in the presence of Dynasore.
(A) CHO-K1 cells were cultured for 5 h in the presence (+) of CHX (lane 1), Dynasore (lane 3), or CHX plus Dynasore (lane 4) and were assessed for the expression level of Far1 (upper panel). β–actin was used as a loading control. Relative expression levels of Far1 were represented by taking those as 100 in mock-treated cells (lane 2, lower panel). Note that Far1 expression was reduced in the presence of Dynasore in CHO-K1 cells (lane 3). **p < 0.01 and ***p < 0.001; two-way ANOVA with Tukey-Kramer post hoc test. (B) agps ZPEG251 was cultured for 5 h in the presence (+) or absence (−) of Dynasore and were assessed for the expression level of Far1 (upper panel). Relative expression levels of Far1 were represented by taking those as 100 in mock-treated cell (lower panel). n.s., not significant; t test. (C) Expression level of FAR1 relative to β–Actin was determined by real-time PCR using total RNA, and represented by taking as 100 that in CHO-K1 (−). n.s., not significant; t test. (D) Total cellular plasmalogens were analysed by LC-ESI-MS/MS and represented by taking that as 100 in CHO-K1 (−). n.s., not significant; t test. (E) Lipids were extracted from cells cultured in the absence (−) or presence (+) of Dynasore and assessed by TLC (upper panel) as described in Materials and Methods. Cholesterol was detected with iodine vapor and quantified (lower panel) using an image analysis software (Multi Gauge). n.s., not significant; t test. (F) CHO-K1 cells were cultured for 5 h in the presence (+) or absence (−) of MiTMAB and assessed for the expression level of Far1 (upper panel). Relative expression levels of Far1 were represented by taking those as 100 in mock-treated cells (lower panel). **p < 0.01; t test. Data of unprocessed original blots are available in Supplementary Fig. S2.
Figure 4
Figure 4. Src family kinase inhibitor PP2 induces degradation of Far1.
(A) agps ZPEG251 was cultured in the presence (lanes 2–4) or absence (lanes 1 and 5) of purified plasmalogens (puri. Pls) for 6 h, and further cultured in the presence of Dynasore (lane 3) or PP2 (lanes 4 and 5) for 5 h. Expression levels of Far1 were assessed by immunoblotting (upper panel) and represented (lower panel) by taking as 100 that in ZPEG251 (lane 1). ###p < 0.001; one-way ANOVA with Dunnett’s post hoc test as compared with mock-treated cells. n.s., not significant. *p < 0.05 and **p < 0.01; one-way ANOVA with Dunnett’s post hoc test as compared with ZPEG251 treated with purified plasmalogens (lane 2). (B) Cellular plasmalogens were analysed by LC-ESI-MS/MS and represented by taking as 100 that in ZPEG251 cultured in the presence of purified plasmalogens (lane 2). **p < 0.01 and ***p < 0.001; one-way ANOVA with Tukey post hoc test as compared with ZPEG251. n.s., not significant. Data of unprocessed original blots are available in Supplementary Fig. S2.
Figure 5
Figure 5. Knockdown of FLOT1 lowers Far1 expression.
(A) Expression levels of Far1 and Flot1 were assessed in HeLa cells transfected with control dsRNA (lane 1) or two different dsRNAs (lanes 3 and 4) against FLOT1. Expression level of Far1 was represented by taking as 100 that in mock-treated cell (lower panel). (B) Plasmalogen synthesis was assessed in mock-treated (−) or FLOT1-knocked down (#68 and #69) HeLa cells by metabolically labelling with 14C-Etn for 2 h (upper panel). Biosynthesis of plasmalogens was represented by taking as 100 that in mock-treated cells (lower panel). *p < 0.05, **p < 0.01, and ***p < 0.001; one-way ANOVA with Dunnett’s post hoc test as compared with mock-treated cells. (C) Left panel, total cellular level of plasmalogens was represented by taking as 100 that in mock-treated cells. Right panel, expression level of FAR1 relative to ribosomal protein 3 (RPL3) was determined by real-time PCR using total RNA, and represented by taking as 100 that in HeLa cells (−). n.s., not significant; one-way ANOVA with Dunnett’s post hoc test as compared with mock-treated cells. Data of unprocessed original blots are available in Supplementary Fig. S2.
Figure 6
Figure 6. Far1 is degraded in the absence of caveolae.
(A) Expression levels of Far1 (solid bar) and Cav1 (open bar) were assessed in HeLa cells transfected with dsRNAs against CAV1. β–actin was used as a loading control. Expression level of Far1 was represented by taking as 100 that in mock-treated cell (right panel). **p < 0.01; t test versus mock-treated cells. n.s., not significant. (B) HeLa and HepG2 were cultured in the presence of Etn (5 μM) for 48 h and assessed for expression level of Far1, β–actin, Pex3p, Cav1, and Flo1. Note that Cav1 is not expressed in HepG2 cells. Cellular plasmalogens were analysed by LC-ESI-MS/MS and represented by taking those as 100 in mock-treated respective cells. **p < 0.01; t test versus mock-treated respective cells. (C) Expression level of Far1 was represented by taking those as 100 in mock-treated respective cells. **p < 0.01; t test versus mock-treated respective cells. Data of unprocessed original blots are available in Supplementary Fig. S2.
Figure 7
Figure 7. Knockdown of FLOT1 elevates the amount of plasmalogens and nystatin inhibits degradation of Far1.
(A) HeLa cells were transfected with two different dsRNAs (lanes 2 and 3) against FLOT1 and expression of Flot1 was assessed. (B) DRMs (R) and detergent-soluble (S) fractions were prepared as described in Materials and Methods and distribution of Cav1 and Tfr was assessed using respective antibodies. (C,D) Amount of SM (C) and plasmalogens (D) in DRMs prepared as in (B) was determined by LC-ESI-MS/MS and represented by arbitrary units. *p < 0.05; one-way ANOVA with Dunnett’s post hoc test versus mock-treated HeLa cells. n.s., not significant. (E) CHO-K1 cells were cultured for 1 h with nystatin (Nys.), a cholesterol-chelating agent, further incubated for the indicated time in the presence of CHX, and assessed for the expression of Far1 at each time point (upper panel). β–actin was used as a loading control. Relative amounts of Far1 in the presence (triangle) of nystatin at each time point were represented by taking as 100 that at the time point of CHX addition. The relative expression level of Far1 in the absence (square) of nystatin was from Fig. 1A (left panels). **p < 0.01; t test compared with the expression level of Far1 at 9 h in the absence of nystatin. (F) Cellular plasmalogens in CHO-K1 cells cultured in the absence (−Nys.) or presence (+Nys.) of nystatin were analysed by LC-ESI-MS/MS and their relative level was represented by taking as 100 that at (0 h, -Nys.). n.s., not significant by two-way ANOVA. (G) Lipids were extracted from cells cultured as in (F). Cholesterol was detected as described in Fig. 3E. Relative amount of cholesterol is represented by taking as 100 that at (0 h, -Nys.). *p < 0.05 and **p < 0.01; two-way ANOVA with Tukey post hoc test. n.s., not significant. Note that cellular cholesterol was reduced by the treatment of CHX but not with nystatin.
Figure 8
Figure 8. Elevation of plasmalogens localised at the outer leaflet of plasma membrane by CDC50A knockdown increases the expression of Far1.
(A) Expression level of Far1 was assessed in mock-treated HeLa cells (−) or cells transfected with control dsRNA (C) or two different dsRNAs (#22 and #23) against CDC50A (upper panel). β–actin was used as a loading control. Expression level of Far1 was represented by taking as 100 that in mock-treated cell (lower panel). *p < 0.05 and **p < 0.01; one-way ANOVA with Dunnett’s post hoc test versus mock-treated cells. (B) HeLa cells were cultured as described in (A). Expression level of CDC50A relative to RPL3 was determined by real-time PCR using total cell RNA. ***p < 0.001; one-way ANOVA with Dunnett’s post hoc test versus mock-transfected cells (−). (C) HeLa cells were cultured in the presence of 14C-Etn for 18 h and further incubated with (+) or without (−) TNBS. Total cellular lipids were extracted from aliquots of equal amounts of cell proteins before (−) or after (+) treatment with TCA and analysed by TLC. (D) PE and plasmalogens localised at the outer leaflet of plasma membrane were verified as in (C) in mock-transfected HeLa cells (−) or CDC50A-knocked down cells by transfection with dsRNA (#22) (left panel). Relative amounts of TNBS-modified PE (TNBS-PE, open bar) and plasmalogens (TNBS-2-acyl-GPE, solid bar) were represented by taking as 100 those in mock-transfected cells (right panel). *p < 0.05 and **p < 0.01; t test versus mock-transfected cells. (E) Plasmalogen synthesis was assessed in mock-transfected (−) or CDC50A-knocked down (#22) HeLa cells by metabolically labelling with 14C-Etn for 5 h (left panel). Biosynthesis of PE (open bar) and plasmalogens (solid bar) was represented by taking as 100 those in mock-transfected cells (right panel). *p < 0.05 and **p < 0.01; t test versus mock-transfected cells. (F) Relative level of PE (open bar) and plasmalogens (solid bar) in CDC50A-knocked down (#22) HeLa cells was represented by taking as 100 those in mock-transfected cells. n.s., not significant; t test versus mock-transfected cells. Data of unprocessed original blots are available in Supplementary Fig. S2.

References

    1. Nagan N. & Zoeller R. A. Plasmalogens: biosynthesis and functions. Prog. Lipid Res. 40, 199–229 (2001). - PubMed
    1. Honsho M., Yagita Y., Kinoshita N. & Fujiki Y. Isolation and characterization of mutant animal cell line defective in alkyl-dihydroxyacetonephosphate synthase: Localization and transport of plasmalogens to post-Golgi compartments. Biochim. Biophys. Acta 1783, 1857–1865 (2008). - PubMed
    1. Cheng J. B. & Russell D. W. Mammalian wax biosynthesis. I. Identification of two fatty acyl-coenzyme a reductases with different substrate specificities and tissue distributions. J. Biol. Chem. 279, 37789–37797 (2004). - PMC - PubMed
    1. Honsho M., Asaoku S. & Fujiki Y. Posttranslational regulation of fatty acyl-CoA reductase 1, Far1, controls ether glycerophospholipid synthesis. J. Biol. Chem. 285, 8537–8542 (2010). - PMC - PubMed
    1. Honsho M., Asaoku S., Fukumoto K. & Fujiki Y. Topogenesis and homeostasis of fatty acyl-CoA reductase 1. J. Biol. Chem. 288, 34588–34598 (2013). - PMC - PubMed

Publication types

MeSH terms